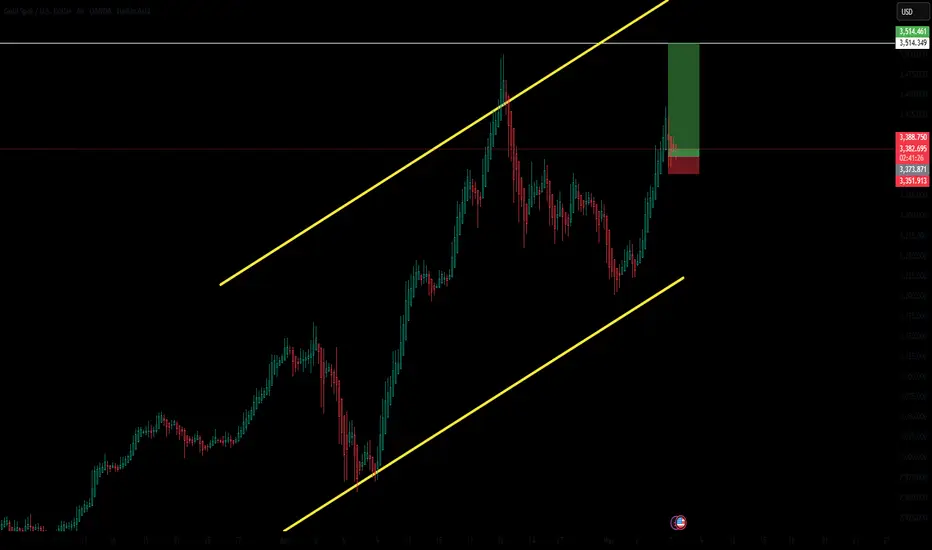
Gold to 3510 ?There is a possible bulllish move on the 4 hour chart.
Fed meeting will give gold a boost.
Stop loss: 3350
Take profit: Around 3510
Goldlong
GOLD Shorter Term Chart Update for 7 May 2025Currently GOLD is in Bullish Trend, we might see some correction around 3330 level for downside in case market breaks 3350 Psychological Level Clearly
For upside move market must Breaks & sustain clearly above 3400 Psychological Level
Plan your trades Carefully

Gold is once again experiencing its extreme take-off trend!📌Fundamentals:
1. There are signs of escalation in the India-Pakistan conflict
2. The Fed's interest rate decision dominates this week's market
3. The international trade situation disturbs market sentiment
4. Market sentiment and capital flows
📊Technical aspects:
The 4-hour cycle still needs a wave of strength, and it needs to go out of a wave of big rises before it can open the Bollinger upper track to form an absolute unilateral strength. Therefore, although it is temporarily bullish, there is also a certain possibility of adjustment. The current 4-hour cycle support is around 3310, and the small cycle performance support is around 3350, so don't chase more.
🎯Practical strategy:
Gold pulls back to around 3365-3375 to go long, and the target is around 3400-3420.

Gold is rising strongly. When can the bull market stop?🗞News side:
1. Trump announces renegotiation of USMCA
2. Pay attention to the Fed interest rate
📈Technical aspects:
Looking at the daily chart, gold prices are breaking through important resistance levels and forming a strong upward trend. The price is currently trading around 3410, with strong suppression at 3420-3430 above the short-term. If the gold price encounters resistance and pressure, gold may once again experience a correction. Therefore, when the gold price touches the 325-3435 line, you can try to place a short position. In terms of operation, after two consecutive positive days on the technical front, the bulls will continue further. The current short-term support has moved up to the 3386 line. 3386 is the early resistance that turned into support after breaking through. This will be an important support level. At the same time, the 3270-3260 line support below is still strong. Continue to look at the 3430-3450 line. Therefore, in terms of operation, we mainly do long positions on callbacks and supplementary short positions on rebounds.
If you agree with this view, or have a better idea, please leave a message in the comment area. I look forward to hearing different voices.
OANDA:XAUUSD FX:XAUUSD FXOPEN:XAUUSD FOREXCOM:XAUUSD TVC:GOLD

The most important golden strategy📌Fundamentals:
Focus on the Federal Reserve's interest rate decision
📊Technological aspects:
From the golden hour chart, the Asian market is in line with a wave of continued gains and the subsequent adjustment to the 10 moving average of 3350 has stabilized. The European market has slowly moved higher and is approaching the Asian market high. This pattern is still very strong, and there is a high probability of a second rise tonight; The 10 EMA is above 3370 as the primary support and continues to be bullish. As each line closes, the moving support will slowly move up. As long as it does not effectively break, the short squeeze will continue. A breakthrough of 3410 will also happen at any time. If it breaks through, it will be easy to continue to storm above 3420. If it rushes higher and falls back in the evening and falls below the 10 EMA, then If it adjusts to the middle track for the first time, there will still be good support, just continue to be bullish; comprehensively speaking, today's short-term gold operation ideas suggest that the callback is mainly long, and the rebound is supplementary.
🎯 Practical Strategy:
Short strategy: short gold when it rebounds around 3425-3430, target around 3400-3380.
Long strategy: long gold when it pulls back around 3365-3370, target around 3400-3420.

There's still a little more left to sip from gold’s cup
Weekly Outlook on Gold (XAUUSD)
Gold has formed a classic cup pattern on the weekly timeframe, indicating a strong bullish continuation setup. If the pattern completes successfully, we could see a move toward the top of the channel, targeting the 4039 – 4100 zone.
The recent pullback to 3208 was a retest of the previously broken daily structure, acting as a healthy correction before the next potential leg up.
For those looking to enter this move, an ideal strategy would be to place a buy stop order above the last high, as a breakout confirmation.
⚠️ Important note: If the black trendline on the daily chart (which represents the current bullish structure) gets broken to the downside, the trade setup would become invalid and a reassessment would be required.
✅ The best approach is to wait for a clean breakout above the 3495 resistance, then look for a pullback entry on lower timeframes with proper risk management.
📉 In the longer term, we still expect a potential retracement all the way back to the 2199.661 level — so be aware of the bigger picture and adapt as the structure evolves.


WHAT DO YOU THINK ?Hello dears
Given the regular sinusoidal trend that gold is taking, it was expected to move to the specified numbers, but don't forget that we are at a price ceiling and a sharp upward movement at the end of the upward trend can be a trap...
In case of a drop, the specified ranges are good support.
*Trade safely with us*

Gold XAUUSD Move 06.05.2025🔹 BUY-1: 3350–3355 Zone
Conditions to Enter:
Support must hold at the 3350–3355 zone.
Wait for a clear bullish M15 candle close above the support area to confirm strength.
Rationale:
This zone overlaps with a Fresh Demand Zone identified on your chart.
Entry here takes advantage of potential accumulation and demand absorption.
It's an early entry with a tighter stop loss (just below 3346–3350).
Ideal Setup:
Stop Loss: Below 3346.
Target: Near 3380–3400 zone or higher depending on momentum.
🔹 BUY-2: 3380–3385 Zone
Conditions to Enter:
Price must break above the 3380–3385 resistance zone.
Wait for a successful retest and bullish confirmation (engulfing/imbalance/M15 close above).
Rationale:
This is the breakout and retest trade mentioned on the chart.
Entering after confirmation reduces risk of a fakeout.
Aligns with institutional breakout behaviors.
Ideal Setup:
Stop Loss: Below the retest candle or previous structure (~3370 area).
Target: 3410–3430+ depending on R/R and momentum continuation.
Kindly show your support by follow, comment and share.

XAUUSD (GOLD) | 4H | SWING TRADING Good morning, my friends,
Gold is currently at the 3355.0 level.
Even if gold makes a correction at this point, my target remains 3461.0.
This is a swing trading model, so there may be delays in reaching my target. However, I am confident that I will reach it eventually.
Once we hit that level, I will share an update for you all.
Dear friends, your likes are always my biggest motivation to keep sharing analyses. That’s why I kindly ask each of my followers to show their support—please don’t hold back on the likes.
I sincerely thank everyone who supports me with their likes. It truly means a lot

Short-term entry can be made at key points.📊Technical aspects:
|Gold showed a clear upward trend today driven by risk aversion, mainly because Trump announced a 100% tariff on films produced overseas, a move that triggered global concerns about trade wars and exacerbated economic uncertainty. In order to avoid risks, investors have turned to traditional safe-haven assets such as gold, resulting in a surge in demand for gold and a subsequent rise in prices. Currently, from the perspective of technical indicators, the 4-hour moving average is in a bullish arrangement, the Bollinger band is in an enlarged form, and the gold price is running close to the upper Bollinger band. Gold is still bullish, but the RSI shows overbought. Don't chase highs and beware of gold's highs and falls. It is recommended to go long again after a pullback.
🎯Practical strategy:
Go long when gold falls back to around 3385-75, with a target of around 3400. If it does not break, you can go short near 3400 and see a fall back near 3384.

Take profit for long orders during the day, the callback continu
Gold pulled back and went long and successfully stopped profit. Today's latest trading ideas are shared
Gold hit a high of 3386 in the morning and then fell back under pressure to reach a low of 3350. The long orders at the 3358 line that we shared with you gave several opportunities to enter the market, and the 3390 line target was realized as expected. At present, geopolitical conflicts have erupted again, and risk aversion is high. Today, we will pay attention to the pressure at the 3400 mark. If it pulls back, we will continue to go long, and shorting is also a short-term idea!
Gold trading reference ideas
Gold pulled back to 3376 and went long, defending 3368, with a target of 3400. If it breaks up, we can go short near 3416/20. If it does not break, we can go short near 3400, with a stop loss of 3406, and look for a pullback near 3384.

Gold Completes Wave 4 - Pullback – Time for the Next PushGold ( OANDA:XAUUSD ) touched $3,223 as I expected in the previous idea (Full Target) .
Gold has managed to break the Resistance zone($3,308-$3,293) and is trying to break the Resistance lines and complete the pullback .
In terms of Elliott wave theory , it seems that Gold is completing microwave 4 , which could act as a pullback to the broken Resistance zone($3,308-$3,293) . After the completion of microwave 4 , we should expect Gold to attack the Resistance lines to complete microwave 5 .
I expect Gold to rise to at least $3,232 , and if the Resistance zone($3,387-$3,357) breaks, we can expect further gains .
Note: If Gold touches $2,272 (the worst Stop Loss(SL)), we can expect further declines.
Gold Analyze ( XAUUSD ), 1-hour time frame.
Be sure to follow the updated ideas.
Do not forget to put a Stop loss for your positions (For every position you want to open).
Please follow your strategy; this is just my idea, and I will gladly see your ideas in this post.
Please do not forget the ✅' like '✅ button 🙏😊 & Share it with your friends; thanks, and Trade safe.

Long positions in the US market remain the main trend🗞News side:
1. The “demand shock” of the Trump administration’s tariffs on the global economy
2. The United States rejected Japan’s request for a comprehensive exemption from 10% reciprocal tariffs and country-specific tariffs in recent negotiations.
3. The conflict between Israel and the Houthis
📈Technical aspects:
The 4H golden moving average spreads upward, the MACD golden cross opens upward, and the 4H overall bullish trend is seen. Gold price encountered resistance at 3386 in the morning of the Asian session. This point can be used as a reference in suppressing the market outlook. If this resistance is effectively broken through, bulls are expected to continue to work towards the 3400 first-line mark above. The daily chart is positive, and the K-line combination is relatively strong. The US market is expected to break through 3386 and reach the space above 3400; the SMA10 moving average of 3370 continues to be bullish as the primary support, with strong resistance to 3400. Even if the price of gold in the US market rises and falls, the middle track of the Bollinger Bands still has good support. On the whole, we mainly focus on long positions in short-term trading. We can consider the 3370-3380 layout to go long, with the target looking towards 3400-3410 above.
If you agree with this view, or have a better idea, please leave a message in the comment area. I look forward to hearing different voices.
TVC:GOLD FOREXCOM:XAUUSD FXOPEN:XAUUSD FX:XAUUSD OANDA:XAUUSD

Gold is in line with the uptrend
After yesterday's sharp rise from 3238, spot gold continued to climb in the Asian market on Tuesday. The price of gold has now broken through the highest level of 3386 US dollars per ounce, and the daily increase is nearly 28 US dollars. At present, the price of gold remains close to the new record, and the rise is far from over. The global trade war has caused market concerns and continued to push the price of gold to new highs. Gold has become an asset for a new round of investment boom!
The market boom is coming, and the gold bulls are coming?
Banking giant Goldman Sachs released a bullish forecast report on gold, saying that if a recession becomes a reality, the gold price target will reach 3880 US dollars per ounce by the end of 2025. The forecast is based on the expectation that concerns about a recession will accelerate the inflow of funds into gold exchange-traded funds (ETFs), thereby pushing up gold prices.
In addition, Goldman Sachs warned that if the Federal Reserve loses its independence, the price of gold may soar to 4500 US dollars per ounce.
What do you think of today's gold trend!
Looking back at the current gold and silver, from the market point of view, the gold price trend has been stabilizing above the middle track, and the cycle bulls continue to line up. From the indicator point of view, the middle track has been hooking upward, and there is still room for an upward rebound in the short term. In addition, gold started from 3322 last week, and directly rose from 3322 to 3387. Now it is around 3367. So there is a point to pay attention to today, that is, the position of the middle track of 3334. It is still difficult to say whether it can be stepped back.
Don't expect a deep callback. The only difference between the oscillating market and the unilateral market is that the oscillation will come back, while the unilateral market will not. This is why we always emphasize the need to bring a good stop loss. In terms of the cycle rhythm, we have been participating in the cycle of time and space last week. At present, we can still participate in this pattern. There is one opportunity in the European and US markets. We will start at this time point during the day!
Gold: More near 3350, defend 40, and target the resistance of 3385-90! If it breaks below, wait for the two support levels of 3334-20 before considering!

Gold returns to the bull market as expected, follow-up layout🗞News side:
1. The “demand shock” of the Trump administration’s tariffs on the global economy
2. The United States rejected Japan’s request for a comprehensive exemption from 10% reciprocal tariffs and country-specific tariffs in recent negotiations.
3. The conflict between Israel and the Houthis
📈Technical aspects:
From a technical point of view, the 4H gold bulls are once again making an impact. At the top, we focus on the short-term suppression of the 3380-3390 line, focusing on the suppression of the 3400 line. Below, we focus on the short-term support of the 3350 line, and the important first-line support of 3335-3340. In terms of operation, we mainly go long by stepping back on 3350-3360, and the target is temporarily looking at 3380-3390. In the middle position, we should watch more and move less, pursue orders cautiously, and wait patiently for key points to enter the market.
If you agree with this point of view, or you have a better idea, please leave a message in the comment area. I look forward to hearing different voices.
OANDA:XAUUSD FX:XAUUSD FXOPEN:XAUUSD FOREXCOM:XAUUSD TVC:GOLD
GOLD ROADMAP Impultse to Trade Within this Big CorrectionI think Down force its not done just yet, then, looks like its in Wave C a clear Impulse whithin the Correction so..
Selling level @ 3.400 Target 3.310
Buyin Level @ 3.310 Target 3.450 / 3.465
Selling Level 2 @ 3.450 / 3465 Target 3.165
GG!

Gold breaks through 3350. Can the bullish pattern continue?In the early Asian session, gold rose rapidly and broke through the 3350 resistance level predicted by Quaid.
Fundamental analysis:
US political developments also add uncertainty to the market. The Trump administration's decision to impose a 100% tariff on imported films shocked the market, and this unpredictable trade policy weakened market confidence. Although the dollar was supported by strong employment data, it still struggled to gain substantial upward momentum, which further supported gold prices.
Economic uncertainty also boosted gold prices. The market generally expects the Federal Reserve to start a rate cut cycle in the near future, which weakens the attractiveness of interest-bearing assets and increases the relative value of non-yielding gold. However, many traders remain cautious and avoid building large positions, waiting for clearer policy signals.
Technical analysis interpretation:
From the monthly chart analysis, gold breaking through the neckline becomes a key trigger point. The pattern measures the depth from the neckline to the bottom of the head and projects it upward, giving a target price range of $3200-3300, which has now been achieved.
In addition, the pattern is not only technically strong, but also psychologically significant. A breakout after a long period of consolidation often attracts new long-term market participants and speculators.
Market Observation:
Current market sentiment is cautiously optimistic. On the one hand, macro uncertainty and risk aversion demand drive funds to the gold market; on the other hand, concerns about the timing and magnitude of the Fed's policy adjustments restrict the willingness of some bulls to take risks.
Quaid Analysis:
Bull Outlook
After the gold price breaks through the 3350 resistance level I predicted, the next target range may point to 3380-3400.
Short Outlook
In the short term, gold may face technical pullback pressure. The main support levels are at 3330 and 3300. If it falls below 3300, it may trigger a deeper pullback to around 3240.
Quaid believes that the market's expectations for the Fed's shift may be too optimistic. If future data show that inflationary pressure remains stubborn or economic resilience exceeds expectations, it may lead to a delay in expectations for rate cuts, thereby putting pressure on gold prices.

(XAU/USD) Bullish Trade Setup – Targeting $3,506.52 with Entry aEntry Point: $3,221.19
Stop Loss: $3,169.80
Resistance Zone: Around $3,277.98 to $3,280.64
Target (TP) Point: $3,506.52 (Approx. 9.05% upside)
📊 Technical Indicators and Markings:
Moving Averages:
Likely a 50-period (blue) and 200-period (red) moving average.
Price is currently below both MAs, signaling a short-term downtrend.
Support & Resistance Zones:
Strong support around $3,207.67–$3,221.19 (entry area).
Resistance at $3,244.25–$3,280.64.
Stop-loss is strategically placed below support to limit downside risk.
Target Area:
Projected upside target is $3,506.52, with a potential 9.05% gain from the entry.
This is marked as the EA (Expert Advisor) Target Point, possibly suggesting this is a strategy from an automated trading system.
Orange Circles:
Likely indicate swing highs and lows, used to identify trend patterns and potential reversal points.
📈 Trading Idea Summary:
Bullish Setup: Buying at support, aiming for breakout above resistance to reach target.
Risk-Reward Ratio: Favorable, assuming price holds above $3,207.
Watch for Confirmation: Price needs to break above resistance around $3,280 for momentum continuation.

It’s the right time to short📌Fundamentals:
This week, the Federal Reserve will hold a rate decision, which is expected to dominate the market this week. In addition, we need to continue to pay attention to news related to the international trade situation.
📊Technical aspects:
The 1-hour moving average begins to turn, so the unilateral decline of gold has temporarily come to an end. However, the rise of gold has reached the key resistance area in the early stage, which is the starting point of the early stage of 3330. It is obviously not appropriate to chase more at this position, so the short-term may begin to adjust, and gold will go short at 3325 first. The market is changing rapidly. If gold breaks upward without stepping back, there will be no opportunity to go long. Then there is no need to chase more gold. Go short first and look at the decline and adjustment. On the whole, the short-term operation strategy of gold today is to go short on rebounds and go long on pullbacks. The short-term focus on the upper resistance of 3328-3330, and the support on the lower side is 3280-3293.
🎯Practical strategy:
Short gold when it rebounds to around 3325-3328, target around 3300-3280.
Buy gold when it falls back to 3280-3295, target around 3325-30.

Although the bulls are strong, don't chase them at high levels📌Fundamentals:
The market is still focused on Trump's tariffs, followed by geopolitical situations, such as the India-Pakistan conflict, the Israeli-Palestinian ceasefire, and the Russia-Ukraine negotiations.
📊Technical aspects:
From the 4-hour analysis, the upper pressure is around 3336-3345, and the lower support is around 3280-3293. Continue to rely on this range to maintain the main tone of high-altitude low-multiple cycles. In the middle position, watch more and move less, be cautious in chasing orders, and wait patiently for key points to enter the market.
🎯Practical strategy:
1. Short gold rebounds at 3336-45, with a target of 3280-3295.
2. Go long gold at 3280-3295, with a target of 3325-30.

XAU/USD "The Gold" Metals Market Heist Plan (Swing/Day Trade)🌟Hi! Hola! Ola! Bonjour! Hallo! Marhaba!🌟
Dear Money Makers & Robbers, 🤑 💰💸✈️
Based on 🔥Thief Trading style technical and fundamental analysis🔥, here is our master plan to heist the XAU/USD "The Gold" Metals Market. Please adhere to the strategy I've outlined in the chart, which emphasizes long entry. Our aim is to escape near the high-risk ATR Zone. Risky level, overbought market, consolidation, trend reversal, trap at the level where traders and bearish robbers are stronger. 🏆💸"Take profit and treat yourself, traders. You deserve it!💪🏆🎉
Entry 📈 : "The heist is on! Wait for the NEUTRAL LEVEL breakout (3400) then make your move - Bullish profits await!"
however I advise to Place Buy stop orders above the Moving average (or) Place buy limit orders within a 15 or 30 minute timeframe most recent or swing, low or high level for Pullback entries.
📌I strongly advise you to set an "alert (Alarm)" on your chart so you can see when the breakout entry occurs.
Stop Loss 🛑: "🔊 Yo, listen up! 🗣️ If you're lookin' to get in on a buy stop order, don't even think about settin' that stop loss till after the breakout 🚀. You feel me? Now, if you're smart, you'll place that stop loss where I told you to 📍, but if you're a rebel, you can put it wherever you like 🤪 - just don't say I didn't warn you ⚠️. You're playin' with fire 🔥, and it's your risk, not mine 👊."
📍 Thief SL placed at the recent/swing low level Using the 4H timeframe (3200) Day trade basis.
📍 SL is based on your risk of the trade, lot size and how many multiple orders you have to take.
🏴☠️Target 🎯: 3680 (or) Escape Before the Target
🧲Scalpers, take note 👀 : only scalp on the Long side. If you have a lot of money, you can go straight away; if not, you can join swing traders and carry out the robbery plan. Use trailing SL to safeguard your money 💰.
💰💵💴💸XAU/USD "The Gold" Metals Market Heist Plan (Day / Swing Trade) is currently experiencing a Neutral trend (there is a chance to move bullishness🐂).., driven by several key factors.👆👆👆
📰🗞️Get & Read the Fundamental, Macro economics, COT Report, Geopolitical and News Analysis, Sentimental Outlook, Intermarket Analysis, Index-Specific Analysis, Positioning and future trend targets with Overall Score...... go ahead to check👉👉👉🔗🔗🌎🌏🗺
⚠️Trading Alert : News Releases and Position Management 📰 🗞️ 🚫🚏
As a reminder, news releases can have a significant impact on market prices and volatility. To minimize potential losses and protect your running positions,
we recommend the following:
Avoid taking new trades during news releases
Use trailing stop-loss orders to protect your running positions and lock in profits
💖Supporting our robbery plan 💥Hit the Boost Button💥 will enable us to effortlessly make and steal money 💰💵. Boost the strength of our robbery team. Every day in this market make money with ease by using the Thief Trading Style.🏆💪🤝❤️🎉🚀
I'll see you soon with another heist plan, so stay tuned 🤑🐱👤🤗🤩

Israel-Houthi conflict could put gold back on the bull run🗞News side:
1. The Israeli president said that they are on the eve of a "large-scale attack on the Gaza Strip"
2. The Houthi armed forces stated that all Israeli airports are their targets
3. The situation of the Russian-Ukrainian war and the follow-up events of the India-Pakistan conflict
📈Technical aspects:
From a technical point of view, the current 1H moving average of gold is spreading upward, resulting in a small retracement. The short orders we hold are also closed in time at 3310 to lock in profits. After gold broke through the previous range, the upward channel opened. The 4H MACD diverged from the bottom, the golden cross and the green column enlarged, opening upward, and the overall 4H trend was bullish. Moreover, the support effect of the middle rail of the Bollinger Bands is obvious, and the gold price is accumulating strength below the upper rail of the Bollinger Bands, with strong upward momentum. Pay attention to 3310. After the support stabilizes, you can consider participating in long positions near 3310-3320, focusing on the 3290 line below; focus on 3375 above, and then consider participating in short sales near 3355-3365 after the pressure is under.
If you agree with this point of view, or you have a better idea, please leave a message in the comment area. I look forward to hearing different voices.
TVC:GOLD FOREXCOM:XAUUSD FXOPEN:XAUUSD FX:XAUUSD OANDA:XAUUSD
