Gold-----Buy near 3190, target 3200-3260Gold market analysis:
Gold has been rising strongly in the past two days. The daily line closed with a big positive line again. The bulls stood above 3200. The current highest is around 3219. The form and indicators are basically useless in such a market. What we need is a firm bullishness. In the past two days, there is a characteristic that it has risen and never looked back. It is basically a 40-point rise. In such a market, we either wait or buy directly without thinking. Today's Asian session gold hovered above 3200, and it can also be bought directly above 3200. Gold has created the largest increase and highest position in history. This wave of gold fluctuations is no longer a simple fundamental, but caused by the current international situation. The big rise is not the top. We continue to follow gold to buy. If there is no big accident today, the weekly gold line will close with a super big positive line again.
The daily support has reached around 3167. This position is the previous top and the current support. Today's gold continues to buy based on this position. Given the current strength, it is basically impossible not to fall back. Pay attention to the opportunity of a small fall back and buy directly. Today, I estimate that the Asian and European sessions will rise, and the US tail market will fall back.
Support 3200, 3180, suppression is really invisible, and the watershed of strength and weakness in the market is 3190.
Fundamental analysis:
The CPI announced yesterday did not have a big impact on the market, but the data difference was still relatively large, the result was -0.1%, and the bulls only rose slightly. The bottoming out and rebound of the US stock market was mainly due to Trump's withdrawal of some tariff policies.
Operational suggestions
Gold-----Buy near 3190, target 3200-3260
Goldlong

GOLD (XAU/USD) Hits ATH – Discover the Market EdgeHi Guys,
I’ve been testing my edge for the past 5 months, and it’s been crazy what I’ve discovered so far. It might sound a little wild, but there’s a way to compare another market that leads 3–5 days ahead and gives clear trend signals for Gold Futures — which moves in tandem with XAU/USD, with only a few dollars' difference.
You can see a pullback here, but sometimes it shoots straight to an all-time high. Taking current geopolitics into consideration, the markets are extremely volatile. Before Trump started the trade wars, I opened an account with 1:500 leverage (starting capital $150, grew to $500) and made significant profits just by catching the moves and trends I was able to predict.
From a math standpoint, if it were just coincidence, I would’ve been liquidated a long time ago. I’ve been through everything — this isn’t luck. I remember one day, I was watching Bloomberg live and the news anchor said, “I can’t believe gold is dropping,” — but I had predicted that move days earlier, haha! That was triple confirmation that I have an edge and that algorithms are actually following it.
There were also days when I expected a small pullback the next day, but it happened during the NY session because of some news — and it couldn’t push lower. Sellers in the TradingView chat was going crazy. The next day, during the London session, it started reaching the ATH (as I predicted). The pressure was intense, but the algorithm didn’t allow it to go lower than the previous low — and that structure came from my leading market edge!
In this case, the pullback might not happen — and if it doesn’t, we’ll break the current ATH and easily go long after that. As I mentioned, in these volatile markets, with tariffs going back and forth, the buying pressure and constant news are so intense that the market sometimes doesn’t even have time to make a pullback! If you have good capital and trade with low leverage, you can easily go long now and keep adding to your position with every pullback until we hit the new ATH!
Now, gold is going to reach a new ATH again — that’s 110%. I believe we’ll easily hit $3200+, followed by a pullback to around $3100.
Next gold move:
ATH: $3200 – $3350
Pullback: ~$3100
Re-test of ATH area — consolidation in that zone until the next major news event.

Insight into the gold market situation and seize the opportunityHello everyone! After in-depth research and analysis of the recent market conditions, I believe that the current market has entered the stage of accelerating to the top.
From a technical point of view, such as the MACD top divergence sign, the KDJ indicator oversold, etc., all signs show that the market's upward momentum is gradually weakening, while the price is rising rapidly, which is often a typical feature of the peak stage.
The focus needs to be on the 3225-3235 area. This range has important resistance significance and has dense locked-in disks. On the other hand, through technical analysis tools such as the Fibonacci sequence, this range is also an important pressure range.
For investors with short trading rights, this is a rare opportunity to go high and short. When the price reaches the 3225-3235 area, it is a relatively ideal time to enter the short market. The one-hour moving average golden cross is formed, but after the upper rail of the Bollinger band is broken, the technical overbought risk increases, and the support near 3150 is effective. 80 points are also possible, so don't look at the current trend with a conventional perspective.

Gold trading zones: 11-APRIL-2025Daily Gold trading zones: Identifying potential opportunities for informed traders.

GOLD MONTHLY CHART LONG TERM ROUTE MAP ANALYSISMonthly Time Frame Analysis for GOLD
Dear Traders,
Attached is the Monthly Chart Route Map for GOLD. Since October 2023, we have consistently analyzed and traded GOLD with 100% target accuracy. The Golden Circle areas marked on the chart highlight our precise analysis and successful target achievements.
Key Highlights:
* After successfully hitting TP1 and TP2, the candle has closed above TP2.
* EMA5 has crossed and locked above the TP2 level at 2603, confirming upward momentum.
* The EMA5 detachment process has been completed successfully.
* As previously noted, the Fair Value Gap (FVG) provided robust support at 2535, facilitating the upward push.
What’s Next for GOLD?
Based on these confirmations, we anticipate hitting TP3 this month. However, we have identified two significant GOLDTURN levels at 2702 and 2603.
In the short term, we may see some bearish movements, but the monthly chart reveals the bigger picture: a sustained long-term bullish trend. This kind of temporary reversal strengthens the bullish trend and offers an excellent opportunity to buy at dips near support levels, reducing risk.
Recommendations:
To understand the support structure in greater detail, refer to our smaller time frame analyses, which will help you identify optimal dip-buying opportunities while keeping the long-term gaps in mind.
As always, we’ll keep you updated with daily insights. Don’t forget to check our analyses on weekly, daily, 12H, 4H, and 1H time frames.
We appreciate your continued support! Please show your encouragement by liking, commenting, and sharing this post.
The Quantum Trading Mastery

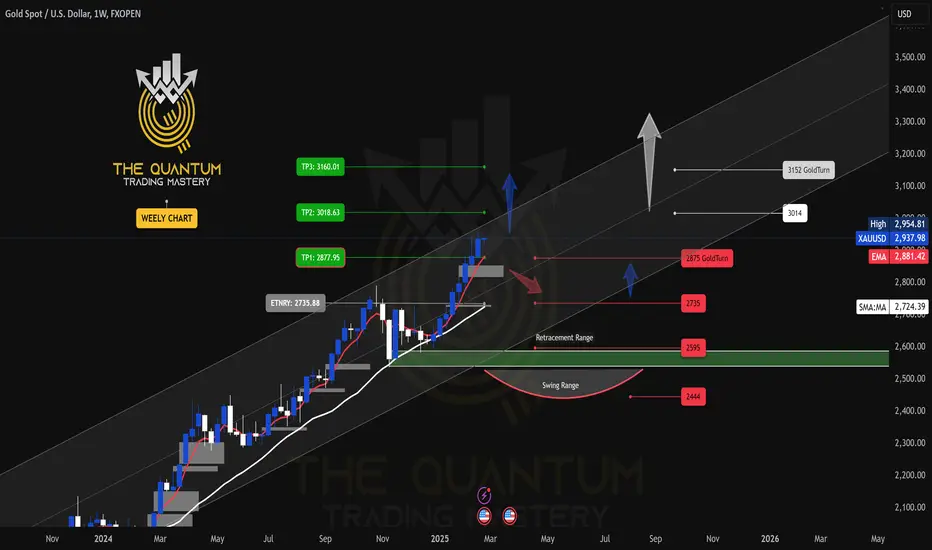
GOLD WEEKLY CHART MID/LONG TERM ROUTE MAP UDPATEDWeekly GOLD Analysis – Quantum Trading Mastery
Hello Everyone,
Here’s the latest update on the GOLD weekly chart we’ve been diligently tracking and trading. Below is a comprehensive breakdown of the current range and key levels we’ve identified.
Recap of Last Week’s Analysis:
Last week, our predictions aligned perfectly with market movements:
* A strong resistance level at 2790 caused a short-term reversal near 2735.
* The FVG acted as dynamic support at 2735, sustaining the bullish momentum.
* The EMA5 crossed and locked above the key level at 2735, solidifying upward movement.
* As predicted, the resistance was broken, leading to a new all-time high of 2817.
Our analysis delivered precise predictions, allowing you to trade confidently and minimize risks.
What’s Next for GOLD This Week?
Key Level: 2735
Bullish Targets:
* TP1: 2877
* TP2: 3018
* TP3: 3160
Bearish Targets:
* 2735
* 2680
* 2595
This week, we have identified two critical GOLDTURN levels at 2735 and 2595. While we anticipate GOLD reaching TP1 at 2877, there may be short-term reversals around these key levels and GOLDTURN zones.
Recommendations:
To better understand the support structure and identify optimal dip-buying opportunities, review our smaller time-frame analyses (daily, 12H, 4H, and 1H). These insights will help you navigate the market with precision, keeping long-term gaps in perspective.
We’ll continue to provide daily updates and insights to keep you informed.
Thank you for your continued support! Don’t forget to like, comment, and share this post to help others benefit as well.
The Quantum Trading Mastery

GOLD WEEKLY CHART MID/LONG RANGE ROUTE MAP UPDATEDWeekly GOLD Analysis: February 2024
Hello Traders,
Here’s a weekly chart analysis of the GOLD, offering a comprehensive view of recent market trends and future predictions. Our diligent tracking since October 2023 has consistently delivered 100% target accuracy, as evidenced by the marked Golden Circle areas on the charts. Let’s dive into the highlights and what lies ahead.
Recap of Recent Successes
Weekly Chart Highlights:
Last week, the market flawlessly followed our predictions:
* Key Level 2735 ✅ DONE
* Entry Level 2735.88 ✅ DONE
* EMA5: Crossed and locked above Entry ✅ 2735 DONE
* Bullish Target TP1: 2877 ✅ DONE
* The FVG zone around 2735 sustained bullish momentum, while resistance was broken, leading to a new all-time high of 2886.
What’s Next for GOLD? Bullish or Bearish?
We anticipate continued bullish momentum with updated GOLDTURN levels and refined targets.
Key Level: 2735 remains critical.
EMA5 Behavior:
* If EMA5 holds above 2735 and crosses/locks above TP1 (2877), the next target is TP2 (3018), followed by TP3 (3160).
* A failure to hold above 2735 could indicate bearish momentum, prices will be retesting support at 2595 in the demand zone.
Recommendations & Strategy:
* Focus on EMA5: Its behavior near 2735 and TP1 will provide clear direction for short- and long-term trades.
* Support Levels: GOLDTURN levels at 2735 and 2595 are critical for identifying reversal zones and optimal dip-buying opportunities.
* For precise entry and exit points, review our daily, 12H, 4H, and 1H analyses to navigate the market confidently.
* Slight pullbacks may occur, with potential reversals near GOLDTURN levels.
* Long-Term Outlook: The monthly chart suggests sustained bullish momentum, offering excellent opportunities for dip-buying near key support zones.
Stay Updated:
We’ll continue to share daily updates, insights, and strategies on our TradingView channel and YouTube channel every Sunday. Don’t forget to like, comment, and share to support our work and help others benefit!
The Quantum Trading Mastery

GOLD WEEKLY CHART MID/LONG RANGE ROUTE MAP UPDATEDWeekly GOLD Analysis: 17th February 2025
Hello Traders,
Here’s a weekly chart analysis of GOLD, offering an in-depth look at recent market trends and future outlook. Since October 2023, our consistent tracking has achieved 100% target accuracy, as shown by the Golden Circle markers on the charts. Let’s break down the highlights and what’s next.
Recap of Last Week’s Successes
Weekly Chart Highlights:
* EMA5 crossed and settled above Entry ✅ 2735 reached
* Bullish Target TP1: 2877 ✅ Achieved
* GoldTurn Levels at 2875 activated twice ✅ Reached
What’s Next for GOLD? Bullish or Bearish?
After hitting ENTRY LEVELS at 2735 and TP1 2877, we saw a small close above 2877 last week, leaving 3018 open as a potential target. We mentioned that an EMA5 lock would confirm this movement.
While EMA5 hasn’t locked yet, the close from last week provided a solid push upward, gaining over 500 pips. The long-term gap remains open, with more movement likely after last week’s candle body close.
Key Level: 2735 remains a critical zone.
GoldTurn Levels at 2875 and 2735 are active, and the price may revisit these levels before bouncing back to reach TP1 and beyond.
Recommendations & Strategy:
* Focus on EMA5: Watch its behavior around 2877 for key signals on short- and long-term trades.
* Support Levels: GoldTurn levels at 2875 and 2735 are vital for identifying reversal points and prime dip-buying opportunities.
* FVG Support: A range between 2835 and 2850 is also supportive.
For precise entry and exit points, check our daily, 12H, 4H, and 1H analyses for clearer market guidance.
We’ll continue to provide daily updates, insights, and strategies on our TradingView and YouTube channels every Sunday. Don’t forget to like, comment, and share to support our work and help others benefit!
The Quantum Trading Mastery

GOLD WEEKLY CHART MID/LONG RANGE ROUTE MAP UPDATEDWeekly GOLD Analysis: 24th February 2025
Hello Traders,
Here’s a weekly chart analysis of GOLD, offering an in-depth look at recent market trends and future outlook. Since October 2023, our consistent tracking has achieved 100% target accuracy, as shown by the Golden Circle markers on the charts. Let’s break down the highlights and what’s next.
Gold reached an all-time high of $2,954.80 last week. As previously noted, close attention to the movement of the 5-day Exponential Moving Average (EMA5) was advised. The anticipated Fair Value Gap (FVG) provided strong support at $2,850, with the EMA5 approaching the first take-profit (TP1) level at $2,877, leading to a bullish surge that touched the all-time high. However, the EMA5 has yet to cross and stabilize above $2,877.
This situation persists, with the EMA5 still not locked above $2,877, which is necessary for further bullish confirmation. If the EMA5 fails to cross and hold above this level, the price may reverse to test the GoldTurn level at $2,875 before potentially bouncing back upward.
The key level at $2,735 remains a critical zone. Active GoldTurn levels at $2,875 and $2,735 suggest that the price may revisit these areas before advancing to TP1 and beyond.
Recommendations & Strategy:
* Focus on EMA5: Watch its behavior around 2877 for key signals on short- and long-term trades.
* Support Levels: GoldTurn levels at 2875 and 2735 are vital for identifying reversal points and prime dip-buying opportunities.
* EMA5 detachment is still due on weekly chart.
For precise entry and exit points, check our daily, 12H, 4H, and 1H analyses for clearer market guidance.
We’ll continue to provide daily updates, insights, and strategies on our TradingView and YouTube channels every Sunday. Don’t forget to like, comment, and share to support our work and help others benefit!
The Quantum Trading Mastery
Accurately capture the gold pullback, shorting is the right timeDuring this period, spot gold has been like a rocket, advancing all the way and firmly in the upward channel. I have repeatedly reminded everyone before that once the US tariff stick is swung, the gold price will definitely rush up like a chicken blood. No, the facts prove that our prediction is quite reliable!
Tonight, the market ushered in another "big news" - the release of CPI data. As soon as this data came out, it directly gave the gold price a "heart shot", and the gold price was instantly pushed to around US$3160. This rise is too crazy! Interpret this data as soon as possible and pay close attention to the reaction of the gold market.
However, when the gold price rose to the previous high of US$3158-3168, it was like hitting a wall and began to "struggle". From my technical analysis point of view, there is a relatively strong resistance level in this range. It's like a person climbing a mountain, climbing to a certain height, and encountering a steep cliff. If you want to continue to go up, you have to work hard. At present, the gold price is under pressure at this position, and there are some signs of a correction. This provides us investors with a small opportunity to consider trying a short position here and earn some spread profits. I also suggest that investors can properly seize this short-term opportunity.
For example, the current gold market is like a fierce football game. The long team is strong and has been attacking all the way, and is in a dominant position. The short team can only seize the opportunity occasionally and make a quick counterattack. We investors are like coaches, and we must arrange tactics reasonably according to the situation on the field. When the long side is dominant, we can use short selling to increase our profits in a timely manner. I hope everyone can accurately grasp the market rhythm like an excellent coach.

Gold: Sell@3188-3200Gold has continued its strong rally, hitting a new all-time high, with bullish sentiment running extremely hot.
However, we must approach this rationally — every new high is usually followed by a technical pullback.
Currently, the 3200 level is a significant psychological resistance, as well as a key threshold for short-term bullish momentum.
From a technical perspective, the sharp recent rally has shown signs of momentum exhaustion, with clear overbought signals emerging.
📌 Strategy Suggestion:
Consider building short positions around the 3188–3200 zone
If 3137 is broken, further downside could extend to 3112–3090
⚠️ Risk Management Notes:
The larger the rally, the stronger the pullback potential
Avoid chasing long positions at these levels to prevent getting trapped at the top
Keep position sizes under control and set stop-losses to guard against sudden volatility
Wishing everyone smooth trades and solid profits!

Gold Technical Outlook: Bounce Likely Before Deeper Drophello guys.
The recent price action on gold suggests a potential short-term upward move, followed by a possible continuation to lower levels based on key technical factors:
🔹 1. Channel Support Touched – Expecting a Bounce
Price has touched the bottom boundary of the ascending channel, which has acted as dynamic support throughout this trend.
This technical level often brings in buyers, suggesting we may see a relief rally or bounce from this area.
🔹 2. Targeting Upper Blue Zones
If this upward correction materializes, price could reach:
The first blue resistance area around 3,090 – 3,100.
Possibly the second zone near 3,120, which aligns with previous structure and minor volume resistance.
These zones offer ideal points for watching price reaction—either rejection for shorts or breakout confirmation.
🔹 3. Potential for Further Downside
If the price gets rejected from one of those resistance areas, we could see a move down to:
The low-volume zone below 3,000, specifically the support at 2,965.
The lack of volume profile in this area (as shown on the left) suggests that once price enters this zone, it can drop quickly due to thin liquidity.
📌 Conclusion
Short-term bullish: bounce from channel support targeting 3,090–3,120.
Mid-term bearish bias: If rejection occurs in resistance zones, anticipate a drop to 2,965 or even lower.
Watch for confirmations on lower timeframes to refine entry and exit points.

Clean Breakout – Buy Setup in Action:
🚀 Trade Setup Alert – BUY Signal Activated 🚀
I've analyzed the chart and identified a strong Buy Signal based on technical indicators and support levels. Here's the detailed breakdown of the trade:
📌 Entry Point: 3118 (Confirmed breakout entry)
📉 Support Levels:
Support 1: 3070 (Major support zone)
Support 2: 3100 (Intermediate support)
🎯 Target 1: 3160
🎯 Target 2: 3180
📊 Technical structure looks solid, with price respecting key support levels and showing bullish momentum. As long as 3070 holds, this setup has high potential for upside movement.
Stay disciplined, manage risk, and let the levels play out. 💪📈

Gold/XAUUSD Intraday Move 10.04.2025📊 Market Context
After a sharp selloff from the $3,160 region to sub-$2,980 levels, the market is now in recovery/consolidation mode.
Market currently hovers around $3120 after bouncing from below $2,980, indicating buyer interest.
📏 Fibonacci + Support Confluence Zones
✅ Buy Zone 1 – $3095–3100
Reason: Retest of strong horizontal support.
Signal to Enter Long: Bullish engulfing / hammer on M5/M15 + RSI divergence.
Target: $3,110 (first), $3,120+ (extended).
✅ Buy Zone 2 – 3070-3075
Reason: Previous bottom, possible double bottom scenario forming.
Signal to Enter Long: Strong rejection wick / double bottom + volume surge.
Target: $3085 first, then trail till $3,100.
🔁 Retest Logic
Wait for price to retest any of these zones on low volume → watch for bullish candle close.
Ideal scalping trade: Enter on confirmation, small SL, tight TP.
⚠️ Important Notes
Avoid entering mid-range trades without pullback confirmation.
Aggressive buys can be scalped on momentum only if volume supports.
Always monitor for news or sudden volume spikes which can invalidate pullback zones.
Please follow, like, comment and share to get more analysis daily.

Will gold fall after a strong rise Goldmarket analysis referenceAnalysis of gold market trend: Today's gold is still fluctuating greatly under the influence of tariffs. Today, we have analyzed that gold has the risk of callback, and long positions are also falling back to lows! Trend realization analysis and ideas! From the surge on Wednesday, it can be seen that the risk aversion sentiment of gold has heated up again. The current highest is 3132, which is the first target point for the rise. If it continues to rise, it can see 3150 above, so there is still a lot of room above. Everyone should pay attention to trading with the trend as much as possible. In addition, there is another uncertain factor today. The US market will release CPI data, which will also bring abnormal fluctuations in gold. Therefore, the market will also fluctuate greatly today. Everyone should pay attention to controlling risks and managing positions well.
From a technical point of view, a positive line on the daily line directly changed the extremely weak adjustment state in the previous period. Now the positive line breaks the middle track of Bollinger and pulls up the moving average. Then, gold has entered an extremely strong state of bullish trend. In this state, it will continue to rise to the previous high of 3150. Therefore, the main direction today is definitely bullish. It is normal for the small cycle to adjust under the pressure of 3100. Now the Bollinger of the 4-hour cycle has just opened, and the unilateral trend has just taken the first wave of strength. There is no problem in the next wave to rise to the high point of the daily cycle. Therefore, as long as the 4-hour cycle falls back to the support of the unilateral moving average, it is an opportunity to do more. The support below is around 3070, and the rise of the hourly cycle is around 3060. Therefore, today's gold bullishness is expected to consider 3080 or 3070. The rise in the Asian and European sessions is still at 3130. If the US session breaks through 3136, consider seeing the high point of 3150. On the whole, today's short-term operation strategy for gold is to short on rebounds and to buy on pullbacks. The upper short-term focus is on the 3136-3155 resistance line, and the lower short-term focus is on the 3080-3078 support line. Friends must keep up with the rhythm. You must control your positions and stop losses, set stop losses strictly, and do not resist single operations. The specific points are mainly based on real-time intraday trading. Welcome to experience and exchange real-time market conditions.
Gold operation strategy reference: Short order strategy: Strategy 1: Short gold rebounds near 3133-3136, with a target of 3100-3090, and a break to look at the 3080 line.
Long order strategy: Strategy 2: Go long near the 3078-3080 pullback of gold, with a target of 3105-3125, and a break to look at the 3135 line.

GOLD LIVE TRADE AND EDUCATIONAL BREAKDOWN LONGGold clings to gains above $3,110, closes in on all-time high
Gold builds on Wednesday's impressive gains and trades above $3,110 on Thursday. The broad-based selling pressure surrounding the US Dollar and retreating US bond yields on growing fears of a deepening trade war between China and the US fuel XAU/USD's rally.

Gold: Buy setup brewing around 3045 – wait for confirmation!Hey traders! 👋
I’m eyeing a potential long opportunity on Gold in the 3030–3045 zone, but only with proper confirmation.
The shiny metal has broken and closed above Monday’s high with strong momentum, signaling short-term strength. However, considering the overall short-term bearish bias, I anticipate a pullback toward the 78.6% Fibonacci retracement level.
💡 Here's the plan:
🔸 Wait for price to dip into 3030–3045
🔸 Watch for bullish rejection candles or confirmation patterns
🔸 If confirmed, go long with targets at 3088 and 3123
🎯 This could be a great opportunity to catch the next leg up while still respecting short-term corrections.
If this setup adds value to your analysis, I’d truly appreciate your boost. Thanks for the continued support and happy trading! 💛📈

Gold trading zones: 10-APRIL-2025Good morning dear traders: Explore today's Gold trading zones and enhance your market knowledge.

30-minute candlestick chart on Gold (XAU/USD)Market Structure Labels:
CHoCH: Change of Character – indicates a shift in trend direction.
BOS: Break of Structure – confirms a continuation in trend direction.
Price Zones:
Supply Zone (Red Rectangle): Price area near the 3,114 level, where selling pressure may exist.
Demand Zones (Blue Rectangles): Areas around 3,052 and 2,950 levels where buying pressure may step in.
EQH (Equal Highs): Indicates potential liquidity resting above that high, possibly a target for price.
Weak Low: Marked below 2,950, suggesting it's vulnerable and may be swept.
Current Price Action:
Price is currently at 3,082, up 3.35% for the session.
A recent CHoCH to the upside, followed by a BOS, suggests bullish intent.
The price appears to be pulling back into a smaller demand zone (~3,064–3,052 area).
Forecasted Move (Blue Arrow):
The trader anticipates a short-term dip into the highlighted demand zone.
After tapping into demand, price is expected to bounce and move back up toward the supply zone, potentially testing or breaking the EQH around 3,114.
Trade Setup (Marked Zone):
Entry Zone: Around the demand area (~3,064–3,052).
Target Zone: Toward the top red zone (~3,114).
Risk Zone: Below 3,052.

Road to 3200Gold had a strong 4hr timeframe rejection from the 2960-2980 zone.
Also had a triple bottom in the same area.
Showing super strong signs of another bullish run.
Gold is making the strong move up to the 3140 area once 3100 is broke.
Should get a small rejection off the 3140 zone before a strong push up to a new all time high.
Next all time high goal is 3200 🚀
Short Notes:
•Run up to 3140 (Small rejection/load up zone)
•Then Load up zone 3110-3100
•Take Profit area 3200
As always, trade safe during these high volatility times and go crush it!💰

Gold(XAU/USD) at All-Time Highs – Breakout or Blow-Off Top?📊 XAU/USD Daily Technical Analysis – April 2025
Gold has surged to fresh all-time highs, with price currently trading above $2,320 after an explosive rally in recent weeks. The momentum has been relentless, but price action is now approaching a potential inflection zone, where either a continuation or a sharp correction could emerge.
📈 Trend Overview:
The trend on the daily chart is strongly bullish. Since the breakout above the previous all-time high near $2,075 in early March, gold has been in a near-vertical climb, forming successive higher highs with shallow pullbacks.
However, with price now significantly extended from recent bases, and psychological levels being tested, bulls may face their first real challenge in weeks.
🔹 Key Resistance Zones:
$2,325 – $2,345: Immediate resistance zone based on recent price clustering. A decisive break above this could fuel further upside toward…
$2,400: Psychological milestone and potential magnet for bullish momentum if the rally continues.
🔸 Key Support Zones:
$2,280: Minor support from the most recent consolidation zone — the first level to watch if gold pulls back.
$2,240: A more solid support based on previous breakout structure.
$2,180 – $2,200: Major structural demand zone — this is where buyers are most likely to step back in if a deeper correction occurs.
📐 Technical Structures to Watch:
Gold is forming what appears to be a rising wedge on the daily chart — a pattern that often emerges during strong trends but can signal momentum loss or potential reversal when the wedge narrows.
Additionally, recent price action shows signs of stalling candles (small-bodied candles with long wicks), suggesting hesitation or possible profit-taking at current levels.
While there’s no confirmation yet of a reversal, these are early warning signs traders should monitor closely.
🧭 Possible Scenarios:
✅ Bullish Continuation:
If gold breaks and holds above $2,345, the next logical upside target would be $2,400, followed by potential extensions toward $2,450 on high momentum or geopolitical catalysts.
❌ Bearish Pullback:
Failure to break higher — especially with reversal candles — could trigger a retracement toward $2,280 or deeper to $2,240. A breakdown below $2,200 would indicate a more serious correction and likely shift sentiment short-term.
📌 Conclusion:
Gold is in a powerful uptrend, trading at never-before-seen levels. But price is now testing a key zone where momentum could either continue explosively or stall into a correction. Watch for breakout confirmation above $2,345 — or signs of exhaustion below $2,280. Either way, a major move is coming.
💬 Is this the start of Gold 2.0? Or is a correction brewing? Let’s talk below 👇

Gold Analysis April 9D1 frame is a Doji candle with unclear buying and selling power. but the market is still in the structure of a corrective downtrend.
H4 shows a strong increase from 2970 to 3050 due to data from fundamental analysis
Trading scenario: Gold is approaching the fionacci retracement zone. Pay attention to the two SELL zones today 3063-3065 and the zone 3089-3091.
For gold to move towards the upper SELL zone, gold needs to surpass 3047. If it does not break 3047 and close below 3039, wait for a retest to SELL to 3021 in the US session. If it does not break 3021, then BUY again in this zone. If it confirms closing below 3021, hold at 2990 today.

XAU LONG LIVE TRADE AND EDUCATIONAL BREAKDOWN Gold extends rally to $3,050 area as safe-haven flows dominate markets
Gold preserves its bullish momentum and trades near $3,050 in the second half of the day. Further escalation in the trade conflict between the US and China force markets to remain risk-averse midweek, allowing the precious metal to capitalize on safe-haven flows.
