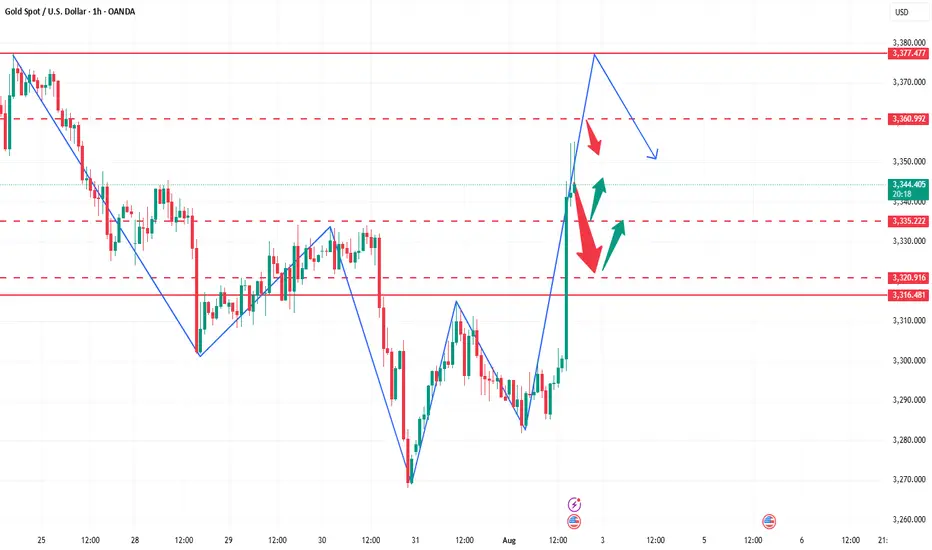
How to accurately grasp the gold trading opportunitiesGold was greatly affected by the positive non-farm payroll data, and it rose strongly, with the increase completely covering all the losses this week. The current gold trend has completely reversed the previous bull-short balance. After breaking through the 3300 level and rising to around 3355, it maintains strong upward momentum, and the possibility of further testing the 3360-3375 area cannot be ruled out. Due to the strong positive data, if everyone fails to chase the long position or set a breakout long position in time in the first wave of the market, the subsequent pullback opportunities may be relatively limited, so it is necessary to maintain an active strategy in operation. It is recommended to continue to be bullish when it retreats to the 3335-3320 area, and the upper target is the 3360-3375 pressure range.
Goldlongsetup
XAUUSDXAUUSD breakout falling channle and resistance zone.
Buy above 3295
Stop Loss: 3291
1st TP: 3308
2nd TP: 3313
3rd TP: 3322
4th TP: 3333

XAUUSD: BUYThere are some good trading opportunities in the market. That's when to buy. Gold prices haven't fallen further since falling back to 3390. There's no further negative news. Therefore, there won't be a significant short-term decline. Our focus will be on tomorrow's non-farm payroll data update. This is a crucial factor that can cause gold prices to rise or fall significantly in the short term.
I'll update you with real-time buy and sell opportunities. This is based on research from the Swing Trading Center. It's highly authoritative. Don't miss out! Remember to stay tuned.
XAUUSD: BUY 3292-3282 TP 3320. SL 3265

GOLD Weekly Idea💡Why Gold Pulled Back
- Gold pulled back today after hitting $3439.04, just below resistance at $3451.53. Traders took profits ahead of key Fed and trade headlines. Right now, it’s trading around $3414.48, down 0.50%.
- The dip came after the U.S.-Japan trade deal eased geopolitical tension, cutting safe-haven demand. Plus, U.S. bond yields are climbing (10-year at 4.384%), which adds pressure on gold.
Support is building at $3374.42, with stronger buying interest expected around $3347.97 and the 50-day moving average at $3336.40 — a key level bulls want to defend.
Short-term looks a bit weak, but as long as gold holds above the 50-day MA, the bullish trend remains intact. Longer-term, weakness in the dollar, central bank gold buying, and concerns about Fed independence could push prices higher.
🔍Watching the Fed’s July 29–30 meeting next
We go up!Gold trapped all the buyers, flash crash like said yesterday, now we buy till 3400. Rates ain't getting cut, they already have gold at the price they want.

Gold Drops After Failing to Hold Above $3322📊 Market Overview:
Gold initially surged above the $3322 resistance, hitting $3329 amid Fed pause expectations. However, a rebound in the US dollar and profit-taking triggered a sharp drop back to $3315, signaling weakening bullish momentum.
📉 Technical Analysis:
• Key resistance: $3322 – $3330
• Nearest support: $3308 – $3300
• EMA09 (H1): Price has fallen below EMA09 → turning short-term trend bearish
• Candlestick / Volume / Momentum:
• Failed breakout above $3322 with strong bearish H1 reversal
• Increasing volume during the drop → rising selling pressure
📌 Outlook:
Gold may continue declining in the short term if it fails to hold above $3312. Bears have taken control after the failed breakout attempt. Risk increases for a move toward $3300–$3295.
💡 Suggested Trade Setup:
🔻 SELL XAU/USD : $3318 – $3321
🎯 TP: 40/80/200 pips
❌ SL: $3325
🔺 BUY XAU/USD: $3295 – $3292 (only with clear bullish signal)
🎯 TP: 40/80/200 pips
❌ SL: $3288

XAUAUSD ideaWe are waiting for our asset to reach our action zone, and based on the reaction, we’ll decide on our next moves.ALWAYS WAIT FOR A CONFIRMATION TO SEE IF THE PRICE VALIDATES THE ZONE.and you what is your vision of the EURUSD its interests me! i wait you in the commentary
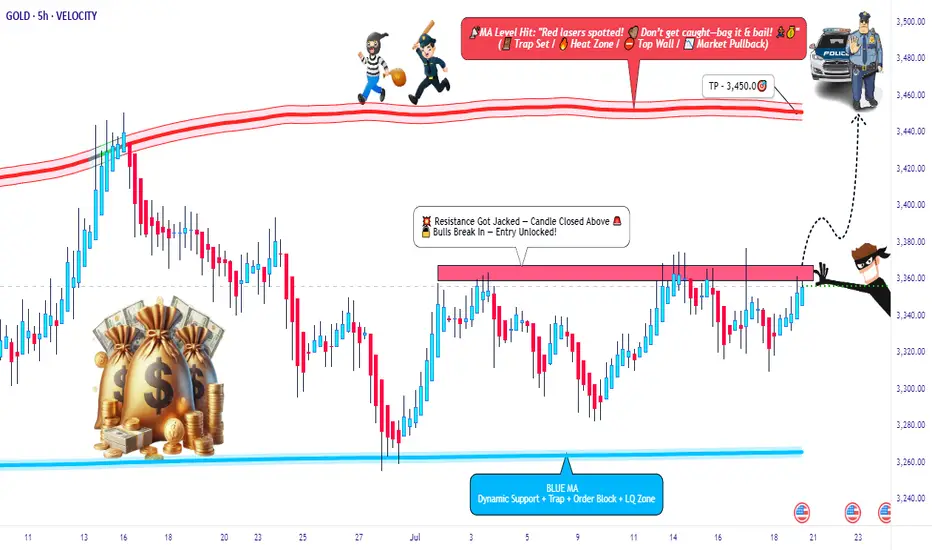
XAU/USD Breakout Playbook – Rob the Market!🚨💰 GOLD HEIST IN MOTION! | XAU/USD Thief Trading Strategy (Breakout Edition) 🏴☠️
🧠 Strategic Mindset | Not Your Average Chart Talk
Yo Market Bandits & Pip Hunters – welcome to the underground playbook!
This isn't your grandma’s chart breakdown – it’s a Thief Trading Takedown on XAU/USD (Gold), where we’re not chasing the market… we’re outsmarting it.
THE MASTER PLAN: Enter Like a Ghost, Exit Like a King 👑
📍 ENTRY POINT – The Break-In Begins!
💥 Breakout Level: Watch for 3370.00 resistance to crack – this is our green light.
🕵️♂️ Entry Style:
• Buy Stop above MA resistance zone (fast & clean)
• OR Buy Limit near swing low zones after confirmation pullback (sniper entry)
🧠 Thief Tip: Wait for the breakout to happen. No orders, no SL before it. Patience is profit.
🔄 Layer the Entry:
• Deploy DCA (Dollar Cost Averaging) or scaling entries with precision
• Build positions like stacking cash bags — smart, silent, and calculated
🛡️ PROTECT THE LOOT – Stop Loss Logic 💣
📍 SL Guide: 3310.00 (4H swing low – update as price structure evolves)
🔥 SL ONLY comes after breakout. Set it too early? That’s how you get caught.
⛔ No pre-breakout orders. No early SL. Stay invisible till it's go time.
🎯 THE ESCAPE – Profit Like a Phantom 🚀
💸 Take Profit: 3450.00
📉 Scalpers: Trail SL as price pushes – never give back stolen pips
🌀 Swing Traders: Monitor resistance layers – don’t let the bulls turn on you
🧭 CONTEXT – Why This Setup?
🔍 Macro Snapshot:
• Trend: Neutral/Bullish Lean
• Influencers: COT reports, geopolitical tension, dollar flows
• Sentiment Shifting – watch the herd, but don’t run with it
🗞️ News Risk: Don’t get wrecked by events! Avoid entries during high-impact news.
🚨 Trailing SL is your best weapon during volatility.
⚡ POWER UP THE CREW – Support the Movement
💬 Drop a comment, hit the 🔥 like button, and share with your trading gang
More Thief Trading blueprints coming soon – bigger breakouts, cleaner setups
⚠️ STAY SHARP, THIEVES!
This ain't financial advice – it’s an outlaw’s edge on the market.
Trade smart. Risk well. Protect the bag.
🏴☠️ XAU/USD GOLD HEIST IN PROGRESS... Join the Movement. Let’s Rob the Market.
Gold Weekly Forecast (28 July – 01 Aug 2025)📈 Gold Weekly Forecast (28 July – 01 Aug 2025)
By: RanaNadeemFX
🔍 Technical Overview:
Gold (XAUUSD) is currently trading around $3,337, showing rejection near the previous resistance zone of $3,430–$3,450. The market has recently pulled back after testing this resistance and is now approaching a confluence support area formed by:
Dynamic trendline support (ascending black line)
Horizontal support zone around $3,300–$3,320
50-day EMA providing additional support
This zone is critical and likely to act as a bullish demand area, provided no major fundamental risk-off event occurs.
📌 Key Levels to Watch:
Support Zones: $3,300 / $3,270
Resistance Zones: $3,430 / $3,450
📊 Trade Setup Highlighted on Chart:
A buy opportunity is marked from current price levels with a potential bounce back towards $3,430–$3,450.
Entry Zone: Around $3,330 to 37
Target: $3,450
Stop Loss: Below $3,300
This setup offers a favorable risk-reward ratio, assuming price respects the support and resumes the upward trend.
🧠 Bias: Bullish (as long as price stays above $3,300 support zone)
⚠️ Note: Keep an eye on upcoming US economic data releases and geopolitical developments which could add volatility to gold prices.
📌 Follow for more: @RanaNadeemFX
#GoldAnalysis #XAUUSD #WeeklyForecast #TechnicalAnalysis #TradingView #ForexTrader #PriceAction #GoldOutlook #SmartMoneyConcepts

Gold Trade SetupI will risk!!!
It seems we are near at the end of correction wave...
The first target R/R is 2 and the second is 4...

GOLD BUYI will be looking for buys as shown on the chart. If you agree, please show some love, and if you disagree, also show some love and let me know why you are not. Happy Trading, Happy Friday.
Gold Bounces Back After Testing Key Support📊 Market Drivers
• Gold dropped to around $3,352, touching a key support zone, then quickly rebounded to $3,373, gaining over +20 points.
• The rebound is supported by continued weakness in the US Dollar and slight easing in Treasury yields, keeping gold attractive as a safe haven.
• Although some optimism around US-Japan trade negotiations slightly reduced risk aversion, it wasn’t enough to push gold below support.
📉 Technical Analysis
• Key Resistance:
o $3,397 – $3,400: psychological resistance and near the next bullish breakout zone.
o If breached, next target lies around $3,420–3,445.
• Nearest Support:
o $3,356 – $3,364: recently confirmed support zone that triggered the current rebound.
o Deeper support at $3,326 – $3,320 if the rebound fails.
• EMA (EMA50):
o Price remains above the 50-period EMA, indicating bullish momentum in the short term.
• Patterns & Momentum:
o Market structure shows a "rising low" pattern — a bullish signal that buyers are stepping in at higher levels.
o RSI was briefly in oversold territory and now supports a recovery bounce.
o If $3,356 holds, the upside targets remain valid toward $3,397 → $3,439.
📌 Assessment
• Gold has confirmed strong support at $3,356–3,364, with the rebound from $3,352 as proof.
• Short-term uptrend remains intact, unless the USD strengthens sharply or unexpected macro news hits.
• If gold breaks below $3,356, it may retrace toward $3,326–3,320, but the upside potential is currently favored.
💡 Suggested Trade Setups
BUY XAU/USD: $3,356–3,364
🎯 Take Profit: 40/80/200 pips
❌ Stop Loss: $3,346
SELL XAU/USD: $3,397–3,400
🎯 Take Profit: 40/80/200 pips
❌ Stop Loss: $3,407

XAUUSD: Fluctuation of $30/ounce. Do you want to know?Yesterday, I frantically notified followers to buy around 3366-3375, and the market finally rose to 3430. This is a huge profit. I will continue to update it in the Band Trading Center Research Institute later. If you don’t want to miss it, follow me. If you see it but are still not sure how to trade. Then you can leave me a message at the Swing Trading Center Research Institute. I will reply to you one by one when I see it.
This week, some followers have achieved weekly profits of 50%-268%. If your profit is not ideal. Or don’t know how to trade. Remember to like and follow. I will lead everyone to victory.
Buy around 3400-3410. When will it close? I will post the results on the Swing Trading Center. Stay tuned.

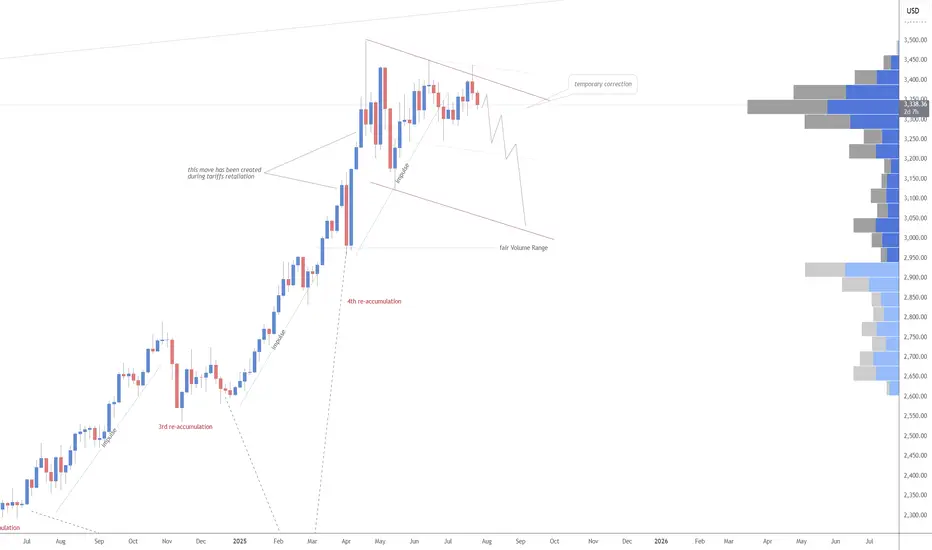
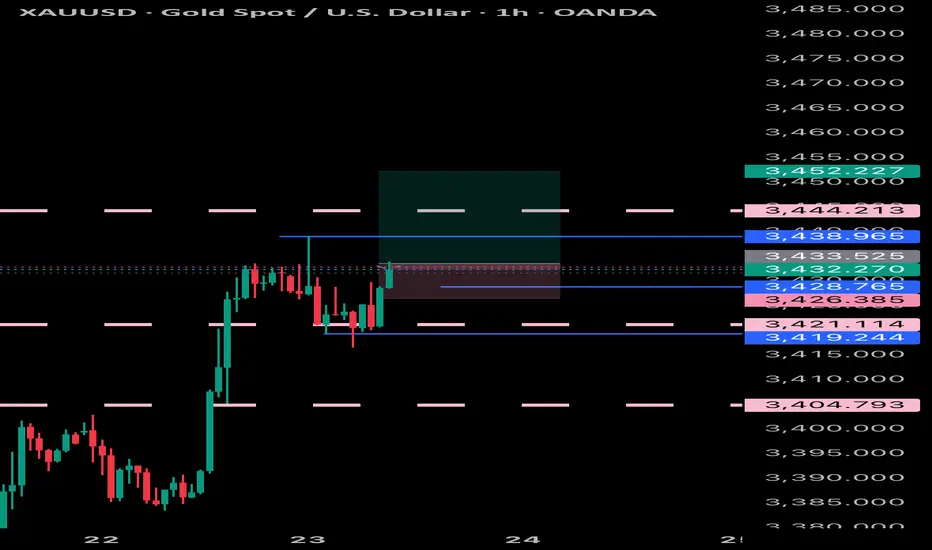
XAUUSD:3450-3500The probability of the same direction of the two histories is 95% similar. This shows one thing. The market may repeat history again.
So buy with me. The next target is 3450-3500

After reaching FULL TP. Relax and wait for strong support zone✏️Continuing yesterday's bullish wave structure, Gold has reached the Target level of 3400. In the European session, there is a possibility of a correction to some important support zones. And the US session will continue to aim for a level higher than 3400. Today's strategy is still quite similar to yesterday's strategy when waiting for the areas where buyers confirm to enter the market to FOMO according to the main trend.
📉 Key Levels
Support: 3375 - 3363
Resistance: 3400-3427
Buy Trigger: Rejects the support zone 3375 and reacts to the upside
Buy Trigger: Rebound from 3363
BUY DCA: Break and trading above 3400
Target 3427
Leave your comments on the idea. I am happy to read your views.
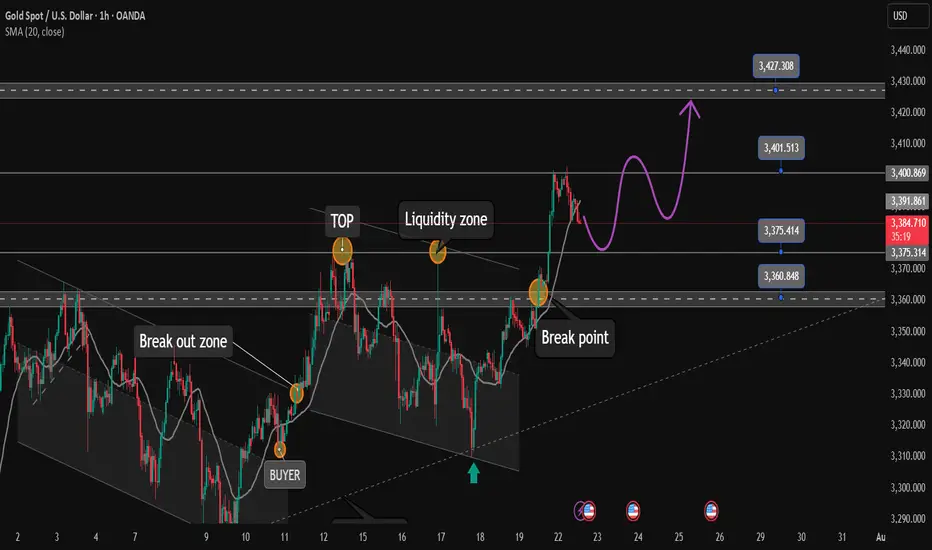
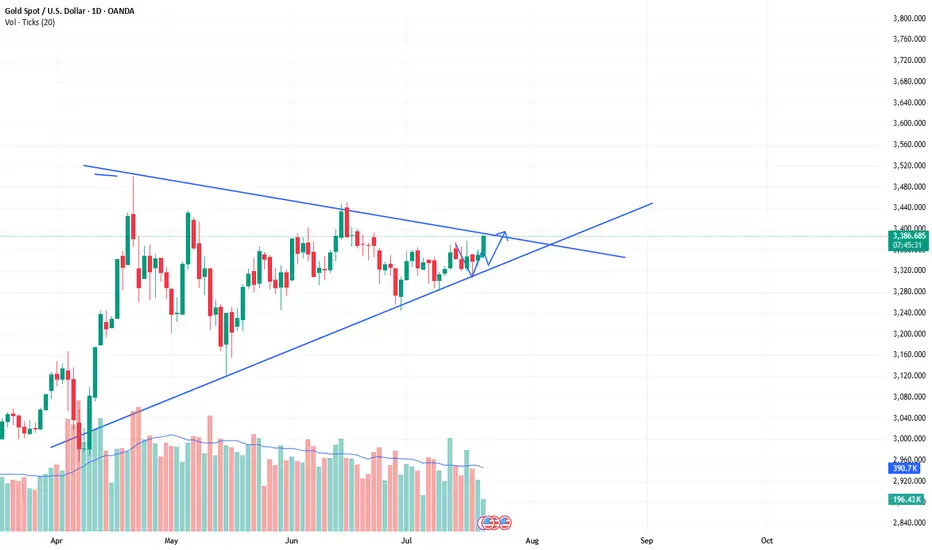
The bull market of xauusd continues, buy and wait for the rise.As predicted in the band trading center in advance over the weekend. The daily level trend is still very stable, and the breakthrough trend has been perfectly carried out. The current quotation is 3388. It is only a matter of time before it rises wildly to the position of 3430. The short-term will definitely break through. The current bull market is clear and has huge potential. The limit of the triangle consolidation phase is about to be broken. Then the bulls will continue to rise. Therefore, buying is the key operation plan.
XAUUSD:Retracement is a buying opportunityAfter the Asian market hit the highest position of 3403, there was some decline. The current gold price is 3386. From the short-term trend of the hourly level. It is still fluctuating at a high level. Combined with the trend of the daily level, there are signs of retracement and counterattack. There is no news dominance. It is purely a technical repair after hitting the high. This retracement can pay attention to the support near 3382-3378. The London and New York markets are still based on buying and profit.

GOLD - Lovers Elliott wave - looking strong Short/Medium termGOLD-----Daily counts indicate Excellent bullish wave structure.
Both appear to be optimistic and this stock invalidation number (S L) wave 2 low
target short / long term are already shared as per charts
correction wave leg seems completed (C)
Investing in declines is a smart move for short/ long-term players.
Buy in DIPS recommended
Long-term investors prepare for strong returns over the next two to five years.
one of best counter
Every graphic used to comprehend & LEARN & understand the theory of Elliot waves, Harmonic waves, Gann Theory, and Time theory
Every chart is for educational purposes.
We have no accountability for your profit or loss.

Ultra-short-term trading. Profit of $10/ounceThe order to buy XAUUSD successfully made a profit. The current gold price is 3367. Stimulated by the weekend news, the expected trend was achieved smoothly, and the short-term bulls were strong. Buying can continue to be the main focus. Relying on the half-hour and one-hour trends, trading can be carried out in the London market for the purpose of buying and profit. The increase is about $10/ounce.
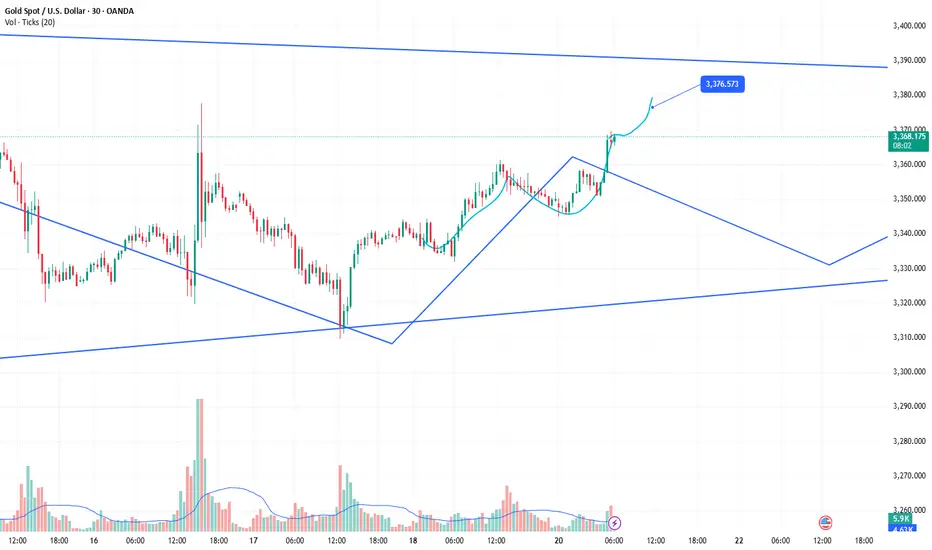
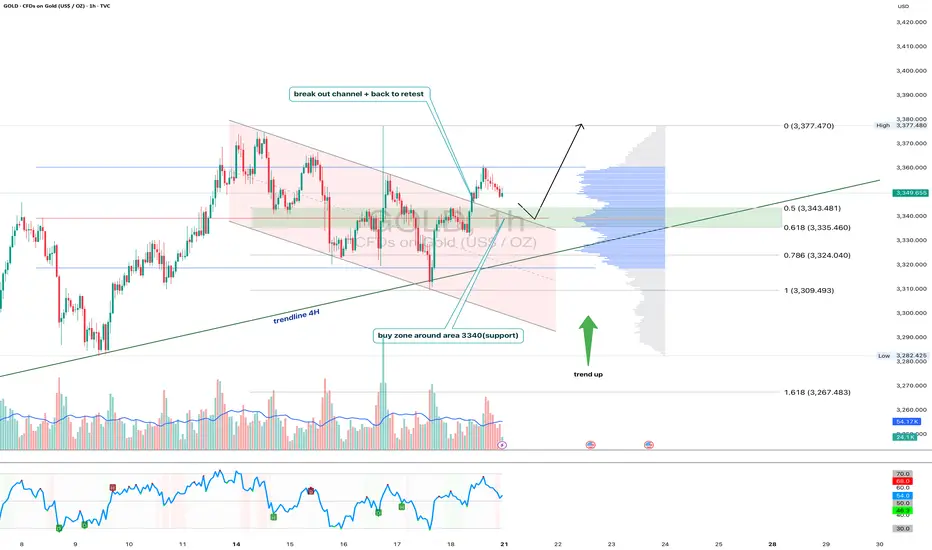
Gold 1H - Retest of channel & support zone at 3340After breaking out of the falling channel, gold is currently retesting its upper boundary — now acting as support. The 3340 zone is particularly important as it aligns with the 0.618 Fibonacci level and high volume node on the visible range volume profile. The price action suggests a potential bullish rejection from this area. With both the 50 and 200 EMA below price on the 1H, the short-term trend remains bullish. The 4H trendline further supports this setup. RSI is cooling off near the neutral zone, leaving room for another leg higher toward the 3377 resistance zone. If 3340 fails, 3324 (0.786 Fibo) becomes the next line of defense. Until then, the structure remains bullish following the successful breakout and retest of the channel.
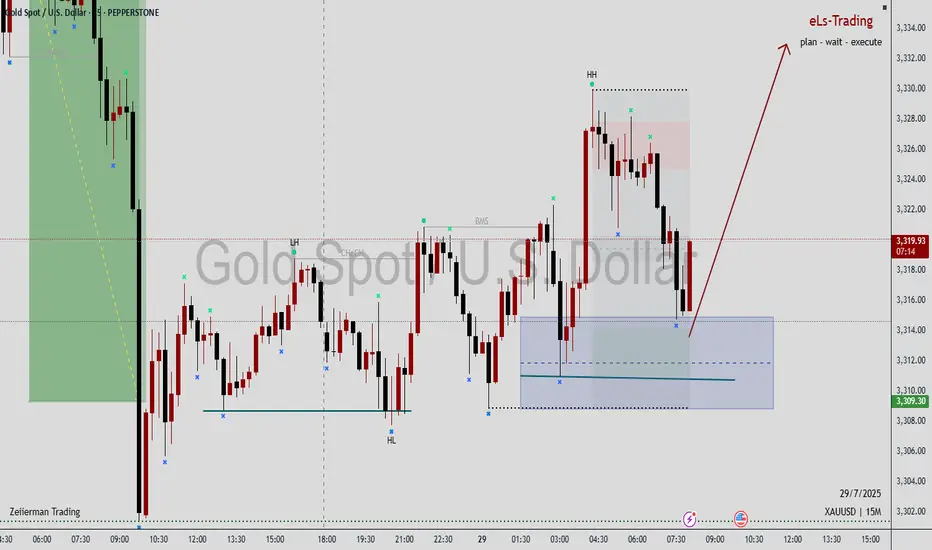
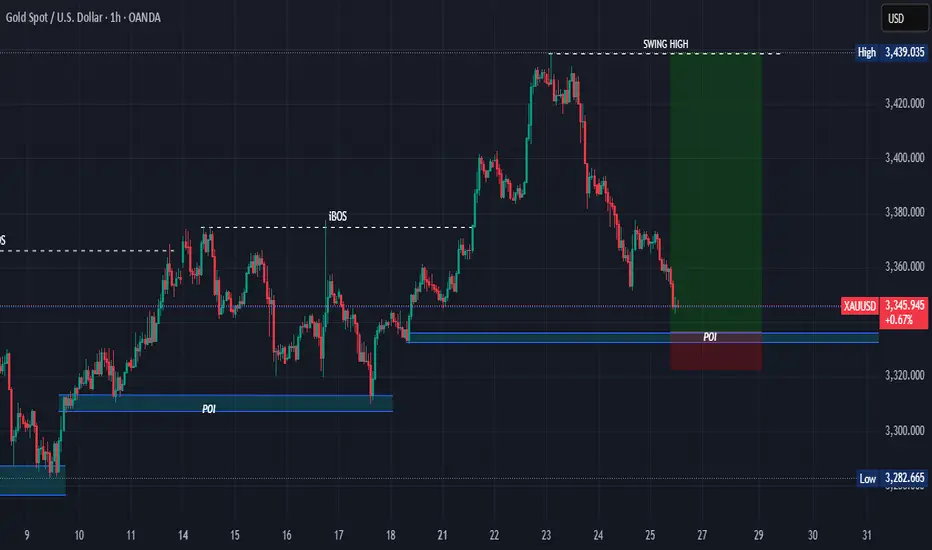
GOLD ( XAUUSD ): Watching For A Short Term Buy ConfirmationIn this Weekly Market Forecast, we will analyze the Gold (XAUUSD) for the week of July 21-25th
Gold has been in consolidation for a couple of weeks now. The price action hasn't allowed for very many FVGs... until last week. There is a +FVG I am keeping an eye on, as it will be very telling how price reacts to it upon contacting this POI.
If it holds, higher prices will ensue.
If it fails, to the lows of the consolidation we go.
We'll soon see how it plays out.
Enjoy!
May profits be upon you.
Leave any questions or comments in the comment section.
I appreciate any feedback from my viewers!
Like and/or subscribe if you want more accurate analysis.
Thank you so much!
Disclaimer:
I do not provide personal investment advice and I am not a qualified licensed investment advisor.
All information found here, including any ideas, opinions, views, predictions, forecasts, commentaries, suggestions, expressed or implied herein, are for informational, entertainment or educational purposes only and should not be construed as personal investment advice. While the information provided is believed to be accurate, it may include errors or inaccuracies.
I will not and cannot be held liable for any actions you take as a result of anything you read here.
Conduct your own due diligence, or consult a licensed financial advisor or broker before making any and all investment decisions. Any investments, trades, speculations, or decisions made on the basis of any information found on this channel, expressed or implied herein, are committed at your own risk, financial or otherwise.

GOLD! Pre-Market Analysis For Friday July 18th!In this video, we'll present pre-market analysis and best setups for Friday July 18th.
Enjoy!
May profits be upon you.
Leave any questions or comments in the comment section.
I appreciate any feedback from my viewers!
Like and/or subscribe if you want more accurate analysis.
Thank you so much!
Disclaimer:
I do not provide personal investment advice and I am not a qualified licensed investment advisor.
All information found here, including any ideas, opinions, views, predictions, forecasts, commentaries, suggestions, expressed or implied herein, are for informational, entertainment or educational purposes only and should not be construed as personal investment advice. While the information provided is believed to be accurate, it may include errors or inaccuracies.
I will not and cannot be held liable for any actions you take as a result of anything you read here.
Conduct your own due diligence, or consult a licensed financial advisor or broker before making any and all investment decisions. Any investments, trades, speculations, or decisions made on the basis of any information found on this channel, expressed or implied herein, are committed at your own risk, financial or otherwise.
