Gold Surges Late Session – Targeting $3,345+📊 Market Overview:
• Gold has just broken higher to $3,339, extending its bullish move after clearing the $3,335 resistance zone.
• Market sentiment remains supportive as the USD weakens and U.S. bond yields stabilize, while the Fed still shows no signs of cutting rates soon.
📉 Technical Analysis:
• Next resistance: $3,345 – $3,350
• Nearest support: $3,335 – $3,336
• EMA 09: Price remains above EMA 09 → confirms short-term uptrend
• Momentum: RSI stays bullish, and price continues to follow breakout momentum from the recent consolidation zone
📌 Outlook:
Gold is holding its bullish structure — if it stays above $3,335, a move toward $3,345–$3,350 is likely during the Asian session.
💡 Suggested Trading Strategy
🔺 BUY XAU/USD at: 3,336 – 3,338
🎯 TP: 3,350
❌ SL: 3,330
Goldlongsetup

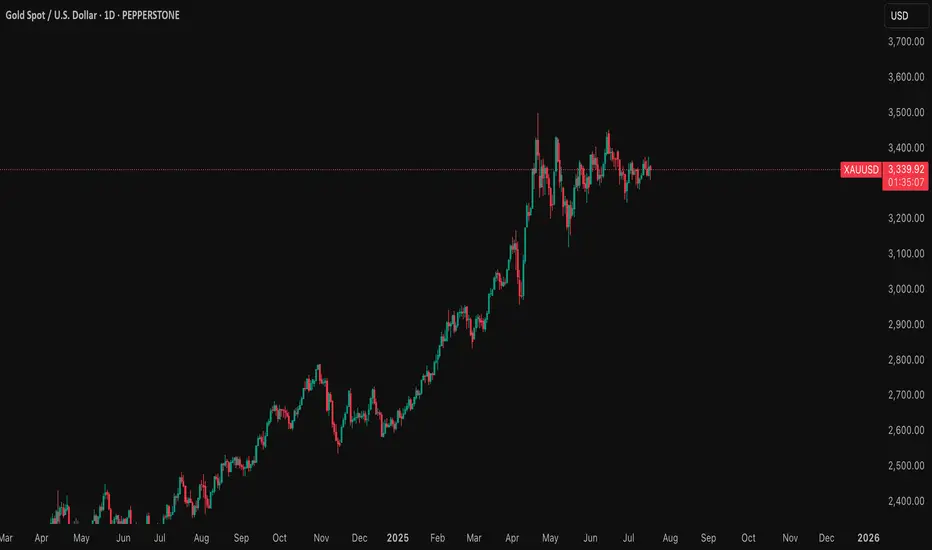
Gold Analysis – Why I’m Targeting $4,085Friday July 18 2025. Malaysia, Kuala Lumpur - Gold analysis done by Zezu Zaza to see the potential upcoming upside starting today this Friday.
I am using a CCT (Chrono Conditioned Trading) technique for my trading based analysis with mathematical strategy in the Xauusd pricing. We will cover the technical, fundamental and sentiment aspect as these are the three components pillars in trading before making any decision and movement trend.
1. Technical Setup (Daily Chart)
Gold is currently consolidating between the $3,300 to $3,375 range after a strong rally earlier this year.
The RSI sits near the neutral 50 level, while the MACD shows signs of a potential bullish crossover.
A confirmed breakout above the $3,375 to $3,400 resistance zone may lead to a surge toward $3,600 to $3,650, and possibly much higher.
Market structure remains bullish, with higher lows forming a solid base around $3,300.
2. Federal Reserve Outlook – 2025 Rate Cuts Expected
The market is now pricing in at least two interest rate cuts from the Federal Reserve by the end of 2025. A 25 basis point cut is expected in September, with another potentially coming in December. Recent CPI and PPI data indicate cooling inflation, giving the Fed more room to ease without reigniting price pressure. Labor market strength is weakening, wage growth is decelerating, and tighter credit conditions are emerging. Fed Chair Jerome Powell recently stated that the risks of over-tightening are now balanced, signaling a shift to a more dovish stance. Lower interest rates reduce bond yields and weaken the dollar, which historically fuels gold’s bullish momentum. If trump fired or Powell decision to step down, this will fire the gold even higher for the catalyze.
3. Market Sentiment (Speculative Positioning)
As of July 11, 2025, the latest CFTC Commitment of Traders report shows speculative net long positions on gold have surged to 203,000 contracts, the highest level in several months.
This signals a strong bullish sentiment among hedge funds and large traders.
In addition, gold ETFs saw over $38 billion in inflows in the first half of 2025, highlighting strong institutional demand as investors seek safety in uncertain times.
The positioning supports further upside as traders bet on a softer dollar and increased market volatility.
4. Macro Fundamentals and Hedge Fund Sentiment
Central banks around the world, especially in the BRICS nations, continue to increase their gold reserves in efforts to reduce reliance on the US dollar.
China has been actively accumulating gold for more than eight consecutive months, with unofficial estimates suggesting holdings of up to 5,000 metric tons.
Several hedge funds and institutional managers now classify gold as a core asset class due to rising fiscal uncertainty, geopolitical risk, and the deterioration of confidence in monetary policy. David Einhorn of Greenlight Capital emphasized that gold is not just about inflation but about the credibility of monetary and fiscal policies. His fund maintains a long gold position and expects higher prices as global deficits and structural imbalances persist.
5. Institutional Forecasts and Speculator Targets
Goldman Sachs has raised its end-of-2025 target to the $3,700 to $3,950 range, citing rising ETF inflows and a softer Fed stance. JPMorgan expects gold to average around $3,675 in the fourth quarter of 2025. Citi, in a bull case scenario, believes gold could trade well above $3,300. The World Gold Council has outlined a high-conviction scenario in which gold could reach $4,000 within the next six to nine months, driven by stagflation and global monetary instability. Greenlight Capital is reportedly aiming for the $3,500 to $3,800 range, though David Einhorn noted that he does not want prices to rise excessively too quickly.
Target Price: $4,085 first before turn the bullish sooners to $5000 price make this same year.
My target of $4,085 is supported by the convergence of multiple factors:
- A bullish technical structure with a potential breakout
- Fed interest rate cuts reducing yields and weakening the dollar. Fed will reduce the rates for the first time this year (12 more days) after this article is published today 18 July 2025.
- Strong speculative positioning and ETF demand
- Aggressive central bank accumulation
- Hedge fund sentiment aligned with rising gold exposure
- Persistent geopolitical and macroeconomic uncertainty
If these conditions hold, $4,085 is a realistic medium-term objective within six to nine months.
Trading Plan Summary
Component Strategy
Entry Zone Breakout above $3,375
Stop Loss $3,300 to $3,320 (below key support)
Take Profit Partial at $3,600 to $3,650, trail remainder to $4,085
Risk Triggers Dollar strength, unexpected Fed hawkish turn, resolution in geopolitics
Key Catalysts CPI done, PPI done, FOMC statements, nonfarm payrolls, war developments
Final Takeaway
This gold analysis blends a bullish technical pattern with the macroeconomic backdrop of an approaching Fed pivot, rising speculative positioning, and ongoing central bank purchases.
Hedge funds and institutions are increasingly viewing gold as an essential defensive asset, especially in the face of deteriorating fiscal credibility and geopolitical tensions.
If gold breaks and holds above the $3,375 level, the path toward $4,085 becomes significantly more probable.
18 July 2025 Friday is a starter ignition trend will born today. I will place some test lots today and will accumulate after from time to time.
Let me know if you what is your opinion or send email to me to reach me for the insitutional analyst or want to see live trade.
Regards,
Zezu Zaza
2048
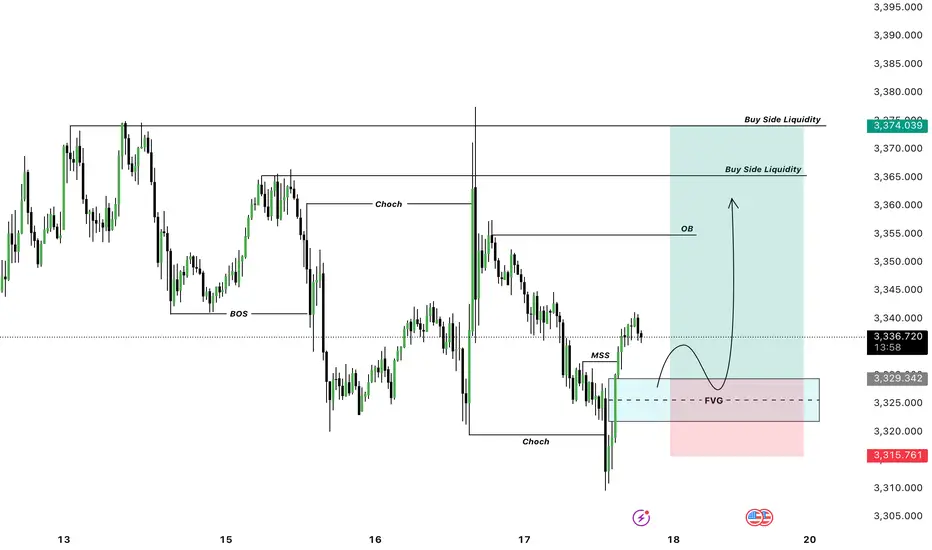
GOLD LONG SETUP Gold Bullish Long Setup
Startegy : FVG + MSS + BUY STRUCTURE
Where To Buy ?
3329 - 3320 Area FVG Buy
Targets : 3350 , 3355, 3360
Stop Loss Previous Low
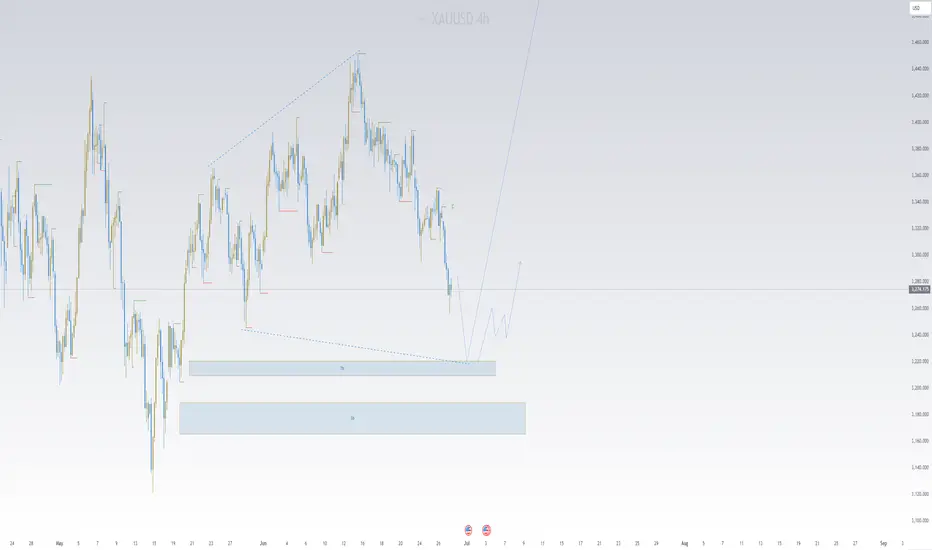
SWING TRADE OPPORTUNITY 〉LONGAs illustrated, I try to visualize what the next bullish impulse could look like if price holds 3300 as a key psychological and algorithmic price level.
Illustrated are the potential buy areas (a current one and an extended one in case a pullback occurs to manipulate lower levels in the next 24-48 hours).
This projection, if valid, could hold from now until next week, so it can be considered a swing trade to hold at least the next week and into the following one).
--
After this post, I will upload another analysis on the Daily timeframe projecting the longer term move, so make sure to go in my profile to check it out.
GOOD LUCK

GOLD Remains BullishPrice made a HH at 3365, confirming structure shift back to bullish. The last HL is at 3305, making it the protected level for bulls.
H4 OB: 3305–3322 (origin of the recent impulsive leg — ideal pullback zone)
Supply Zone: 3432–3445 (next unmitigated supply target)
Bullish if price pulls into demand zone and holds, expect continuation to 3432+
H1 OB: 3325– 3335 (potential re-entry zone)
Watch for reaction on pull back
M15 Micro bullish flow is intact; price is consolidating around 3360
Breakout Buy: M15 BOS above 3365 with retest = entry trigger
🟢Entry Zone: 3325– 3335
SL: Below 3305
TP1: 3365
TP2: 3432
TP3: 3445

XAU/EUR Bear Raid – High-Risk, High-Reward Short!🔥 XAU/EUR GOLD HEIST – BEARISH BREAKOUT ALERT! 🚨💰
🌟 Greetings, Market Pirates & Profit Raiders! 🌟
(Hola! Oi! Bonjour! Hallo! Marhaba!)
🤑 TRADE IDEA: XAU/EUR (Gold vs. Euro) – BEARISH SWING PLAY
Based on the 🔥Thief Trading Style🔥, we’re plotting a strategic heist on Gold! Our analysis signals a short entry with high-risk, high-reward potential. The market is oversold, consolidating, and primed for a reversal trap—bullish traders are about to get ambushed!
🎯 TRADE SETUP (SWING/DAY TRADE)
📉 ENTRY:
"The Heist Begins!" Wait for Neutral Zone breakout near 2800.00 (Bearish confirmation).
Pro Tip: Place sell-stop orders above neutral OR sell-limit near swing highs/lows (15-30 min timeframe).
📌 Set an ALERT! Don’t miss the breakout moment.
🛑 STOP LOSS:
"Stop right there, cowboy! 🤠"
If using a sell-stop, set SL only after breakout (don’t get faked out!).
Thief SL Zone: 2870.00 (4H swing high).
⚠️ Adjust based on your risk & lot size! (Your money, your rules—but trade smart!).
🎯 TARGET:
2720.00 (or escape early if momentum fades).
🚨 CRITICAL ALERTS:
📰 News = Volatility! Avoid new trades during major releases.
🔒 Lock profits with trailing stops—don’t let winners turn to losers!
📉 Market Context: Bearish trend fueled by .
💥 BOOST THIS HEIST! 👊
🔥 Like & Boost to fuel our next Thief Trading raid!
🚀 More profitable setups coming—stay tuned!
(Disclaimer: Trade at your own risk. This is not financial advice.)

The decline in gold prices has not stopped. Do you know what to
Gold did not provide a better position to go long during the day, but continued to fluctuate, and was under pressure at 3330 many times. The short-term suppression was obvious, and the increase was limited. It is expected to usher in a decline today. Consider short-term short operations, pay attention to shorts near 3326, stop loss at 3334, and take profit at 3300. Pay attention to risks.
Short-term trading of gold in the evening of July 10: shorts near 3326, stop loss at 3334, take profit at 3306

XAUUSD Idea: 4H Trendline First Breakout - Liquidity PlayFOREXCOM:XAUUSD
🔍 Analysis Overview:
Price has just broken above a 4H descending trendline for the first time. However, I remain cautious due to the following key observations:
📌 NOTES:
The broader market sentiment is still bearish due to recent tariff-related news, which often fuels risk-off behavior.
Historically, the first breakout of a strong trendline often fails, trapping early buyers.
This breakout is likely attracting buy-side liquidity, giving institutions an opportunity to hunt stops.
My observation shows buying interest started around the 3308–3313 range, suggesting smart money accumulation and a possible trap.
📉 I'm watching for a fake breakout and potential reversal targeting the liquidity zones marked below around 3307 and possibly lower.
The liquidity sweep below equal lows could offer a better risk-reward setup.
💡 Conclusion:
If price fails to hold above this breakout and shows signs of rejection, I will be anticipating a return towards the previous demand zone for a liquidity grab.
#XAUUSD #GoldAnalysis #SmartMoneyConcepts #LiquidityGrab #ForexTrading #TrendlineBreak #MarketPsychology #TradingSetup #SMC #PriceAction

Gold Rebounds from 3283, Eyes 3315 Resistance📊 Market Overview:
• Gold dropped sharply to a low of $3283 earlier today before rebounding strongly back to around $3312, supported by renewed buying interest.
• The recovery is fueled by risk-off sentiment amid ongoing trade negotiation uncertainty and a mild pullback in the U.S. Dollar Index.
• Central bank buying continues to underpin gold’s base, despite mild pressure from rising U.S. bond yields.
________________________________________
📉 Technical Analysis:
• Key Resistance: $3315 – $3335
• Nearest Support: $3280
• EMA 09: Price is trading above the 9-period EMA, signaling a short-term bullish trend.
• Candle pattern / Momentum: A strong bullish engulfing candle formed after bouncing from $3283 on the H1 chart. MACD is crossing upward, and RSI is approaching the 60 level, suggesting bullish momentum.
________________________________________
📌 Outlook:
Gold may continue to recover in the short term if it holds above the $3300 level and successfully breaks through $3315 resistance. However, failure to break above this resistance could lead to a short-term pullback toward $3290–$3280.
________________________________________
💡 Suggested Trading Strategy:
🔻 SELL XAU/USD at: $3315–3325
🎯 TP: $3295
❌ SL: $3330
🔺 BUY XAU/USD at: $3285–3295
🎯 TP: $3315
❌ SL: $3280

Buy Gold! The short-term bottom may have appeared!Gold continued to retreat yesterday and hit a recent low, reaching around 3287. Then gold gradually rebounded to above 3300. Relatively speaking, the rebound momentum was weak. It is expected that the long and short sides will fight fiercely around 3300. However, from the recent characteristics of gold operation, it can be seen that although the short position of gold is strong, it is difficult to continue in the short term, and I think the short-term decline of gold is basically in place, so at this stage, in terms of short-term trading, I do not advocate shorting gold directly;
As gold did not continue to fall after reaching around 3287, on the contrary, it gradually rebounded to above 3300, which may strengthen the market's consensus on the short-term bottom, thereby attracting the favor of off-site funds; from the current gold structure, if gold can maintain above 3300-3295, it may be combined with the 3287 low to build a "W" double bottom structure, which is conducive to supporting the rebound of gold.
However, as gold fell below 3300 again, the bearish trend is relatively strong, so we need to moderately lower our expectations for a gold rebound. In the short term, gold is under pressure in the 3315-3325 area, so we can temporarily look to this area for the rebound target. Therefore, in short-term trading, I do not advocate shorting gold directly, and you can first consider going long on gold in the 3300-3295 area, TP: 3310-3320-3330.

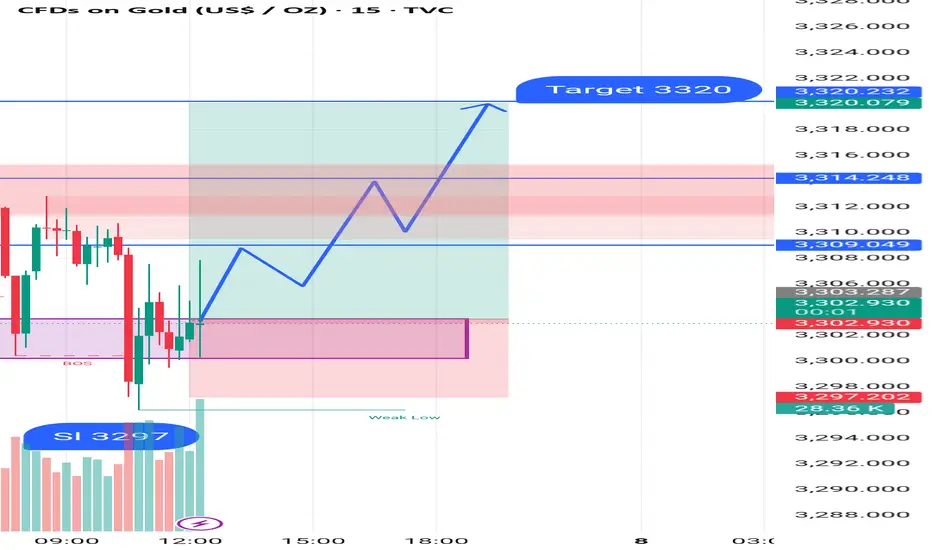
GOLD BUY M15 Gold (XAU/USD) Analysis – 15-Minute Chart
The price is currently showing signs of bullish momentum after forming a Break of Structure (BOS) around the 3297 level, which is also marked as the Stop Loss (SL) area.
After retesting the demand zone (highlighted in purple), the price has started to push upwards, suggesting a potential reversal. A bullish price path is projected, with expectations of higher highs.
Key Levels:
Entry Zone (Support): Around 3297 (SL zone)
Resistance Zones:
First Resistance: 3309
Second Resistance: 3314
Final Target: 3320
If the bullish momentum continues, the price is expected to break above the minor resistance levels and reach the target of 3320.
Continue to short gold, bears will exert force againAffected by the NFP market, gold fell precipitously, almost giving back 50% of the gains in the previous wave, and the short-selling performance was particularly strong; technically, gold successfully built a double-top structural resistance in the 3365-3363 area in the short term, which played a technical suppression role in the short term. As gold fell, the current short-term resistance moved down to the 3340-3350 area;
On the other hand, although gold began to rebound after falling to around 3312, it clearly showed the characteristics of weak rebound, and it did not even stand above 3340 once, and the long forces were insufficient; and technically, a single lower shadow line was not enough to support the continued rebound of gold, so gold still had the need to retrace the support below from a technical perspective; and once gold fell again, it was very likely to test the 3305-3295 area again.
So I think we can take advantage of the rebound of gold to short gold again. We can still short gold with the 3340-3350 area as resistance and look at the target area: 3315-3305-3295.
GOLD LOND TRADE IDEA We Are Looking Gold Bullish Today ,
TL BUY AREA : 3347 💡
1ST SUPPORT BUY : 3336, 3333 💡
2ND SUPPORT BUY: 3329, 3325 💡
If Gold Break The Trendline Then We See Gold Bearish Price Then We Buy At Support The Target Will Be ATH Liquidity 3390
If Gold Breaks Also 2nd Support Then Continue Bearish Trend Then We Trade Sell On a2nd Support Break
Manage Trades Properly Dont Forget To Follow Us For More Free Trades

GOLD/USD Bullish Reversal and Breakout Target GOLD/USD Bullish Reversal and Breakout Target 🎯 ✨📈
🔍 Technical Analysis Overview:
The chart illustrates a clear bullish reversal pattern following a strong downtrend, with price reacting from a key support zone (highlighted in blue).
Multiple bullish rejection wicks and confirmation candles (green arrows) indicate buying interest at this support.
The recent higher low formation confirms shift in market structure towards bullish bias.
📌 Key Zones:
🟦 Support Zone: Around 3,280 – 3,320 USD
Price respected this zone multiple times (marked with orange circles), confirming its strength.
🟥 Resistance Zone / Target: 3,430 – 3,460 USD
This area aligns with previous swing highs and is the projected target for this bullish move.
📈 Chart Structure:
Break of descending trendline and bullish momentum above support suggests potential continuation towards the marked target.
Falling wedge breakout also aligns with reversal logic.
🎯 Price Target:
3,438.515 USD (resistance area), as labeled on chart with arrow and breakout projection.
🛑 Invalidation Level:
A sustained break below the support zone (3,280 USD) would invalidate this bullish outlook.
📌 Conclusion:
Gold is exhibiting strong bullish behavior with confirmation from price action and structure break. As long as price sustains above support, the path toward 3,438 remains

XAUUSD 15MIN - Bullish Setup I Trade Plan Above 3349This chart presents a carefully planned intraday buy opportunity on XAUUSD (Gold vs. US Dollar), focusing on short-term bullish price action.
📍 Key Levels & Setup Logic:
Buy Entry Zone: 3350
A strong potential demand area based on recent market structure. The price is expected to bounce from this level if bullish pressure sustains.
No Trading Zone: 3337–3349
This zone marks an area of high volatility and indecision. Traders are advised to avoid initiating trades within this range to prevent premature entries and whipsaws.
TP 1 – 3374.35:
First take profit level aligning with minor resistance and past consolidation.
TP 2 – 3390.91:
Second take profit target based on resistance zone and Fibonacci confluence.
Re-Entry Point:
If the price breaks and holds above 3397, a buy-side re-entry is valid at 3398, targeting continuation toward higher resistances.
TP 3 – 3420 & TP 4 – 3445 (Reversal Zone):
Strong resistance and potential exhaustion/reversal zone. Monitor price action closely here for signs of trend weakening.
SL- Previous Swing Low.
⚠️ ZONES:
🔴 No Trading Zone: 3337–3349 (Avoid trades in this range — potential indecision zone)
🔴 Reversal Zone: Near 3445 — monitor price action for potential exhaustion.
📌 Technical Commentary:
Structure favours upside as long as price sustains above the No Trading Zone.
Clean higher-low formation suggests momentum shift.
If price confirms break above 3397 resistance, bullish continuation toward 3445 is highly probable.
🔍 Trade Summary:
Strategy: Buy on Breakout & Pullback
Confirmation: Bullish bounce from 3350 or breakout above 3397
Risk Management: Avoid trades within 3337–3349; reassess if price falls below this zone
Profit Targets: Laddered exits at 3374.35, 3390.91, 3420, 3445
⚠️ Disclaimer & Important Note:
This analysis is for educational and informational purposes only. It does not constitute financial advice or a recommendation to buy or sell any financial instrument. All trading involves risk. We are not responsible for any kind of loss incurred, whether financial, emotional, or otherwise. Always do your own research and consult with a licensed financial advisor before making any trading decisions.
Trading involves significant risk, and you should never invest more than you can afford to lose. Past performance is not indicative of future results.
The trade idea shared above reflects personal market interpretation and is subject to change based on new market conditions.
📍Posted by: THEPATELCRYPTO
📈 Stay safe. Trade smart.
🔔 Follow for more ideas!

XAUUSD/GOLD Geopolitical conflicts have escalated again. Next week is a week of heavy news. How will the gold price focus next week? How to trade? Look at the news preview first.
1. Geopolitics, Russia-Ukraine conflict, Palestine-Israel conflict, Iran-Israel conflict.
2. ADP data, NFP data.
3. Tariff deadline.
The above three news are enough to cause drastic fluctuations in the gold price.
On Friday, the New York market followed my expectations. After rebounding around 3282, it fell back. Finally closed around 3274.
The impact of the weekend news is huge. From the news perspective, the opening price of next Monday will be higher than the closing price on Friday. In terms of operation, you can pay attention to buying at a low price after the market opens.

Gold Trade Setup - 27/Jun/2025Hi Traders,
I expect this pair to go Up after finishing the correction.
1) Need to wait for market to show changing of the direction.
2) The current move can be just a part of a correction or an impulse in itself. Going to follow the market behavior at my zones.
How to Enter : Look for engulfing with in the SL zone.
XAUUSD/GOLD/SellThe pressure from the bears is too great. In the end, the pressure from above was not broken. Instead, it broke out and fell after being under pressure. The stop loss was hit.
The current price is 3285. After gradually boosting the US dollar index. The trend of gold prices has continued to fall. More importantly, the tariff issue has been eased. At the same time, geopolitical factors are also orderly and stable. This is the news that caused the bears to attack.
History has not become the savior because of repeating itself. Of course, this is also an emergency. In some transactions, the extremely low probability of causing losses is a common problem in transactions. However, our analysis team has stabilized a high trading win rate.
Then the next trading plan is still to focus on the pressure from above. If the London market rebounds above 3300. It is still mainly selling. 3314 is an important level for short-term rebound, and we need to pay attention. Although there is no obvious sign of rebound yet, the release of short-selling pressure has been alleviated because the decline is slow. Today's main trading idea is still to sell at high levels.
The target is to focus on the position of 3264-3248. Remember the risk of buying at low levels. Do not trade independently.
Gold May Dip Short-Term Amid Cautious Fed & Geopolitical Calm📊 Market Overview:
• Gold saw a slight correction as Middle East tensions eased following a ceasefire agreement between Iran and Israel.
• A weaker USD and lower U.S. Treasury yields offered some support to gold prices.
• However, the Fed’s cautious stance on rate cuts and upcoming testimony from Chair Powell continue to weigh on gold sentiment.
📉 Technical Analysis:
• Key Resistance Levels:
– $3,350–3,360 (21/50-day SMAs)
– $3,370–3,385 (Fibonacci zone and swing highs)
• Nearest Support Levels:
– $3,316–3,320 (intraday lows and psychological level)
– $3,300–3,305 (strong support), followed by $3,245–3,275 if broken
• EMA 09: Price is currently trading below the 09 EMA, indicating a short-term downtrend.
• Candlestick Pattern / Volume / Momentum:
– The 15-minute chart shows slight recovery signals, but with weak momentum; RSI is below average and MACD is slightly bearish.
– No strong reversal candlestick pattern detected; small-bodied candles (doji) suggest indecision and selling pressure remains near $3,340.
📌 Outlook:
Gold may decline slightly in the short term, potentially retesting the $3,316–3,320 support zone. A rebound is possible if the USD weakens further or the Fed unexpectedly signals rate cuts.
💡 Suggested Trading Plan:
🔻 SELL XAU/USD at: $3,335–3,340
🎯 TP: $3,330 - $3,325
❌ SL: $3,345
🔺 BUY XAU/USD at: $3,318 – 3,315
🎯 TP: $3,320 - $3,325
❌ SL: $3,312

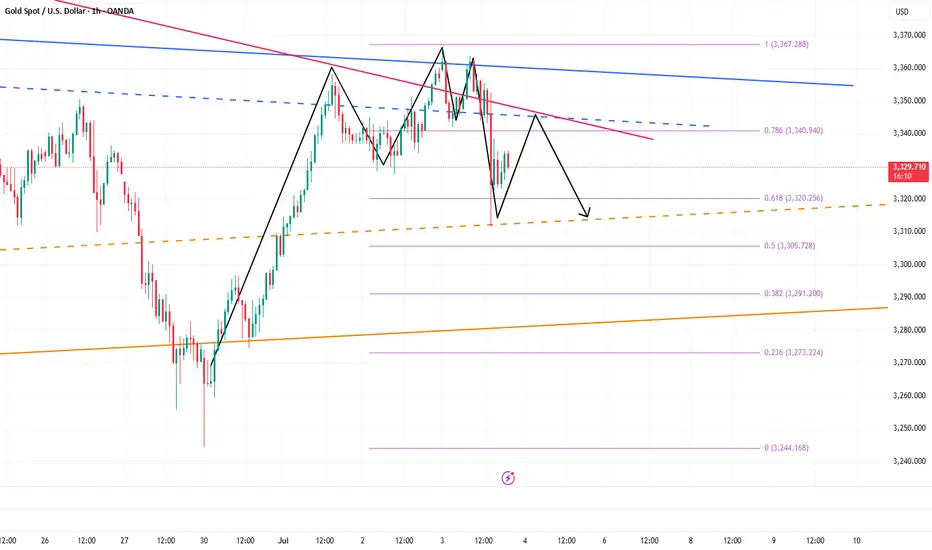
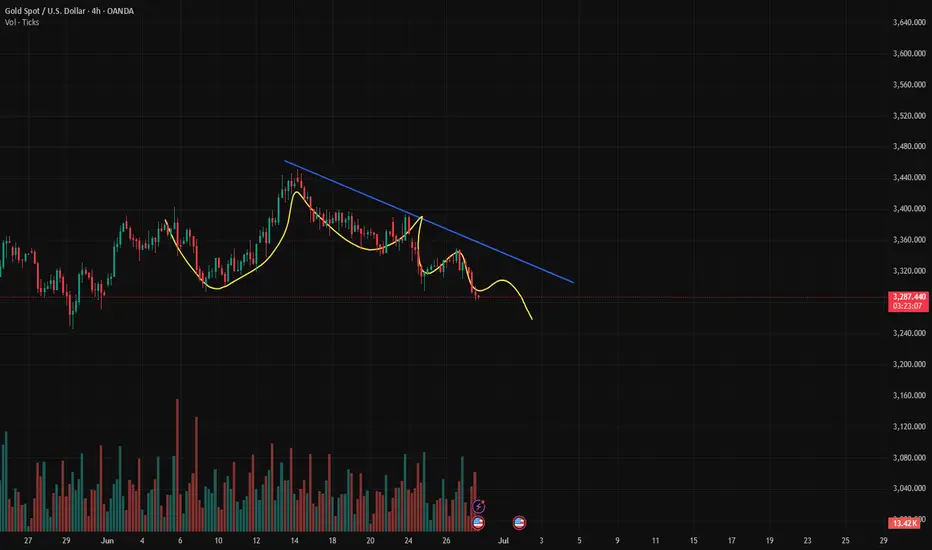
Gold Spot / U.S. Dollar (XAUUSD) 4-Hour Chart - OANDA4-hour candlestick chart from OANDA displays the price movement of Gold Spot (XAUUSD) from late June to early July 2025. The current price is $3,332.245, reflecting a +0.26% increase (+$8.795) as of 07:39 AM CEST on June 25, 2025. The chart highlights a recent price range between $3,320.076 and $3,365.226, with a notable support level around $3,329.934 and resistance near $3,355.226. The chart includes a shaded area indicating a consolidation or trading range.

Gold updateAfter the previous level was broken and structure shifted, we’re now entering a new phase of analysis.
In this fresh setup, we’re looking for buy opportunities — but not blindly!
As always, waiting for a clean pullback to the new zone and a solid entry signal.
Experience teaches us: real profits come from patience and planning.
Here’s my new gold analysis — high probability, low risk.
For detailed entry points, trade management, and high-probability setups, follow the channel:
ForexCSP

Bearish Continuation Pattern Detected on GOLD/USD Bearish Continuation Pattern Detected on GOLD/USD 📉
📊 Chart Analysis Summary:
The GOLD/USD chart shows a clear bearish continuation pattern, following a rejection from a major resistance zone.
🔍 Key Technical Highlights:
🔺 Resistance Zone:
Strong resistance at 3,420 – 3,440 USD, marked by multiple rejections (🔴 red arrows).
Price formed a Bearish Harmonic Pattern (likely a Gartley or Bat), suggesting reversal from this resistance.
🔻 Bearish Momentum:
After the pattern completed, price broke below the minor support structure and is currently forming lower highs and lower lows, indicating bearish structure.
📉 Support Level:
Strong horizontal support zone around 3,298 – 3,300 USD, marked as “TARGET.”
This area was previously tested (🟠 orange circles) and now projected to act as a target level again.
🔄 Minor Retracement Zone:
Expecting a minor pullback to 3,347 USD (purple line) before potential continuation downward.
This zone aligns with the previous support turned resistance (classic SR flip).
🎯 Target Projection:
Based on the bearish impulse and measured move, the projected target is around 3,298.758 USD, which coincides with the previous support zone.
📌 Conclusion:
The price action suggests a high-probability bearish continuation, targeting the 3,298 USD zone unless the price breaks and holds above 3,347 USD. Traders may consider selling on rallies with a confirmation of rejection at resistance.
📉 Bias: Bearish
📍 Invalidation: Break and daily close above 3,347 USD
📉
📊 Chart Analysis Summary:
The GOLD/USD chart shows a clear bearish continuation pattern, following a rejection from a major resistance zone.
🔍 Key Technical Highlights:
🔺 Resistance Zone:
Strong resistance at 3,420 – 3,440 USD, marked by multiple rejections (🔴 red arrows).
Price formed a Bearish Harmonic Pattern (likely a Gartley or Bat), suggesting reversal from this resistance.
🔻 Bearish Momentum:
After the pattern completed, price broke below the minor support structure and is currently forming lower highs and lower lows, indicating bearish structure.
📉 Support Level:
Strong horizontal support zone around 3,298 – 3,300 USD, marked as “TARGET.”
This area was previously tested (🟠 orange circles) and now projected to act as a target level again.
🔄 Minor Retracement Zone:
Expecting a minor pullback to 3,347 USD (purple line) before potential continuation downward.
This zone aligns with the previous support turned resistance (classic SR flip).
🎯 Target Projection:
Based on the bearish impulse and measured move, the projected target is around 3,298.758 USD, which coincides with the previous support zone.
📌 Conclusion:
The price action suggests a high-probability bearish continuation, targeting the 3,298 USD zone unless the price breaks and holds above 3,347 USD. Traders may consider selling on rallies with a confirmation of rejection at resistance.
📉 Bias: Bearish
📍 Invalidation: Break and daily close above 3,347 USD

GOLD Intraday Chart Update For 24 June 2025Hello Traders, As you can see that GOLD fell sharply this morning due to Israel- Iran Cease fire scenario
Further more FED Chair POWELL Testifies Starts from Today and end on Tomorrow make sure to manage you trading accordingly
Right now GOLD is in Strong Bearish Trend only clear Breakout of 3368 level for the day below this market remains Bearish
All eyes on 3300 Psychological Digit for now if market breaks 3300 Successfully then it will move towards 3250 soon
Disclaimer: Forex is Risky
