Analysis of gold trend on June 16!
📣Gold information:
Gold prices (XAU/USD) climbed to $3,445 in early Asian trading on Monday, the highest level in more than a month, as rising tensions in the Middle East and expectations of a rate cut by the Federal Reserve boosted demand for safe-haven assets.
Investors remain focused on geopolitical risks despite stronger-than-expected U.S. economic data on Friday. The University of Michigan's consumer confidence index jumped to 60.5 in June, well above market expectations of 53.5 and 52.2 in May. However, the market largely shrugged off the data. Instead, attention turned to the escalating conflict in the Middle East, with Israel's recent attack on Iran fueling concerns about instability in the wider region. In response, Iranian authorities warned that they would "respond firmly to any adventurism," which boosted gold's appeal amid global uncertainty.
⭐️Technical review and analysis: For the current short-term operation of gold, it is recommended to rebound high and go long, with the upward resistance level of 3450-3500 and the downward support level of 3385-3335.
⭐️Set gold price:
🔥Sell gold area: 3465-3475 SL 3485
TP1: $3450
TP2: $3430
🔥Buy gold area: $3390-$3388 SL $3383
TP1: $3400
TP2: $3422
Goldlongterm

Is this week a chance for gold to break through 3,500?
⭐️Gold Information:
Gold prices surged for the third consecutive trading day on Friday as geopolitical tensions intensified after Israel launched a military strike on Iranian targets, including nuclear facilities and key leaders. The escalation of the situation triggered widespread risk aversion in global markets, stimulating demand for safe-haven assets. As of the time of writing, XAU/USD was trading at $3,431.
Gold surged to a five-week high of $3,446 before giving up gains as traders took profits before the weekend. Geopolitical turmoil, coupled with dovish signals released by recent US inflation data, reinforced expectations that the Federal Reserve may begin to cut interest rates later this year - despite improved consumer confidence. These factors together support the bullish momentum of gold.
⭐️Personal Comment:
Continued military tensions next week are a big driving force for gold prices to continue to break through 3,500
. 🔥 Technical aspects:
Based on the resistance and support levels of gold prices in the H4 framework, the following important key areas can be identified:
Resistance: $3488, $3502, $3562
Support: $3382, $3342

Geopolitical tensions, gold prices may reach 3480 points⭐️Personal comments:
Due to the escalation of geopolitical tensions in the Middle East, market risk sentiment has slightly rebounded, and investors are more inclined to buy traditional safe-haven assets-gold
Moving towards 3480
⭐️Set gold price:
🔥Sell gold area: 3478-3480 SL 3485
TP1: $3462
TP2: $3450
TP3: $3435
🔥Buy gold area: $3375-$3377 SL $3370
TP1: $3389
TP2: $3400
TP3: $3412

GOLD/USD Bullish Breakout ConfirmationGOLD/USD Bullish Breakout Confirmation 🚀📈
📊 Technical Analysis Overview:
The chart illustrates a bullish breakout above a well-defined resistance zone around $3,390–$3,400. Price action has decisively closed above this resistance, suggesting strong bullish momentum.
🔍 Key Observations:
🟦 Support Zone:
Marked clearly between $3,250–$3,280, this level has held firm multiple times (highlighted with green arrows and orange circles), confirming buyer interest and market structure.
🟦 Resistance Turned Support:
The previous resistance zone around $3,390–$3,400 has now potentially turned into a new support. Price retesting this zone and holding would further validate the breakout.
📈 Future Projections:
The chart anticipates a retest-pullback-continuation scenario:
Pullback to new support 📉
Bullish continuation toward $3,460+ 🎯 if support holds.
✅ Bias:
Bullish as long as price remains above the $3,390 zone. Break and hold below would invalidate the bullish setup.
📌 Strategy Tip:
Look for confirmation on the lower timeframes (e.g., bullish engulfing or pin bar) on the retest before entering long.

Gold rose as expected, how to operate after the bulls hit 3400
📌 Gold News
Spot gold prices rose sharply. Analysts pointed out that the US CPI was lower than expected across the board, which hit the US dollar and US bond yields. In addition, tensions in the Middle East escalated, which triggered safe-haven buying of gold
📊Comment Analysis
Middle East issues, and information about high tariffs on countries without trade agreements. Gold prices have rebounded, but there is no long-term stability.
💰Strategy Package
🔥Sell Gold Zone: 3428-3430 SL 3435
TP1: $3410
TP2: $3395
TP3: $3387
🔥Buy Gold Zone: $3345-$3343 SL $3338
TP1: $3365
TP2: $3377
TP3: $3390
⭐️ Note: Labaron hopes that traders can properly manage their funds
- Choose the number of lots that matches your funds

Iran hardens steel, gold rises!
📣Gold news
On Thursday (June 12, 00:00 in the Asian morning, spot gold continued to rise, reaching a high of $3,377 so far, a new high this week. The lower-than-expected US CPI data in May increased the possibility of the Federal Reserve's interest rate cut in September, and the trend of the US dollar and the decline in US bond yields provided a favorable environment for gold prices. At the same time, tensions in the Middle East escalated on Wednesday, and Iran said it would attack US military bases in the Middle East if negotiations broke down. The sharp rise in geopolitical tensions in the Middle East has significantly increased the safe-haven demand for gold. Although the conclusion of the US-China trade agreement has eased some market pressure, the potential impact of tariff policies on inflation still needs to be vigilant. Looking ahead, investors need to pay close attention to Thursday's PPI data and the Fed's policy trends, while keeping an eye on the situation in the Middle East. Driven by risk aversion and expectations of loose monetary policy, the gold market still has room for upside in the short term.
📣Technical side:
Yesterday's CPI data was bullish. After a brief surge, it fell back to below 3330, and then fluctuated. The rise was not strong. Late at night, Trump again called on the Federal Reserve to cut interest rates by 100 basis points. Confidence in the Iran nuclear negotiations decreased. In the next one to two weeks, he will send a letter to trading partners to set unilateral tariffs. Uncertain risks increased. Gold rose in contact with the CPI data. In the short term, the price broke through the 3348-3353 suppression. Consider going low around this position during the day, looking at the 3383-89 suppression, stop loss 3337, pay attention to risks.
💰Strategy Package
Today's trading strategy: long around 3349. Stop loss 3337, take profit 3383
Short around 3370, stop loss 3374, take profit 3350
Trend value trading is the only way for all investors to make profits. There is no shortcut, and don't be lucky. Any investor needs to go through the process of loss, capital preservation, and profit from the beginning of entering the market. The market is definitely not a long-term paradise for speculators. A successful speculation does not mean that it can be successful from beginning to end. Only stable and continuous profits can make a person successful. There must be rules here. If you don't break the rules, you won't be eliminated.

Gold continues to fluctuate, CPI data becomes the key
Technically, the daily chart continues to fluctuate sideways, the moving average is glued together, and the RSI indicator runs near the middle axis. The moving average of the four-hour chart is also glued together, the price is adjusted near the middle track of the Bollinger Band, and the RSI indicator also runs near the middle axis. The gold price once broke through the 3349 mark yesterday, and then fell back and closed near 3320.
Focus on the 3320 position during the Asian session. From a technical perspective, the gold price continues to fluctuate in a range. Under the premise of the lack of news stimulating negative impact, from a technical perspective, the gold price continues to maintain low buying.
From the daily level, gold has been fluctuating at a high level since the high of 3500. The current highs of 3500, 3435, and 3403 are gradually moving down, and the lows of 3120, 3245, and 3293 are gradually moving up. The range of fluctuations is gradually narrowing. The short-term market may continue to fluctuate. If it breaks through, it will need to wait for major news stimulation to break through the direction!
💰Strategy Package
Then today's lock-up range is 3293-3350. It is recommended to sell high and buy low. Before the effective breakthrough of the range, short-term or ultra-short-term scalping is the main means.
Key points:
First support level: 3320, second support level: 3306, third support level: 3292
First resistance: 3346, second resistance: 3358, third resistance: 3376
Buy: 3303-3305, stop loss: 3292, target: 3320-3330;
Sell: 3350-3353, stop loss: 3362, target: 3330-3320;
⭐️ Note: Labaron hopes that traders can properly manage their funds
- Choose the number of lots that matches your funds

Analysis of gold prices on June 11
📌Gold news
🎈Economic data and policy expectations
U.S. employment data; initial jobless claims increased for two consecutive weeks, and the market focus shifted to the non-farm payroll report released this week. The data performance will affect the Fed's policy path.
Trump pressures interest rate cuts: Trump recently called on the Fed to cut interest rates by "one percentage point" again, and hinted that he would consider replacing the Fed chairman, exacerbating market expectations for loose monetary policy.
🎈Long-term support factors
Despite short-term fluctuations, global economic and geopolitical uncertainties (such as repeated trade frictions and debt risks) still provide long-term safe-haven demand for gold, especially in the context of the divergence of monetary policies between European and American central banks, the allocation value of gold is highlighted.
📊Technical analysis
Before the European session, the gold price showed a continuous positive trend. I gave a hint in my analysis that I was not in a hurry to guess the top, and followed the trend to rise to around 3340 and wait for the turning point to appear. The opening trend of the European session tended to fluctuate until it rose to around 3348 in the evening and then turned from rising to falling, but the decline was not strong. It rose again at the position of the European session. Now the gold price is trading around 3350. From the market point of view, this wave of rise was supported by the trend line at 3300. Whether it was geopolitical conflicts or various news about Sino-US trade negotiations that stimulated buying to drive gold prices up, the second rise in the US session has exceeded 3340.
The next key suppression level is around 3360, which is 618 from 3403 to 3300, which can be treated as a turning point. The initial support below focuses on the high point of yesterday's Asian session at 3338.
💰Strategy Package
Waiting for gold: short at 3355-3360, stop loss at 3365, target at 3340-3328!
⭐️ Note: Labaron hopes that traders can properly manage their funds
- Choose the number of lots that matches your funds

Gold fluctuates widely, strategy remains unchanged
📌Gold news
The US and Chinese delegations will continue talks in London for the second consecutive day. President Trump expressed optimism, saying the talks "should go well". US officials said the talks could lead to Washington lifting certain technology export restrictions in exchange for Beijing relaxing controls on rare earth exports - a material that is critical to industries such as energy, defense and advanced technology. The results of these negotiations may provide a new direction for precious metals
📊Comment analysis
The European session continued to retrace and gave a low of 3293, then slowly strengthened. The current high reached 3349, so today's strategy does not need to be changed for the time being. If the current market is given to 3335-3345 again, short orders can still be entered. The current trend is still weak, and the US market is likely to follow the old path of a second decline, so the current idea of shorting on the pullback remains unchanged for the time being!
💰Strategy package
Gold: Short on rebound 3335-3345, stop loss 3350, target 3300-3280!
⭐️ Note: Labaron hopes that traders can properly manage their funds
- Choose the lot size that matches your funds
-

The short-term tug-of-war for gold is starting
Gold prices continued their decline last Friday and stabilized and rebounded. Yesterday, gold prices fell back to the 3,300 mark, then slowly rose to the 3,338 mark, and fell back after encountering resistance, which is in line with the technical consolidation rhythm.
- China-US trade negotiations: The US has released signals that it is willing to relax export restrictions, and the market is waiting for the results of the negotiations, which may affect risk sentiment.
- US May CPI data: Inflation changes will provide key guidance for the Fed's policies.
- The current trend is weak, but the downside is limited. Buy on dips and avoid large-scale shorting.
- Today, it is recommended to wait and see, and wait for the negotiation results to become clear before entering the market to reduce volatility risks.
🔥Sell gold area: 3330-3348 SL 3352
TP1: $3320
TP2: $3310
🔥Buy gold area: $3295-$3305 SL $3290
TP1: $3320
TP2: $3330

Gold hits 3335 in the US market and shorts
⭐️Gold information:
Looking back at last week's trend, after hitting a high on Monday, gold prices fluctuated in a range from Tuesday to Thursday, and closed with a sharp drop on Friday, forming an M-top pattern from a technical perspective.
This week, the market focus is on the high-level trade negotiations between China and the United States held in London. The market expects that the negotiations will proceed smoothly, and this optimism is bearish for gold. Based on the comprehensive technical and fundamental analysis, the gold price is still bearish today. It is recommended to pay attention to the short-selling opportunities in the rebound range of 3330-3340 US dollars.
⭐️Set gold price:
🔥Sell gold area: 3330-3340 SL 3345
TP1: $3320
TP2: $3310
TP3: $3295

Gold support near 3280 remains strong!
⭐️Gold information:
Gold prices (XAU/USD) stabilized near $3,310 in early Asian trading on Monday, and gold prices struggled to gain momentum against the backdrop of renewed strength in the U.S. dollar (USD). As of press time, gold was around 3315 points. Although the strengthening U.S. dollar posed resistance to gold, lingering uncertainty surrounding President Trump's tariff strategy continued to provide some support for it.
On Friday, optimistic labor market data boosted the dollar and put pressure on dollar-denominated assets such as gold. The U.S. Bureau of Labor Statistics (BLS) reported that nonfarm payrolls increased by 139,000 in May, exceeding expectations of 130,000 and exceeding the revised 147,000 (originally 177,000) last month. The stronger-than-expected employment report dampened hopes for a near-term rate cut by the Federal Reserve and weighed on the appeal of gold prices.
⭐️Set gold price:
🔥Sell gold area: 3348-3350 SL 3355
TP1: $3340
TP2: $3330
TP3: $3320
🔥Buy gold area: $3281-$3279 SL $3274
TP1: $3292
TP2: $3300
TP3: $3315

How will gold perform in the future?Market news:
In the early Asian session on Monday (June 9), spot gold opened high and fell, currently trading around $3,305/ounce. The large-scale riots in Los Angeles, the United States, attracted some safe-haven buying to support the London gold price. The stronger-than-expected US employment report hit the Federal Reserve's hopes of cutting interest rates this year, and silver once surged to its highest level since 2012. Data from the US Department of Labor showed that employers added 139,000 jobs in May, less than 147,000 in April, but more than the 130,000 increase predicted by a survey of economists. After the data was released, the financial market bet that the Federal Reserve would not cut interest rates until September, and the probability of a rate cut in September dropped from 88% to 60%. There will be two rate cuts in 2025, reducing bets on a possible third rate cut.In the next week, the market will usher in major trade negotiations and heavyweight US CPI data, which investors need to pay close attention to. In addition, US federal law enforcement officers continued to search for illegal immigrants in many places in Los Angeles County on the 7th, and had serious conflicts with local community residents for the second consecutive day. Investors also need to pay attention to the impact of market sentiment.
Technical Review:
Technically, gold plunged sharply after midnight on Friday, and the weekly line closed with a long upper shadow line and a small positive. The 3400 mark encountered resistance and fell sharply and fell into another adjustment cycle. The daily line closed with a continuous negative structure, and the New York closing price once again lost the MA10-day moving average of 3330. The price returned to the middle track of the Bollinger band at 3310, and the RSI indicator's central axis 50 value flattened! The short-term four-hour chart MA10/7-day moving average opened downward, the RSI indicator's central axis 50 value ran below, and the Bollinger band opened downward and the price ran along the middle and lower tracks. At the beginning of the week, trading focused on the rebound strength after the oversold. The main idea was to sell at a high price on the rebound, and to buy at a low price as an auxiliary.
Today's analysis:
At the daily level, the price of gold has maintained a volatile pattern in recent times. The Bollinger band opening narrowed, indicating that the buying and selling forces were stalemate. MACD fast and slow lines are above the zero axis, the spacing is narrowing and there is a golden cross trend, the red kinetic energy column is beginning to appear, the buying power is slowly gathering, the RSI indicator is around 55, and the buying and selling game is fierce! From the hourly line, the Bollinger Bands open downward, and selling is temporarily dominant.MACD dead cross operation, the green kinetic energy column continues to increase, the 5-day moving average crosses the 10-day moving average, and the short-term downward trend is obvious. However, the current support near 3300 is strong, and it rebounded after multiple dips. In the future, we need to pay attention to the breakthrough of key positions to grasp the trading opportunity.
Operation ideas:
Short-term gold 3283-3286 buy, stop loss 3275, target 3310-3330;
Short-term gold 3330-3333 sell, stop loss 3342, target 3290-3270;
Key points:
First support level: 3293, second support level: 3271, third support level: 3253
First resistance level: 3330, second resistance level: 3356, third resistance level: 3378

Gold will still fall below 3,300 next week!
📣World Situation:
Gold prices fell for the second consecutive trading day on Friday, but are still expected to close with a gain of more than 1.30% as traders readjusted expectations for Fed policy easing after a stronger-than-expected US non-farm payrolls report. At the time of writing, XAU/USD was trading at $3,322, down 0.84% on a daily basis.
The US Bureau of Labor Statistics (BLS) reported that the labor market continued to show resilience, with the unemployment rate remaining stable from April. Meanwhile, Wall Street rebounded modestly from Thursday's losses despite increased political tensions between President Donald Trump and Tesla CEO Elon Musk after the House of Representatives approved a bill to raise the US debt ceiling.
Next Wednesday: ① Data: API crude oil inventory in the United States for the week ending June 6, US May unadjusted CPI annual rate, May seasonally adjusted CPI monthly rate, May seasonally adjusted core CPI monthly rate, May unadjusted core CPI annual rate, pay attention to real-time data changes.
Geopolitical risks and trade tensions have eased, and the call between Chinese and American leaders has released a signal of easing. Trump said that the trade negotiations have reached a "positive conclusion", weakening the attractiveness of gold as a safe-haven asset.
🔥 Technical side:
Based on the resistance and support levels of gold prices on the 4-hour chart, NOVA sorted out the important key areas as follows:
Resistance: $3347, $3400
Support: $3252, $3202

US market fluctuates around 3400-3370, short first
📌 Driving events
Heightened tensions between China and the United States have also fueled the bullish momentum of gold prices. As the upcoming trade negotiations between Washington and Beijing are full of uncertainty, investors have sought safe-haven assets such as gold.
Adding to the market's nervousness, President Donald Trump signed an executive order to double the import tariffs on steel and aluminum from 25% to 50%, effective June 4. The move came a few days before Trump's much-anticipated call with Chinese President Xi Jinping, further fueling concerns about escalating trade frictions.
📊Commentary and analysis
Gold failed to fall back to 3353 during the day, and the lowest point was 3360, and it ushered in an increase, and the highest point was 3403. In the short term, 3403 was suppressed, or it may fall back, and then it fell into volatility again. The idea is to suppress short positions around 3403, stop loss at 3413, and stop profit at 3380-3372. Short-term trading, pay attention to risks.
June 5th US gold short-term trading: short near 3400, stop loss 3413, light position, take profit 3375
Short near 3372, stop loss 3360, take profit 3400
⭐️ Note: Labaron hopes that traders can properly manage their funds
- Choose the number of lots that matches your funds

Gold fluctuates, with downward support at 3325
📌 Driving events
The number of ADP jobs in the United States in May was 37,000, expected to be 110,000, and the previous value was 62,000.
📊Comment analysis
Views on the trend of gold in the US market!
After a day of swinging, gold is still fluctuating between 3372 and 3340. After opening high and closing low on Monday, gold has been fluctuating for two days. The ADP data will be released tonight. Whether it can break the trend of the volatile market tonight depends on the release of the ADP data. If it is still the case, we can only wait for the big non-agricultural data on Friday. In the face of this volatile trend, Labaron still recommends maintaining the previous operation strategy.
The support below is 3330-25. If it breaks down, we will talk about it. If it still remains above this level, we will still operate with the oscillating trend. After all, in the face of the current trend of neither long nor short continuity, a single direction will only make you lose all your profits. For the current decline, we should first look at the support of 3330-25!
⭐️ Note: Labaron hopes that traders can properly manage their funds
- Choose the number of lots that matches your funds

| Gold | And Gold Alone : Buy The Best | Accept No Substitute | | Gold | And Gold Alone : Buy The Best | Accept No Substitution |
Gold
Accept No Substitute.
Never fall into the "Catch-Up Game Trap."
Silver is presently such a Trap.
Gold will continue to Outperform Silver
Don't let a Dealer convince you otherwise
Buy Strength, Sell Weakness
Buy The Best, Winner takes all
Gold / > United States Dollar
Gold / > US Dollar Index
Gold / > Swiss Franc
Gold / > Great British Pound
Gold / > Euro
Gold / > Japanese Yen
Gold / > Bitcoin
Gold / > Silver
Bitcoin / < Gold
Bitcoin Total Market Cap / < Gold
Silver / < Gold
Pro Tip : Rarely a good bet, if your Broker is paying carry for you to hold it.
It's in the Detail
🌟

Gold price returns to 3400?
📣 Gold Information
Gold prices gave up some of Monday's gains on Tuesday, falling more than 0.80% as strong U.S. labor market data reinforced expectations of a strong economy and put pressure on the non-yielding metal. As of writing, XAU/USD was trading around $3,348, hitting an intraday high of $3,392.
Investor sentiment picked up after the latest U.S. Job Openings and Labor Turnover Survey (JOLTS) showed a sharp increase in job openings in April, indicating a continued tight labor market. The optimistic data came this week, which will see a series of key employment reports released, including the ADP employment change data for May released on Wednesday and the much-anticipated non-farm payrolls data on Friday, both of which could affect expectations of Fed policy.
📊Comment Analysis
Gold prices maintain bullish momentum, tariff momentum coupled with current unfavorable economic data
💰Strategy Package
🔥Sell Gold Area: 3411-3413 SL 3418
TP1: $3400
TP2: $3390
TP3: $3380🔥
Buy Gold Area: $3332-$3330 SL $3325
TP1: $3345
TP2: $3358
TP3: $3370
⭐️ Note: Labaron hopes that traders can properly manage their funds
- Choose a lot size that matches your funds
- Profit is 4-7% of the capital account
- Stop loss is 1-3% of the capital account

Prices exploded. Beware of falling support.Information summary:
Russia and Ukraine held a second round of peace talks on Monday. The two sides only agreed on the exchange of prisoners.
No breakthroughs have been made on the proposed ceasefire agreement that Ukraine, its European allies and Washington have called on Russia to accept.
Umerov said Ukraine proposed more talks before the end of June, but believed that only a direct meeting between Zelensky and Putin could resolve the differences between the two sides on several key issues. Secondly, Trump's tariff issue has escalated global trade tensions, and the intensification of the Russian-Ukrainian conflict has also caused geopolitical risks to rise rapidly.
Market analysis:
Gold has stretched directly from 3290 at the beginning of the week to a high of 3391, a $100 increase.
From the perspective of the daily gold line, it is indeed in a bullish trend, breaking through several important pressure levels. But I think all traders need to be wary of chasing more at high levels.
The daily trend of gold started from 3120. 3120-3365 is the a wave, 3365-3242 is the retracement of the b wave. So the current trend from 3242 is the rise of the c wave. After breaking through 3340 on Monday, gold has reached 3396 near the 618 position.
At present, if gold cannot stand above 3400, it is very likely to maintain the consolidation in the 3396-3340 range.
Especially before the release of non-agricultural data this week, such a large fluctuation range. Be sure to be alert to the possibility of continuing to fall back to the support of 3340-3330.
Operation strategy:
If the price falls back to around 3340-3350, go long, stop loss at 3330, and profit range at 3370-3380.
Of course, if you prefer aggressive trading, you can choose a short strategy at 3370-3380, stop loss at 3390, and profit range at 3340-3330.

Gold surges, what is the subsequent trend?Weekly chart analysis:
From the weekly chart, gold has been pushed upward for five waves from the starting position of 1614. The current market is in the extended wave of wave 3. Gold has adjusted downward from the high point of 3500. The current market is divided into two situations.
In the first case, assuming that the high point of 3500 has completed the 3rd wave, then 3500 will adjust downward for 4 waves. The three-wave ABC structure within the 4th wave regards 3500-3120 as wave A, 3120 upward as wave B, and there is another wave C decline after wave B to complete the 4th wave adjustment, and then the 5th wave will rise. Therefore, after the market rises, pay attention to the C wave decline at any time.
In the second case, assuming that the 3rd wave has not been completed yet, 3500 is still in the internal adjustment of the extended wave of wave 3. At present, the three-wave ABC adjustment of 3500-3120 has ended, and a new round of upward rise from 3120 may complete the last wave of the 3rd wave. Therefore, after the market rises above 3500, it will face the 4th wave decline at any time.
Hourly chart analysis:
In the 1-hour chart, no matter how the market operates, the current market trend is in a state of shock. Affected by the increased risk aversion due to the weekend news, the market rose sharply after opening on Monday. So what will the trend be after the surge? I think that after the rise, try not to chase the rise, but look for high positions to short, and wait for the market to adjust downward before going long.
Operation analysis:
Currently, the upper resistance is 3385-3405, and the lower support is 3350-3330. Short-term operation suggestions: short at the high point area of 3385-3395, stop loss at 3410, profit range 3360-3350, and continue to look down at 3330-3320 if it breaks. It is recommended to continue to look above 3400 if 3350 is not broken.
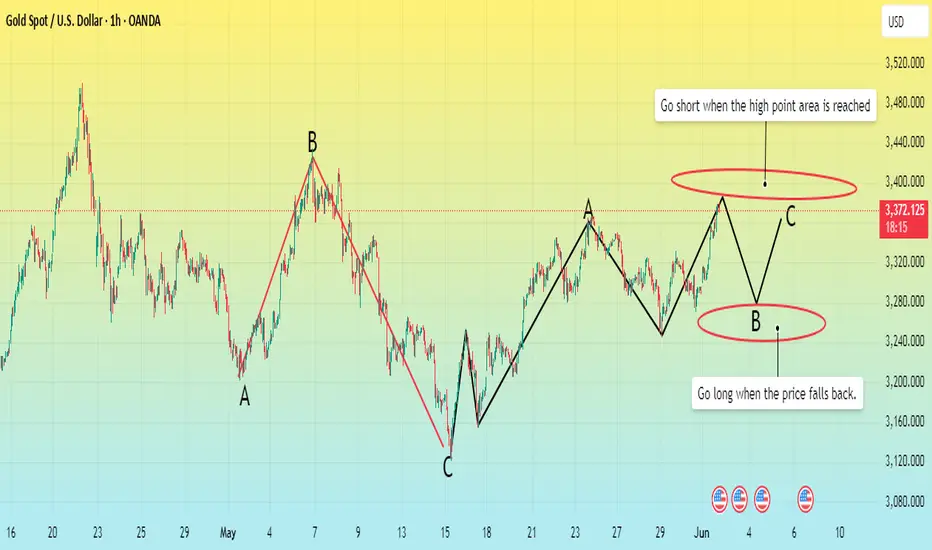
Technical Analysis → Gold will remain stableThroughout May, the news backdrop, including international trade tariffs and geopolitical turmoil, led to a technical peak of around $3,430 and a low near $3,130 in gold. As of now, the price per ounce is stable at around $3,300, roughly the same level as at the beginning of the month.
This shows that supply and demand forces are basically balanced, and prices are maintained between these two extremes. Gold technicals further confirm this and highlight the importance of the $3,300 level.
Bearish perspective: The A→B→C→D→E sequence forms a peak high and a cycle low, which is a clear downtrend signal. The trajectory is marked in red, and the upper line constitutes resistance.
Bullish perspective: Since the beginning of 2025, the price of gold has been in an upward trend, represented by the blue channel, and its lower boundary constitutes key support (marked with arrows).
It is worth noting that these support and resistance lines are converging, forming a narrowing triangle. This shows that supply and demand are balancing and the market has reached a consensus around the $3,300 level, which is exactly the central axis of the triangle.
Based on this, we can reasonably assume that the technical side of gold in June may continue to fluctuate within this triangle unless a special event occurs that causes a significant break in the current balance.

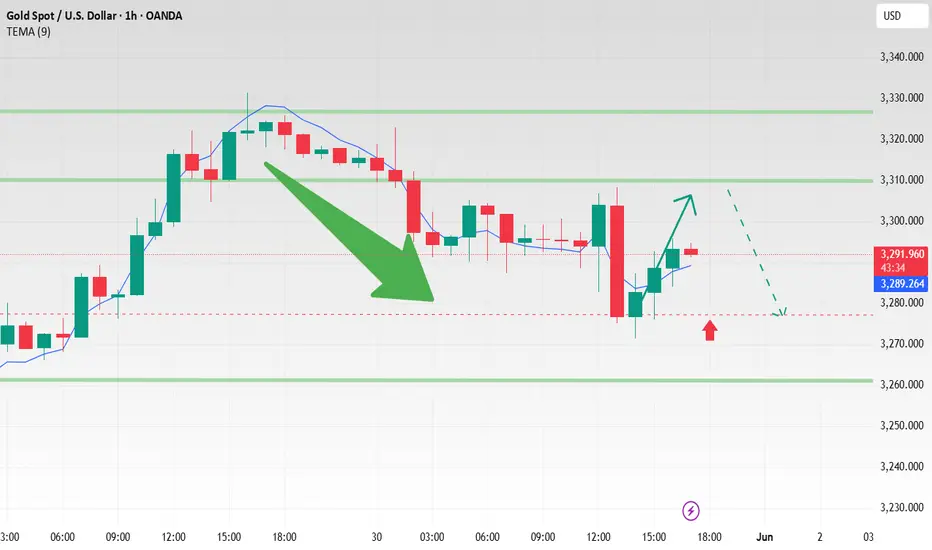
Gold retested as expected, what to do next?
Gold rebounded from 3308 in the US market and fell to 3272. The recent market is good-looking but difficult to do. The long and short positions are repeatedly washed. The monthly line basically closed at the cross star. Under the fierce game between long and short positions, the performance was balanced.
The short-term hourly line is only a single negative line that fell rapidly, and it does not have downward continuity. The high point of the US market rebound is around 3302. If you want to participate, you can go short when it reaches around 3302. As of press time, gold is accumulating strength around 3293. If you step back below, you can rely on the low point for defense.
⭐️ Note: Labaron hopes that traders can properly manage their funds
- Choose the number of lots that matches your funds
- Profit is 4-7% of the fund account
- Stop loss is 1-3% of the fund account
Data is out. Gold is fluctuating.Information summary:
On Wednesday, US time, the Trade Court ordered an immediate halt to tariffs; the next day, the Federal Court of Appeals immediately resumed the policy. At the same time, the Trade Court was required to respond by June 5, and the government by June 9. Tariff policies are back and forth, and it is difficult to figure out. In other words, don't expect the US government to come up with any good news.
Today, the annual rate of the US core PCE price index in April was 2.6% in the previous value and 2.5% in the expected value. The expectation seen at the beginning of the week was 2.6%. Now the expectation is directly lowered. Is it to leave room for this announcement? If the increase is not higher than the previous value, it is not a significant increase, but it leaves room for interest rate cuts. For gold, the increase is not higher than the previous value, and the short position is limited.
This mediocre data can directly provide a basis for speculation on the current economic situation in the United States.
After yesterday's strong rise, with a very long lower shadow left on the middle track of the Bollinger Band, after stabilizing the middle track, the fast and slow lines further converged and flattened, indicating that the main funds are also hesitating. From this perspective, today's market may continue to fluctuate within the middle track.
At the same time, the closing line is also the most critical, which is around 3285-90 near the middle track.
Operation strategy:
Today's trading needs to pay attention to the cycle suppression position of 3315-3330 on the upper side, and the cycle support level of 3385-3380 on the lower side. This range can be maintained for scalping trading.
If the gold price breaks through strongly upward or downward, the new trend will be realized in a very short time, so traders need to make profits and stop losses in time.
