Gold fluctuates repeatedly and is expected to fall below 3,200
📌 Driving factors
The U.S. Department of Labor's Bureau of Labor Statistics announced on Tuesday that the U.S. Consumer Price Index (CPI) rose 0.2% month-on-month in April, lower than the 0.3% expected by economists. However, analysts warned that inflation may rise as tariffs gradually push up commodity prices.
The United States and China announced on Monday that they would suspend tariffs for 90 days. According to the statement made by both sides after the Geneva talks last weekend, the United States will reduce tariffs on Chinese imports from 145% to 30%, and China will reduce tariffs on U.S. imports from 125% to 10%.
Driven by bargain hunting, gold prices rebounded on Tuesday, and the weaker-than-expected U.S. inflation data released that day also helped gold prices rise. However, trade optimism limits the strength of gold's rebound.
📊Commentary and analysis
Gold fell and then rose yesterday, and the final rebound stopped at 3,266. The trend is in line with our bearish expectations. As for the repeated fluctuations in the market, it is just a futile effort! Yesterday, due to the influence of the US CPI data, although gold rose in the short term, it was still under pressure and weakened. Today, the Asian session continued to fall in the early trading. As the support position near 3210 points is approaching, aggressive shorting is no longer appropriate!
In terms of trend, the 4-hour level trend of gold is still under pressure. Yesterday, it was under pressure at the 3260 line, and then the market fell back. Recently, it has maintained a trend of continuously moving down lows, and the rebound highs are gradually decreasing. It can be seen that the bulls are less willing to attack, which is different from the previous surge. Gold adjustment has become inevitable.
💰Strategy Package
Rebound short: short near 3265, stop loss 3269, target near 3220!
Labaron believes that
Guaranteeing the principal is the bottom line for survival, controlling risks is the armor for survival, earning income is a stage medal, and long-term stable and continuous profit is the only certificate to finally stand up from the sea of corpses and blood.
Goldlongterm

Gold is also hesitating whether to break the position or not.
It is not unfair to say that gold fluctuates slowly.
I mentioned in my article yesterday that it depends on the closing level of gold. Different closings represent different meanings. 3235 was treated as the standard watershed on that day. As a result, gold fluctuated sideways in the afternoon despite the rebound of US stocks. In terms of the daily structure, it closed with a middle-yin candle with a lower shadow, and closed flat at 3235.
There is more than 200 points of pressure above, and it can close flat, which means that gold does have something. Of course, just closing flat does not completely mean that gold bulls are back. It can only be said that bulls are still in the market and have not completely fled. Then it is normal for gold to rebound after testing 3200 again and receiving support.
There are also reasons in terms of market sentiment. Judging from the main speculative sentiment report, it has been a long-term horizontal bullish trend. From the perspective of capital sentiment, global stock markets were soaring on Monday. The easing of the trade war between the world's two major economies encouraged funds to no longer simply entrench themselves in gold and began to bloom in multiple directions.
That being said, let's count them: 91% of retaliatory tariffs were canceled; 24% of reciprocal tariffs were suspended for 90 days; 20% of fentanyl tariffs were not mentioned; 10% of universal tariffs remained the same.
The current retained tariffs are still very high, and they will inevitably leave traces in the economy, such as stagflation effects such as price increases and economic slowdown. In this way, the temporary easing is actually still on the surface and has not really solved the fundamental differences that led to the dispute. The most important thing is that the US trade deficit with China still exists. It is impossible to reshape the sweater relationship between the two sides in the short term. Any disturbance during this period will directly affect the attitude of safe-haven funds.
Especially the CPI data released by the US market tonight, the expected value of the unadjusted CPI annual rate in April is the same as the previous value of 2.4%, and the monthly rate is relatively high.
At this time, there is a basic problem. April has entered the battle of tariffs. Throughout April, the market has regarded gold as a lifeline. For example, when you see that daily necessities are about to be taxed and raised in price, what will you do?
Right, so if nothing unexpected happens, inflation caused by tariffs will rise. The good thing is that in terms of energy in April, the price of crude oil is straight down, so it offsets part of inflation. In principle, the impact of this announcement should be small. As for the core data, I personally think that it will rise compared with the previous value, that is, no matter how it is collected, there will be a limited situation of favorable factors.
After the midday trading, gold once probed upward and has tested the resistance level of 3260. I just calculated gold. It is originally adjusted by fundamentals, so it is still treated as an adjustment, that is, rebound and open short, or break and follow up.
Secondly, draw a channel according to the four-hour chart, and combine it with Fibonacci. Pay attention to 77-91 in the middle track of the Bollinger Band. If a reversal signal appears in this range, you can consider entering the market based on the signal to see a decline. At that time, you need to pay attention to 3219 and 3207 below. If the integer level is broken, you can also consider further lowering the gold target to the range of 3160±10.
Hello traders, if you have better ideas and suggestions, welcome to leave a message below, I will be very happy

XAU/USD 13 May 2025 Intraday AnalysisH4 Analysis:
-> Swing: Bullish.
-> Internal: Bullish.
Analysis and bias remains the same as analysis dated 23 April 2025
Price has now printed a bearish CHoCH according to my analysis yesterday.
Price is now trading within an established internal range.
Intraday Expectation:
Price to trade down to either discount of internal 50% EQ, or H4 demand zone before targeting weak internal high priced at 3,500.200.
Note:
The Federal Reserve’s sustained dovish stance, coupled with ongoing geopolitical uncertainties, is likely to prolong heightened volatility in the gold market. Given this elevated risk environment, traders should exercise caution and recalibrate risk management strategies to navigate potential price fluctuations effectively.
Additionally, gold pricing remains sensitive to broader macroeconomic developments, including policy decisions under President Trump. Shifts in geopolitical strategy and economic directives could further amplify uncertainty, contributing to market repricing dynamics.
H4 Chart:
M15 Analysis:
-> Swing: Bullish.
-> Internal: Bullish.
Analysis and bias remains remains the same as analysis dated 07 May 2025.
As mentioned in yesterday's analysis that I would continue to monitor price and depth of bearish pullback following previous bullish iBOS.
Price did not pull back with any significance, therefore, I will apply discretion and not mark the previous iBOS. I have however marked this in red.
Price continued bullish and subsequently printed a bearish iBOS to indicate, but not confirm bearish pullback phase initiation.
Price is now trading within an established internal range, however, I will continue to monitor depth of pullback.
Intraday Expectation:
Price to trade down to either discount of internal 50% EQ, or M15 supply zones before targeting weak internal high priced at 3,435.055
Note:
With the Federal Reserve maintaining a dovish stance and ongoing geopolitical tensions, volatility in Gold prices is expected to remain elevated. Traders should exercise caution, adjust risk management strategies, and stay prepared for potential price whipsaws in this high-volatility environment.
Trump's tariff announcement will most likely cause considerably increased volatility and whipsaws.
M15 Chart:

CPI-Inflation Assessment, Gold Accumulation
📌 Drivers
In geopolitics, Indian Prime Minister Narendra Modi said on Monday that military action against Pakistan was only paused, warning that future actions would depend on Islamabad's position. Meanwhile, Ukrainian President Volodymyr Zelensky expressed his willingness to meet with Russian President Vladimir Putin later this week after U.S. President Donald Trump called on Zelensky to "immediately" accept an invitation to a peace summit in Turkey. These developments have heightened geopolitical risks, which could boost demand for safe-haven assets such as gold, thereby enhancing the appeal of gold amid continued global uncertainty.
📊Comment Analysis
CPI evaluates the inflation level of the US economy, and the price of gold continues to strive to maintain a price range of around 3200
💰Strategy Package
🔥Selling gold area: 3281-3283 SL 3288
TP1: $3270
TP2: $3260
TP3: $3250🔥
Buying gold area: $3176 - $3174 SL $3169
TP1: $3185
TP2: $3198
TP3: $3210⭐️
Labaron believes
Guaranteeing the principal is the bottom line for survival, controlling risks is the armor for survival, earning profits is a stage medal, and long-term stable and continuous profits are the only proof that can finally stand up from the sea of corpses and blood.

Shorts were active at the beginning of this week, and prices fel
📌 Gold driving factors
The joint statement of the Sino-US Geneva economic and trade talks has just been released. This development has hit the safe-haven demand for gold and has become the fuse for a new round of gold selling.
Coupled with the hawkish "holding back" of the Federal Reserve, the dollar has remained stable near its multi-week high and put pressure on gold. The trend of gold prices seems quite fragile.
📊Commentary analysis
The next resistance for gold prices is the static barrier of $3360-3365/ounce. If it can be decisively overcome, it will eliminate the recent bearish tendency and lay the foundation for gold prices to regain the $3400/ounce mark.
💰Strategy Package
⭐️Set Gold Price:
🔥Sell Gold Zone: 3315-3317 SL 3322
TP1: $3300
TP2: $3290
TP3: $3280
🔥Buy Gold Zone: $3223 - $3225 SL $3218
TP1: $3238
TP2: $3245
TP3: $3260
⭐️ Note: Labaron hopes that traders can properly manage their funds
- Choose the number of lots that matches your funds
- Profit is 4-7% of the fund account
- Stop loss is 1-3% of the fund account

Is GOLD still rising star? XAUUSD AnalysisHello everyone!
i Want share my idea about gold price action.
End of April we had some correction but beginning of May it still has buyer and why? at global market we see still misunderstanding, America and China still talk about rates, final talk will be soon between that to giant country, Russia-Ukraine war plus we have very hard situation between India and Pakistan, everyone was expecting peace, after trump inauguration, but how we see we are still far, no one knows what will be next and for big investors gold is safest place to invest money. If we look at gold for long term we can see it has pretty strong bull run.
For me i have other view - China and America will deal about rates, which will give market better view, i think before it will happen, Gold will test new High, where it will find sellers and from there we will have 2 quarter Bearish trend. New high will be between 3500 - 3550, also if we look at Dollar index (DXY) at 1D chart it found buyers and slowly showing reversal, but don't forget 1W chart because there we had 1W consolidation from 2023 and the last fall was stronger than other falls, at technical it tested weekly Fair Value Gap, but i cant see any reason yet for fall.
I think Gold will show us new high which will be between 3500 - 3550 and then we will get bearish trend and we will see correlation with dollar and dollar will start bullish trend.
With technical i will use simple technic, gold tested today daily fair value gap and it got strong reaction, we have resistance + 2h FVG but for me it will be not hard for gold to brake it.
This analysis is from my experience, i am not financial advisor.
FOR COLLABORATION TEXT ME !
ALWAYS MAKE YOUR OWN RESEARCH !

Gold prices face substantial short-term suppression
📌 Bearish drivers
Gold prices (XAU/USD) rebounded from a multi-day low in early Asian trading, and are now at the psychological level of $3,300. Ongoing geopolitical uncertainties, including the Russia-Ukraine conflict, heightened tensions in the Middle East, and renewed frictions on the India-Pakistan border continue to support gold prices. Even so, improved risk sentiment appears to have limited gold's upside due to renewed optimism around the US-UK trade agreement and the launch of US-China tariff negotiations over the weekend.
📊Commentary and analysis
As tariff trade negotiations become more active, gold prices are facing huge selling pressure. Gold prices may return to the 3233 price range and continue to rise.
💰Strategy Package
🔥Sell Gold Zone: 3351-3353 SL 3358
TP1: $3340
TP2: $3330
TP3: $3320
🔥Buy Gold Zone: $3232 - $3234 SL $3227
TP1: $3245
TP2: $3260
TP3: $3270
⭐️ Note: Labaron hopes that traders can properly manage their funds
- Choose the number of lots that matches your funds
- Profit is 4-7% of the fund account
- Stop loss is 1-3% of the fund account

Gold prices remain volatile, where is the profit range?
💢 Driving factors
Gold prices plunged nearly 2% yesterday, mainly due to the strengthening of the US dollar and the optimism brought about by the upcoming trade talks between the United States and China. The Federal Reserve kept interest rates unchanged on Wednesday, but pointed out that the risks of rising inflation and unemployment increased, which further clouded the economic outlook as the Fed struggled to assess the impact of Trump's tariff policy. When the US dollar strengthens, it means that gold is relatively expensive for buyers holding foreign currencies. But despite the decline in gold prices, it is still supported by global geopolitical risks and central bank buying.
📊 Commentary Analysis
Gold basically fluctuated in the 3400-3360 range today, which is a typical fluctuation. But for high-level fluctuations, we must worry about the breakthrough after the platform is sorted out, and we must also worry about the stagflation retracement, which depends on the time cycle. Therefore, the current trend, people who like fluctuations feel very good, and those who look at one-sidedness feel uncomfortable. Today's early trading operations are still temporarily carried out in the 3400-3360 range, and new layouts will be made after the break!
💰Strategy Package
The Asian session is expected to remain volatile, and both long and short positions have opportunities. You only need to operate at the right time. Go long when the short-term retracement reaches 3370 support, and go short when the upper resistance reaches 3410.
⭐️ Note: Labaron hopes that traders can properly manage their funds
- Choose the number of lots that matches your funds
- Profit is 4-7% of the fund account
- Stop loss is 1-3% of the fund account

Are gold bulls regaining control of the market?
📌 Driving factors
The latest news from the Chinese Ministry of Foreign Affairs on Wednesday showed that Chinese Vice Premier He Lifeng will visit Switzerland from May 9 to 12. During this period, he will serve as the Chinese leader of Sino-US economic and trade and hold talks with the US leader, US Treasury Secretary Benson.
Beijing said that on the basis of fully considering global expectations, Chinese interests, and the calls of the US industry and consumers, China decided to agree to engage with the US. Any dialogue and negotiation must be carried out under the premise of mutual respect, equal consultation, and mutual benefit. If the United States attempts to continue to coerce and blackmail under the guise of talks, China "will never agree."
The market is paying attention to the policy decision announced by the Federal Reserve on Wednesday. It is expected that the Fed will keep interest rates unchanged at the meeting, but this meeting may be the last meeting with such a clear result.
Federal Reserve Chairman Powell is unlikely to provide clear guidance on how the Fed plans to respond to U.S. tariffs. Macquarie analysts led by Thierry Wizman wrote in an investor report, "If traders naively believe that the Fed will save the world and use obvious "dovish" signals to alleviate the recent increase in policy and political uncertainty, then they should think again."
In addition, investors also need to pay attention to the impact of news related to the geopolitical situation. This week, Israel and the Houthi armed forces "fought hard", which also provided safe-haven buying support for gold prices. There have also been some conflicts between India and Pakistan, which investors need to pay attention to.
📊Comment Analysis
Gold price awaits today's interest rate result, rebounded well above 3400 but then fell immediately, indicating that the market is not ready for the first rate cut, and if there is, gold price may face strong selling pressure today
💰Strategy Package
Long position:
Actively participate near 3365 points, profit target is around 3420 points
⭐️ Note: Labaron hopes that traders can properly manage their funds
- Choose the number of lots that matches your funds
- Profit is 4-7% of the fund account
- Stop loss is 1-3% of the fund account

Gold could reach 3420 today
📌 Gold Drivers
Gold prices (XAU/USD) retreated slightly from intraday highs near two-week highs hit during the Asian session on Tuesday, but still held steady near $3,360, extending gains for a second day in a row. Improved U.S. economic data helped ease market concerns about a recession, providing mild support for the dollar. At the same time, signs that Sino-U.S. trade tensions may ease curbed gold's safe-haven demand, prompting some investors to take a wait-and-see approach ahead of the much-anticipated two-day Federal Open Market Committee (FOMC) policy meeting.
The Trump administration's imposition of tariffs of up to 25% or even 100% on semiconductors will further disrupt the global semiconductor supply chain, forcing many semiconductor manufacturers to look for alternative sources of supply or manufacture in the United States.
📊Comment Analysis
Bulls regained their dominance, and the upward trend approached 3400 before the market expected a rate cut
💰Strategy Set
🔥Sell Gold Area: 3418-3420 SL 3425
TP1: $3410
TP2: $3400
TP3: $3385
🔥Buy Gold Area: $3323 - $3321 SL $3316
TP1: $3330
TP2: $3340
TP3: $3358
⭐️ Note: Labaron hopes that traders can properly manage their funds
- Choose the number of lots that matches your funds
- Profit is 4-7% of the fund account
- Stop loss is 1-3% of the fund account
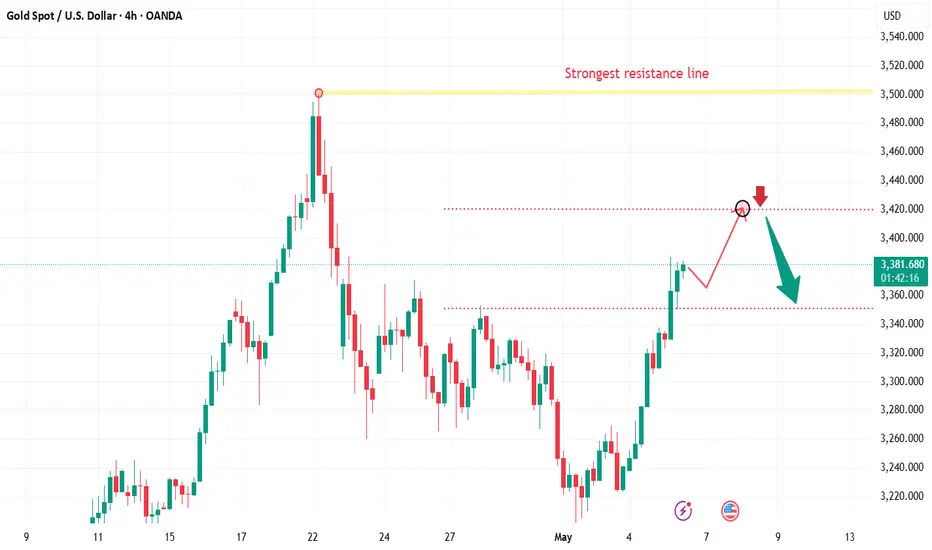
Gold bulls are back in force. What is the operation strategy?The gold price has reached the sideways fluctuation range expected by Quid. This matches my morning prediction.
From the 4-hour trend:
Gold has now broken through the first upward resistance level predicted by Quid, and is currently fluctuating slightly in the 3315-3320 range.
The current upward resistance position is around 3330. The lower support is currently located at 3275-85. If gold does not retreat, then the upward trend may test the position around 3350.
On the contrary, if gold chooses to retreat, traders need to pay attention to the 3275-3285 decline range.
Quid believes that as long as gold retreats and stabilizes in the 3275-3285 range, then a long operation strategy can be carried out at this position.
The current upper high is still at 3350. If the upward resistance level of 3350 is broken later, I expect the price of gold to reach a height of 3380-3420.

GOLD / XAUUSD: Breaking the down channel (correction wave)Therefore, if the 21-day SMA holds in the event of a weak US Non-Farm Payroll (NFP) report, a rebound toward the immediate static support-turned-resistance at 3260 could occur.
A sustained move above that level would encourage Gold buyers to push further toward the former channel support, now acting as resistance, at 3405.

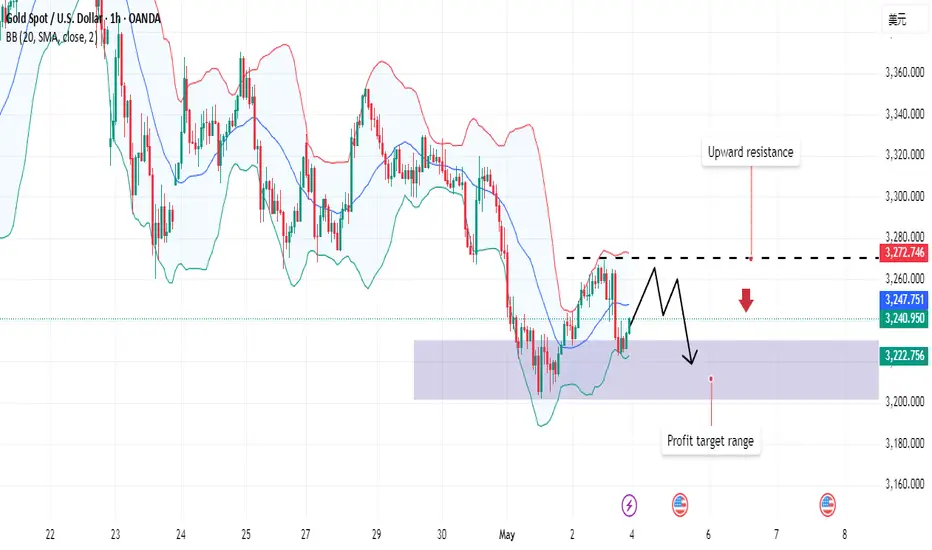
Gold fell as expected. What will happen next week?Gold fell within the range expected by Quid. Although it rebounded slightly, the final result did not change. Will the direction of gold change next week?
Quid's analysis:
Gold's 1-hour moving average is downward, and there is a trend of continuous downward development; gold is currently under pressure from the 3270 line, so 3270 will still be the key turning point for gold bears next week. Although gold has rebounded slightly, the magnitude of the decline is not large; if the upward resistance level of 3270 fails to break through next week, it may be in a sideways fluctuation.
The downward trend will not reverse for the time being, unless major news is released on the weekend, which directly affects the gold market.
Quid believes that the ups and downs of the market are normal. Gold has fallen by about $300 from its high point, and the overall trend in the near future is still downward; it continues to fall after a small rebound, which means that the strength of gold bears is still there.
Quide believes that it is always easy to follow its trend; violating its rules always makes oneself exhausted; the market is always right, and standing on the opposite side of the market will always be taught a lesson by the market. In the face of the overall trend, traders should not be lucky, and the market will not forgive your mistakes again and again.
Operation strategy:
Short around 3270, stop loss at 3280, take profit around 3220;
As expected, gold prices continue to fall
📌 Gold driving factors
There are two aspects to look at the impact of April non-agricultural data on the gold market.
One is the data itself and the existing economic environment, and the other is combined with the technical aspect.
The market itself is troubled by the tariff issue. Whether it is the US stock market or the US dollar, they all need good economic data to boost. Once the April non-agricultural performance is poor, the market sell-off will be out of control, and it also means that the risk of US economic recession will increase.
Secondly, good data performance reduces the Fed's expectations for rate cuts. As we all know, the Fed's expectations for rate cuts or implementation of rate cuts are theoretically good for gold prices, and vice versa.
The cooling of the tariff issue may come soon, which is also not conducive to the rise in gold prices, but cooling does not mean the end, and the final achievement will definitely take some time.
📊Comment Analysis
Recently, we have been very good at controlling the gold market. Keeping an eye on the changes in fundamental news is the focus of research and judgment. Of course, the technical direction is also of reference value. The next market will revolve around fundamental news, especially in the context of tariffs.
The non-agricultural data exceeded expectations, and the tariff issue may see "dawn". If it can be confirmed in the near future, the risk aversion sentiment will subside in the short term, which is not conducive to the rise of gold prices. There is a high probability that there is room for retracement, so there is no rush to chase now.
💰Strategy Package
Operation ideas for next week:
Gold 3265 short, stop loss 3275, target 3230-3220;.
⭐️ Note: Labaron hopes that traders can properly manage their funds
- Choose the number of lots that matches your funds
- Profit is 4-7% of the capital account
- Stop loss is 1-3% of the capital account

Non-farm data is released, and gold is still going to fall.
📌 Gold information
Today, the market will usher in the heavy non-farm data for April. From the expected value, there are only 130,000 people, far lower than the expected 228,000 people, and the unemployment rate remains at 4.2%.
If we refer to the unsatisfactory ADP data in April, then the number of non-farm people in April should have declined, or it is lower than expected, but the ADP data cannot fully correspond to the final non-farm data. This is the answer given to us by too many experiences in the past, so it cannot be concluded that the non-farm data this time will be lower than expected.
📊Comment analysis
Combined with the technical aspect, the strong technical pressure above the international gold price is around 3280, and then the 3300 mark. Even if it rebounds next, the pressure of the above two prices cannot be broken, and there is still a probability of a pullback adjustment. The initial support below is 3230, and after breaking through the position, it will follow the trend to explore 3205.
💰Strategy Package
If today's non-agricultural data cannot provide strong support for gold prices, the rise in gold prices in the short term will be difficult to sustain. The specific decision can only be made after the final release of the afternoon data and the guidance on prices. The trend fluctuations tonight will be very intense. Remember to strictly control your positions to prevent risks.
⭐️ Note: Labaron hopes that traders can properly manage their funds
- Choose the number of lots that matches your funds
- Profit is 4-7% of the fund account
- Stop loss is 1-3% of the fund account

NF shows a volatile downward trend
📌 Gold Information
China's Ministry of Commerce announced on Friday that the United States has recently initiated communication through official channels, expressing interest in restarting tariff negotiations. Beijing is currently evaluating the proposal, which has sparked optimism that a solution to the long-standing tariff deadlock between the world's two largest economies is imminent.
New hopes for a breakthrough in trade negotiations helped the dollar rise to a three-week high on Thursday, pushing gold prices down towards the $3,200 mark. However, the dollar's bullish momentum remains weakened as the market increasingly digests expectations that the Federal Reserve may cut interest rates further, especially with the closely watched US non-farm payrolls data about to be released.
📊Comment Analysis
NF news volatility is certain, having accumulated significantly since last week. Gold price confirmed the trend after breaking through 3267, and fluctuated downward below 3200
💰Strategy Package
TP1: $3290
TP2: $3280
TP3: $3270🔥
Buy gold area: $3175 - $3177 SL $3170
TP1: $3185
TP2: $3200
TP3: $3210⭐️
⭐️ Note: Labaron hopes that traders can properly manage their funds
- Choose the number of lots that matches your funds
- Profit is 4-7% of the fund account
- Stop loss is 1-3% of the fund account

Technical analysis of short-term gold operations!!!On Wednesday, the gold price generally showed a downward trend. The highest price rose to 3327.91 on the day, and the lowest price fell to 3266.79, closing at 3288.16. In view of the fact that gold fell under pressure during the early trading on Wednesday and broke through the four-hour and daily support as expected, and then the US market rebounded again and came under pressure, and finally ended in a big negative state at the daily level. The price has fallen below the daily support, so we need to pay attention to the continuation of the band decline in the future.
From a multi-cycle analysis, first observe the monthly rhythm. The price rose for three months in the early stage and then a single-month correction appeared. Recently, it has risen for four months and then a single-month correction appeared. Therefore, according to the rhythm, four consecutive positives have appeared. For May, we must pay attention to market risks. From the weekly level, the gold price is supported by the support level of the 3040 area. From the perspective of the medium-term, we can continue to maintain a bullish view, and the price drop is only a correction in the medium-term rise. From the daily level, the current price resistance is in the 3007 area, which is the key watershed of the band trend. If the price is below this position, the subsequent band will be treated as short. At the same time, for the short-term four-hour price resistance, it is around 3290, so the subsequent price will be treated as short under the four-hour resistance. In general, the price can be treated as short under the four-hour resistance and the daily resistance.

Gold 3213 and 3272 are space switching points
📌 Gold information
The US non-farm payrolls report released this Friday (May 3) will become a market vane. If the employment data deteriorates significantly (such as the sharp drop in private employment growth shown by ADP), it may strengthen the expectation of interest rate cuts and promote the rebound of gold; on the contrary, if the data is stable, the US dollar may further suppress the price of gold.
The intraday decline in gold prices seems to be partly driven by technical selling pressure, after gold prices decisively fell below the key support level of $3,265-3,260. However, due to the unexpected contraction of US GDP and the intensification of signs of slowing inflation, the market's expectations for further interest rate cuts by the Federal Reserve (Fed) have increased, and the US dollar (USD) has found it difficult to maintain any significant rebound.
📊Comment Analysis
Gold price rose strongly by $544 in April. It entered the mode of space sweeping and adjustment from the confirmation of 3500. The next move is to sweep the range of the large range, starting at at least $40, and the range is $100, sweeping back and forth
💰Strategy Package
🔥Sell gold area: 3270-3272 SL 3277
TP1: $3260
TP2: $3250
TP3: $3240
🔥Buy gold area: $3178 - $3176 SL $3171
TP1: $3185
TP2: $3200
TP3: $3210
⭐️ Note: Labaron hopes that traders can properly manage their funds
- Choose the number of lots that matches your funds
- Profit is 4-7% of the fund account
- Stop loss is 1-3% of the fund account

Gold is forming a head and shoulders pattern!Analysis and interpretation:
Gold prices have been on a strong upward trend since the beginning of 2025. The daily chart shows that gold prices have climbed from around $2,600 to around the $3,500 mark. Recently, gold prices have formed a consolidation trend in the range of $3,260 to $3,380, indicating that the bulls and bears are fighting fiercely here. It can be seen from the K-line chart that gold prices fell back after hitting a record high of $3,499.83 in April, but then gained support and rebounded at $3,260.
The Bollinger Band indicator shows that the upper track is at $3,465.75, the middle track is at $3,191.92, and the lower track is $2,918.08. The current price is running between the upper and middle tracks, indicating that the medium-term upward trend is still maintained. Although the gold price may fluctuate in the range of $3,260 to $3,380 in the short term, the overall upward trend has not changed.
The MACD indicator shows that DIFF is 81.35, DEA is 84.74, and the MACD value is -6.80. The histogram shows a shrinking state, indicating that the upward momentum has weakened, but no obvious short signal has been formed. The RSI indicator is around 58.81, which is in the neutral to strong area, and has not reached the overbought or oversold level, and there is still room for growth.

XAU/USD(20250430) Today's AnalysisMarket news:
The European Central Bank expects prices to rise 2.9% over the next 12 months, up from 2.6% in February, according to a monthly survey released on Tuesday. This is the highest level since April 2024. The three-year indicator rose slightly to 2.5%. The ECB's first five-year forecast was 2.1%.
Technical analysis:
Today's buying and selling boundaries:
3321
Support and resistance levels
3370
3352
3340
3303
3291
3273
Trading strategy:
If the price breaks through 3321, consider buying, the first target price is 3340
If the price breaks through 3303, consider selling, the first target price is 3291

Gold falls as expected, awaiting guidance from ADPGold continued to fluctuate in 1 hour. Now, the gold fluctuation is most likely a relay of decline. Gold rebounds and continues to be short. The gold 1-hour moving average gradually begins to stick together, but it is still diverging downward. If it continues to cross downward to form a dead cross, then there is still room for gold shorts to fall. Gold hit a high twice and was suppressed by the 3330 line. Today, gold continued to be short at highs under the pressure of 3330.
Gold bulls continue to rebound every time. Now gold bulls obviously have no confidence in further rise, so gold shorts take the opportunity to exert their strength. Gold is still the home of shorts, and gold rebounds and continues to be short.
US trading operation ideas:
Gold 3320 short, stop loss 3330, target 3300-3290;

Gold fluctuates and is bearish, waiting for NF
📌 Policy factors
Gold prices (XAU/USD) continued to fall, falling to $3,310 in the current European session on Wednesday, as signs of improved global risk sentiment and easing trade tensions curbed demand for safe-haven assets. Market participants remained cautious ahead of the release of major US economic data, including ADP employment changes, core PCE price index and first quarter GDP preliminary values, all of which are scheduled to be released later today.
It is reported that President Trump suddenly signed an executive order to provide automakers with up to 15% tariff rebates to ease the impact of his auto tariff policy. Even more unexpectedly, US Commerce Secretary Lutnick revealed that a trade agreement had been reached secretly with a certain country. These major changes immediately triggered a strong market reaction.
📊Comment Analysis
Gold price maintains the accumulation range of 3265-3360, temporarily stable and waiting for large fluctuations
💰Strategy Package
🔥Sell gold area: 3368-3370 SL 3375
TP1: $3350
TP2: $3340
TP3: $3330
🔥Buy gold area: $3264-$3262 SL $3257
TP1: $3280
TP2: $3300
TP3: $3318
🔥Buy gold area: $3285-$3283 SL $3280 scalping
TP1: $3290
TP2: $3295
TP3: $3300
⭐️ Note: Labaron hopes that traders can properly manage their funds
- Choose the number of lots that matches your funds
- Profit is 4-7% of the capital account
- Stop loss is 1-3% of the capital account

Gold maintains a volatile range, pay attention to subsequent breOn Tuesday, the gold price generally showed a downward trend. The highest price rose to 3348.45 on the day, and the lowest price fell to 3299.49, closing at 3316.95. On Tuesday, gold was under pressure during the early trading session, and then the price continued to fluctuate during the European and US trading sessions. Overall, the price is still running within the fluctuation range, but once the daily support is broken, it is expected to break the lower edge of the range.
From the multi-cycle analysis, first observe the monthly rhythm. The price rose for three months before and then a single-month correction occurred. Recently, it has risen for four months and then a single-month correction occurred. Therefore, according to the rhythm, April is generally bullish, but for May, we must pay attention to market risks. From the weekly level, the gold price is supported by the support level of the 3040 area. So from the perspective of the mid-line, we can continue to maintain a bullish view. From the daily level, the current price is supported by the 3004 area support. This position is the key watershed of the band trend. The market will further break down in the future, so it will be focused on in the future. At the same time, for the short-term four-hour price, it has been fluctuating up and down at the four-hour key position recently. Pay attention to the resistance of 3387 and 3370 on the top, and the 3260 area on the bottom. Before the data, the market as a whole tends to fluctuate temporarily. After breaking through the daily support, pay attention to the performance of breaking down the lower edge of the range.
