Only by understanding the trend can you be firmly bullish.The market is changing rapidly, and going with the flow is the best way to go. When the trend comes, just go for it. Don't buy at the bottom against the trend, so as not to suffer. Remember not to act on impulse when trading. The market is good at dealing with all kinds of dissatisfaction, so you must not hold on to orders. I believe many people have experienced this. The more you resist, the more panic you will feel, and the floating losses will continue to magnify. You will not be able to eat or sleep well, and you will miss many opportunities in vain. If you also have these troubles, then you might as well follow Tian Haoyang's rhythm and try to see if it can make you suddenly enlightened. If you need help, I will always be here, but if you don't even extend your hand, how can I help you?
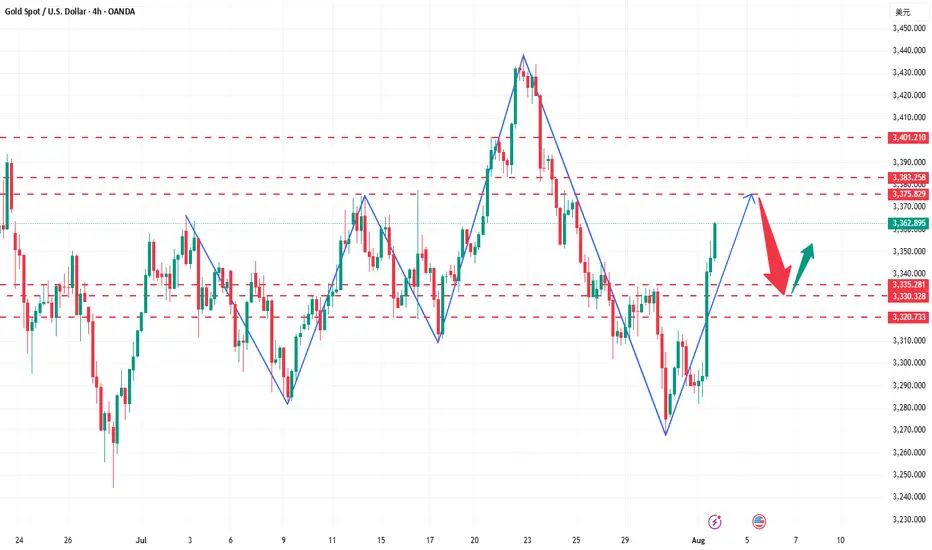
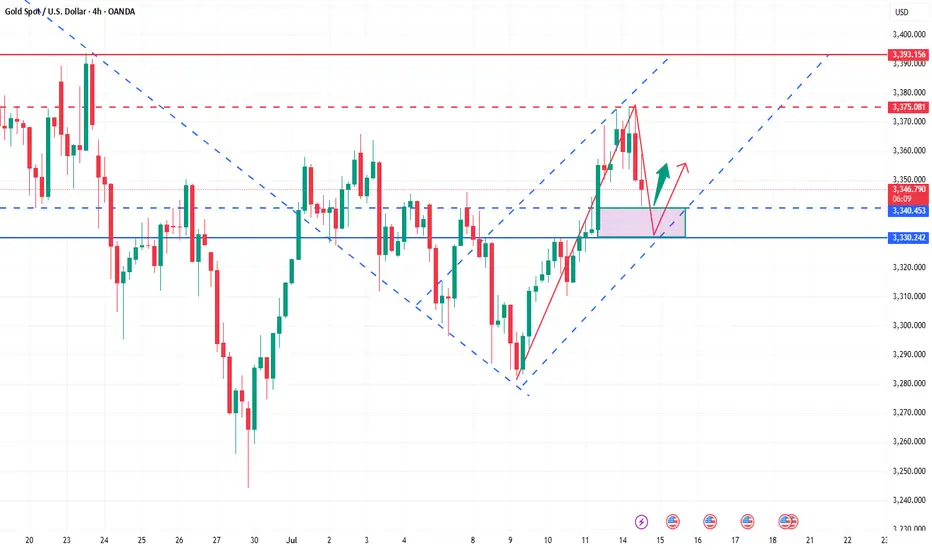
Gold rose unilaterally after the positive non-farm payrolls on Friday, hitting a new high this week. This week's K-line closed in a hammer shape, and the gold hourly line has a double bottom structure. However, gold should not have such a big retracement for the time being. The 3335-3330 line below is also an important support. So gold will mainly be bought on dips above 3335-3330 next week. Technically, there is still room for growth next week. The bulls continued to attack at the end of Friday and closed at 3363. Next week, we will continue to pay attention to the short-term suppression at the 3370-3375 line above. In terms of operations, we will continue to maintain retracement and buy. If your current operation is not ideal, I hope I can help you avoid detours in your investment. Welcome to communicate and exchange. Judging from the current gold trend, the short-term resistance above next week will be around 3370-3375, with a focus on the important pressure line of 3395-3400. Keep buying on pullbacks, and try to maintain a stable wait-and-see position in the middle. I will prompt the specific operation strategy at the bottom, so please pay attention in time.
Gold operation strategy: Go long on gold when it retraces to around 3340-3330, target 3370-3375, and continue to hold if it breaks through.
Goldman_analysis

The trend is clear, why do I choose to be firmly bullish on goldGold Trend Analysis: Yesterday, the gold market demonstrated strong upward momentum, opening near 3290 before falling slightly to a low of 3281 before fluctuating upward. Boosted by the non-farm payroll data, the gold market surged during the US trading session, reaching a single-day gain of 2.02%, reaching a high of 3363 and closing there. The daily chart formed a long bullish candlestick with a long lower shadow, forming a Morning Star pattern, reinforcing the bullish trend. From the perspective of the cycle structure, the daily level is clearly in the 5-wave upward stage, and the upward trend of the large cycle has not changed. At the indicator level, the daily MACD momentum column (the column below the zero axis) represents the short-selling momentum. Its "gradual shortening" means that the short-selling force is weakening and the downward momentum is gradually fading. It is a potential signal of stopping the decline or rebounding. KDJ is about to form a golden cross between 20-50, which is a signal that short-term bullish power is beginning to increase, and the overall trend is bullish.
The 4-hour level shows typical bullish characteristics: the moving average system is arranged in a bullish pattern, but there is a certain deviation between the short-term price and the moving average. The technical side needs to correct the deviation rate through a callback before continuing to rise. The short-term support below is focused on the line near 3330-3335. This position is both the relay support level in the previous rise and the intersection of the 4-hour moving averages MA10 and MA20, which has strong support strength; the short-term resistance above is focused on the line near 3370-3383. This area is a pressure-intensive area near the previous high point. If it can be effectively broken through, it will further open up upward space. A successful breakout would open up further upside potential. A breakout would further open up the 3400 mark.
For gold trading, the short-term strategy is to buy on dips. If the price pulls back to the 3330-3335 support level, consider entering a long position with a target of 3355-3365. If it reaches 3370-3380, consider a short-term short position with a target of 3350-3340.
How to seize deterministic trading opportunities?The rebound momentum of the gold market has been significantly enhanced today. After breaking through the 3345 resistance in the Asian session, it has continued to rise. It has now reached around 3360, and has rebounded by more than US$50 from this week's low of 3310, setting a new rebound high in the past three trading days. After the gold price effectively broke through the key resistance band of 3340–3350, it triggered some short stop loss trading and trend funds to enter the market, driving the price to accelerate the upward trend. Judging from the hourly chart, the trading volume has increased by about 30% compared with the same period yesterday, indicating that the market's recognition of this round of rebound has increased significantly.
A physically full sun candle chart has been closed in the 4-hour cycle, successfully standing on the Bollinger middle track, further confirming the upward structure, the mid-track support area 3340–3345 has become a key position for bulls' defense, and the short-term structure of the market is still relatively strong. Overall, the intraday retracement range of gold is limited, and the probability of continuing to rise is relatively high. In terms of strategy, it is still recommended to go long. In the short term, focus on the 3340–3345 area retracement support, and the stop-profit target is 3365–3370; if the upward breakthrough, pay attention to the suppression performance of the 3370–3375 line, beware of highs and falls, and pay attention to controlling risks.
Gold bearishness once again in line with expectationsThe data released so far show that the US inflation data is stable and tends to decline, which increases the possibility of the Fed's monetary policy. The US dollar index fell first and then rose. Gold opened at around 3344 and rebounded all the way. The current highest rebound is around 3366. It fell back to 3352 before the data was released, and then quickly rebounded to 3360. After the data was released, it fell again quickly, and the current lowest touched around 3346. The short orders around 3360-3365 that we shared with brothers before were basically the highest short orders of the day, and we successfully completed our first goal. The brothers who participated in it all made good profits. Judging from the current trend of gold, we continue to participate in short orders during the rebound, and the long position is still around 3335-3330. After the release of the CPI data, it is bearish overall. The core is that it is lower than market expectations but higher than the previous value. Inflation has heated up again, which has once again suppressed the expectation of interest rate cuts. After this data, it also laid a good foundation for the decline in the market. If the price goes up again, it will still rely on the 3365 level to go short again. The data is obviously bearish, and it scared a lot of long positions before it was released.
Gold reference ideas:
Continue to short when it rebounds to around 3358-3365, with a target around 3350-3340;
Go long when it falls back to around 3335-3330, with a target around 3350.
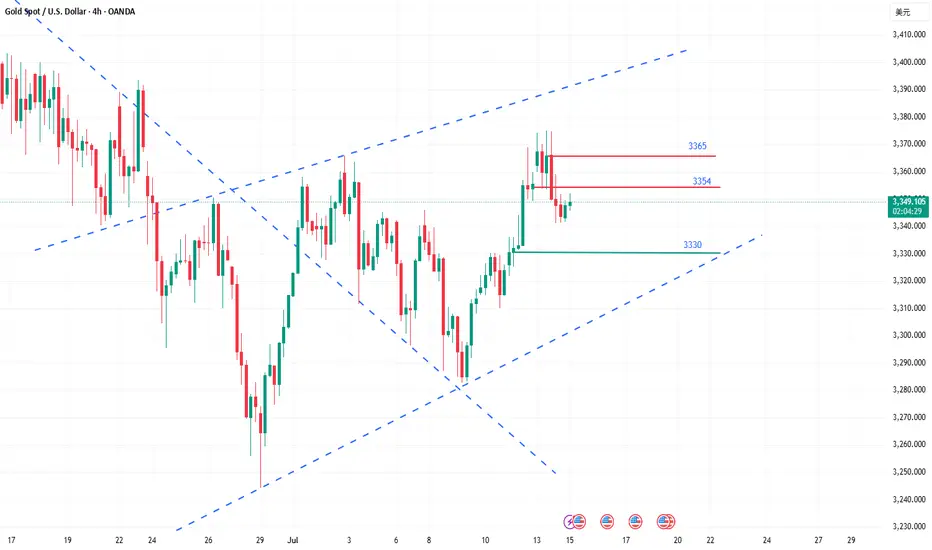
How to grasp the key trading points of gold?Yesterday, gold tested the 3375 line several times but failed to break through effectively. The selling pressure on the market was obvious, and the price immediately fell back, reaching a low of around 3341. The daily line closed with a long upper shadow, indicating that the bullish momentum has weakened and the short-term market has entered an adjustment phase. From the perspective of the 4-hour cycle, the continuous negative trend has led to the gradual closing of the Bollinger Bands, and the middle track position has temporarily gained support, but the overall market is volatile and weak. Today, we will focus on the 3354 watershed. If the rebound fails to effectively stand at this position, the pressure on the upper side will still be strong, and there is a risk of a short-term decline.
Key technical positions: upper resistance: 3365, 3354, lower support: 3340, 3330. In terms of operation rhythm, it is recommended to deal with it with a high-selling and low-buying, oscillating approach, and maintain flexible adjustments.
The operation suggestions are as follows: You can choose to short in the 3360-3365 area, with the target around 3350 and 3340; if the rebound is blocked below 3354, you can also enter the short order in advance. It is recommended to enter and exit quickly in the short-term weak market; strictly control the stop loss to avoid risks caused by sudden changes in the market.
The current market is obviously volatile, so don't blindly chase the rise and fall. It is particularly important to operate around the key pressure and support areas. The grasp of the rhythm will determine the final profit, and steady trading is the kingly way.
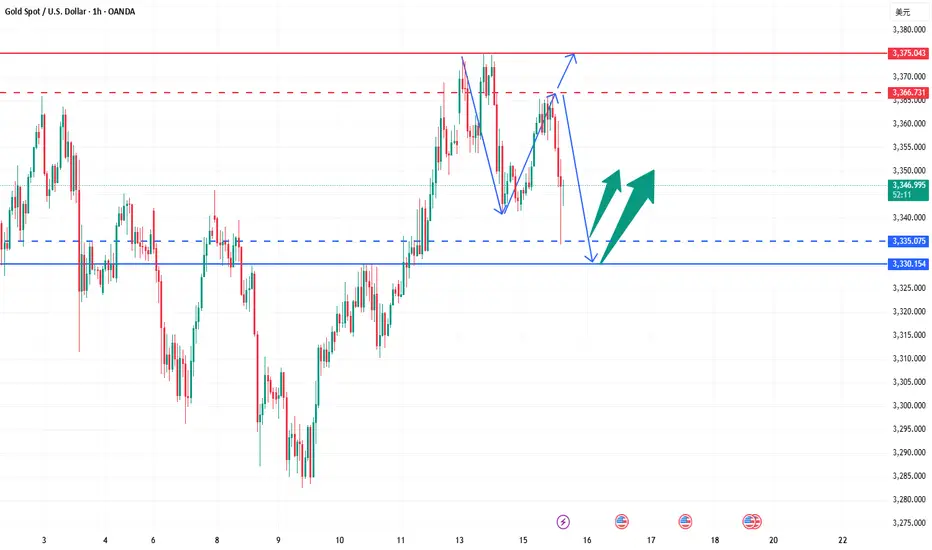
Two lines of defense for bulls: 3340 and 3330 are the key!Gold maintains a strong pattern in the short term, and it is recommended to mainly buy on dips. The short-term support below focuses on the neckline of the hourly line at 3340 last Friday. The more critical support is locked at the 3330 line. This range is an important watershed for judging the continuation of short-term bullish momentum. As long as the daily level can remain stable above the 3330 mark, the overall trend will remain upward. Before falling below this position, we should adhere to the idea of buying low and buying low, and rely on key support levels to arrange long orders. At present, the price has completed a technical breakthrough and broke through the upper edge of the 3330 convergence triangle under the dual positive factors of Trump's tariff landing to stimulate risk aversion and the support of the Fed's interest rate cut expectations, and formed three consecutive positive daily lines. It is necessary to pay attention to the short-term pressure at the 3375 line. The overall operation strategy will be combined with the real-time trend prompts during the trading session, and pay attention to the bottom in time.
Where will gold prices go at the weekly close?The mentality of trading is very important. At the same time, you must have clear ideas and decisive actions. Gold has been in a state of rapid growth. Many people are easily led to big losses by a small mistake. If you are worried about the loss at this time, you can choose to observe our daily operations in the group. The operations in the group are reasonable and well-founded, with real-time current price orders, and the returns are also considerable. Everyone is welcome to come and verify.
Gold risk aversion has driven gold to strengthen. The current bullish trend of gold is strong. The decline during the US trading session is still dominated by long positions. Technically, the 1-hour moving average forms a golden cross upward, indicating sufficient bullish momentum. After the gold price breaks through, it is confirmed that the support level of 3330 is effective, and the short-term support structure has been formed. It is recommended to wait for the second opportunity for the gold price to step back! Although the 1-hour chart shows that the current trend remains strong and the step-back amplitude is small, it is necessary to maintain a cautious attitude-even if the market is strong, it is not recommended to chase more, and it is necessary to guard against the risk of a deep correction in the gold price. In terms of operation, it is reminded that you can focus on the support level below: the first support level is 3345 (bull-bear watershed). If it falls below, pay attention to the key support of 3330. If the gold price falls back to around 3345 and stabilizes, you can consider a light position to try more.

Gold has a big win this dayNews: In the early Asian session on Thursday (July 10), spot gold fluctuated slightly higher, once regaining the 3320 mark, and is currently trading around $3323/ounce. On Wednesday, gold prices rebounded strongly after hitting a two-week low of 3282.61, closing at $3313.38/ounce, showing strong momentum for recovery. Trump extended the tariff agreement to August 1 and began to collect tariffs again. Although it eased market tensions, his remarks will not be extended after the expiration, and he issued tariff threats, which increased global trade uncertainty and pushed up risk aversion. The market is still facing economic and inflation concerns brought about by tariffs, which will also weaken the dollar and support gold prices.
Analysis of gold trend: After the full-day trend of gold on Wednesday, the lowest price was 3282 and the highest price was 3322, with a range of $40, so the bullish strength has come out. However, Li Siyu would like to emphasize here that gold is in a bullish trend for the time being, but it is not an absolute unilateral trend, but a fluctuating trend under the bullish trend. There are opportunities both up and down on Thursday. If it rises, you can look at 3345, and if it falls, you can look at 3285. Therefore, before there is an absolute strong unilateral rise, it is recommended that everyone keep looking at this wave of gold fluctuations. However, today's market is more important. Today is Thursday, and Thursday is often the node of the weekly change time. Today is likely to continue the rebound on Wednesday and continue to rise.
From a technical point of view, the daily line closed positive under the rebound of 3282 and stood firmly above the lower Bollinger track. If it continues to close positive on Thursday, it is necessary to pay attention to the suppression of the middle Bollinger track, that is, the high point of 3345. After breaking through, there will be another wave of rise on Friday, and you can see 3365 and 3400. Therefore, today's gains and losses of 3345 are crucial. The strong rebound in the H4 cycle is quite obvious. When it falls, it is very weak and continuous. When it rises, it is very strong and continuous. It depends on whether the continuous positive trend on Thursday will continue. Now the K-line stands firmly on the middle track of Bollinger. If it continues to rise, the high point of the upper track is around 3340-3345. In principle, the continuation of the long position will test the high point of the upper track. Therefore, it is still possible to go long today. Of course, it is not an absolute long trend now, so don't chase the rise. The support below the small cycle is around 3310-3300. If it falls back to this price, you can continue to go long. Clearly define the target. Today, we will see the gains and losses of 3345.

Gold shows signs of slowing down, are the bears ready?This wave of bullish pull-up is a complete rebound. With the help of the timeliness of fundamentals, the highest rebound only reached around 3330 and then began to fall. At this time, many people probably think that the short-term trend has begun to change. I still stick to my bearish thinking. The important target pressure is definitely around 3330. As long as this position is under pressure and falls back to 3280 again, it will be shaky. At present, the stop loss is based on the break of 3335. If it really breaks, it will be similar to the break of 3280. Even if 3340-3345 is short, it is also a short-term bull correction. If the falling channel is broken, I can't convince myself to continue to be short and stick to it. Once 3335 breaks, I can really confirm the reversal of the short-term trend. Then 3280 will also be the bottom of the medium term. In short, since I am shorting near 3320-3330 in the direction of the band and the short-term negative, I think that the stop loss will be given to 3335. The stop profit target is uncertain. The channel has not been broken. Now the short-term long and short conversions are frequent. It is definitely the best choice in my own trading system. No one will win all the time. It is too fake to win all the time. Make your moves according to your own ideas without regrets. If this wave of strategy verification fails, everyone is welcome to supervise. We dare to take responsibility and review every judgment.

The risks of shorting at low levels have been informed!Today, I have reminded you many times not to chase short positions at low levels. Now you can see that gold has bottomed out and rebounded. We also bought gold in batches at 3285-3295, and the long positions also made perfect profits. I believe that friends who follow my articles can see that I have always emphasized not to short at low levels. It is also obvious to everyone that we bought long positions near 3295-3285. In the future, we will continue to pay attention to the suppression of the upper 3318-3325 line. If the rebound does not break, we will look for opportunities to short. I hope everyone can grasp the entry position and hold the profit. The rebound will first look at the previous break point of the 3325 line, and then short when the rebound is suppressed! If your current gold operation is not ideal, I hope I can help you avoid detours in your investment. Welcome to communicate with me!
From the current analysis of gold trend, today's upper short-term resistance focuses on the hourly top and bottom conversion position of 3318-3325. The intraday rebound relies on this position to go short once and look down. The lower short-term support focuses on 3280. The overall support relies on the 3280-3325 area to maintain the main tone of high-altitude low-multiple cycles. In the mid-line position, keep watching and do less, be cautious in chasing orders, and wait for the opportunity to enter the market after the key points are in place.
Gold operation strategy: short gold rebounds near 3318-3325, target 3305-3295.

Gold lures shorts, mainly depending on the rebound.On Monday, the gold market rebounded. The root cause was that Trump sent tariff letters to 14 countries at one time. Even allies such as Japan and South Korea were not spared and were subject to high tariffs of 25% to 40%. This "extreme pressure" trade method instantly ignited the market's risk aversion sentiment. Funds poured into gold, pushing up gold prices. The market quickly saw through the "routine". On Tuesday, Trump extended the tariff deadline from July 9 to August 1. This delay was seen as a signal of "surrendering" under trade pressure, and trade tensions were eased. The safe-haven demand dissipated like a receding tide, and gold was sold off violently, plummeting by $35 in a single day, a drop of more than 1%, and the lowest fell to $3,287.2 per ounce.
On Tuesday, the price of gold showed a trend of rising and falling. It reached a high of 3245 in the morning and then gradually fell. It fell to 3287 and then stopped falling and rebounded. As it failed to break through the key resistance level of 3345 and the price continued to be unable to stand firm on the middle track, the bulls' rebound momentum was insufficient. Yesterday's daily line closed with a large Yin line in the engulfing pattern. This K-line combination indicates that the gold price may continue to fall today. The focus below is on the support strength near the lower track 3280. The upper resistance level needs to pay attention to the 3320-3330 range. Today's daily closing is crucial. If the real big Yin line continues to close, it may drive the Bollinger Band to open downward and further open up the downward space; if the closing can stand above 3330, the short-term downward trend may end and the market is expected to restart the rise. From the weekly perspective, the gold price showed an obvious oscillation pattern this week. After rising on Monday, it fell back on Tuesday. The bulls and bears fought fiercely but failed to gain a decisive advantage. Although the current market is weak, the price is close to the important support area. In terms of operations, it is recommended that under the premise of controlling risks, you can now pay attention to the opportunities to buy on dips in the 3295-3285 area.

After repeated tug-of-war, where will gold go?At present, the gold market is divided between long and short positions. The Federal Reserve may maintain high interest rates, which weakens the investment appeal of gold; however, trade frictions and geopolitical risks provide safe-haven support for gold. Overall, market sentiment is mixed, with bulls lacking confidence, but bears have not been able to fully control the situation. Last week's strong non-farm data reduced market expectations for a rate cut in July, pushing up U.S. bond yields and the dollar, putting pressure on gold, which does not generate interest. In addition, Trump said on social media that he would impose a 10% tariff on countries that "support anti-U.S. policies." The market is waiting for the release of the minutes of the Fed's June meeting, which will more clearly show policymakers' views on the current economic situation and future policies, and may determine the direction of interest rates. If the minutes show that the Fed is inclined to maintain high interest rates for a longer period of time, gold prices may continue to face downward pressure.
From a technical perspective, gold was under pressure at a high level at the opening, so gold is expected to fall today. Today's key pressure level is 3345. Before the price effectively breaks through and stabilizes at 3345, any rebound is a short-selling opportunity; once it stabilizes at 3345, the bottom pattern is confirmed to be established, and the bulls will start an upward market. At this time, the short-selling idea should be abandoned. From a technical point of view, the 1-hour chart has shown a trend from weak to strong, and the Bollinger Bands are opening and diverging upward, indicating that the market may accelerate upward. Today's operation suggestion is to focus on low-long and high-short as a supplement. In terms of specific points, the lower support is 3327-3320, and the upper resistance is 3355-3360.
Operation strategy:
1. It is recommended to buy gold when it rebounds to around 3327-3320, with the target at 3340-3350.
2. It is recommended to sell gold when it rebounds to around 3345-3355, with the target at 3330-3320.

Seize the correction: It’s the right time to short goldThe current rebound is only a technical adjustment rather than a trend reversal. The rebound in the falling market is a good opportunity to arrange short orders. The hourly chart shows that the moving average pressure continues to move down to around 3340-3345. This position also serves as the long-short watershed in the previous intensive trading area, forming a key resistance barrier. If the gold price rebounds and approaches the area below 3345 and a stagflation signal appears or a top structure is formed, it can be regarded as a clear short signal. It is recommended to enter the market to seize the downward space. The current market direction is clear, and the exhaustion of the rebound is the best time to enter the market. Relying on the technical pressure level, the short position can be accurately arranged.

Firmly bearish below 3350 once again verifies the perfect idea!Gold price rose rapidly at the opening, reaching a high of 3342 before falling back. This kind of rapid pull needs special attention, because from the perspective of short-term trading, this is the trend pattern that needs the most vigilance. Looking back at the trend last Thursday, there was also a situation where the high could not be continued. Historical data shows that this kind of pull-up often lacks sustained momentum, and the subsequent upward space is limited. Combined with the recent trend, although the price rebounded on Monday and Tuesday, it basically maintained a volatile pattern in the following trading days, but the fluctuation range changed. Therefore, the market expects the trend to be repeated in stages, and the information of long and short interweaving makes it difficult for the market trend to continue. Today, the short position digested the second time at the opening and currently stepped back to the lowest 3305 line. In terms of operation, we first pay attention to the situation of 3303-3293. If the support below is broken today, then the market will reverse to the short position. Otherwise, we will continue to rebound from the bottom and look for opportunities to do more.
From the current gold trend analysis, the support line of 3303-3293 is concerned below, the short-term resistance above is concerned about 3325-3330, and the suppression line of 3345-50 is focused on. The overall main tone of high-altitude low-multiple cycle participation remains unchanged. In the mid-line position, keep watching and do less, follow orders cautiously, and wait for the opportunity to enter the market after the key points are in place.
Gold operation strategy:
1. Go long near 3293-3303 for gold, and the target is 3315-3320.
2. Go short near 3320-3330 for gold, and the target is 3310-3300.

Gold continues to fluctuate, where will it go next week?Fundamental analysis:
With the Trump administration's massive tax cut and spending bill officially implemented, the U.S. Treasury may start a "supply flood" of short-term Treasury bonds to make up for the trillions of dollars in fiscal deficits in the future. The market has begun to respond to future supply pressures. Concerns about the oversupply of short-term Treasury bonds have been directly reflected in prices - the yield on 1-month short-term Treasury bonds has risen significantly since Monday this week. A closer look at non-agricultural new jobs exceeded expectations, but nearly half came from government departments, which is likely to reverse in July. Slowing wage growth, declining total working hours, stagnant wage income growth, and worrying consumer spending are all signs of support for gold.
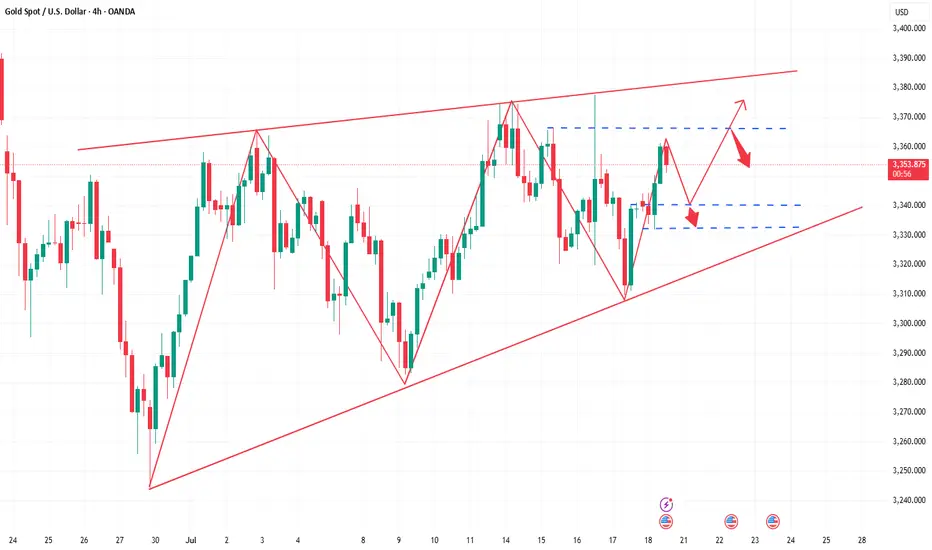
Gold bottomed out and rose from the low of 3245 this week, and then soared all the way to 3365. Finally, the weekly line closed with a positive line with an upper shadow. From the overall trend, after the data is digested, next week will still be treated with a volatile mindset. The large range will focus on the 3280-3393 area. If it does not break, it will still be mainly a sweeping operation. On the daily line, it also closed with a positive line with a long upper shadow, and closed firmly above 3323. It repeatedly tested the pressure of 3345 and did not break and fell back. The structure still maintained an oscillation rhythm within a small range. From the 4-hour cycle, the Bollinger Bands closed significantly. If it opens normally next week, pay attention to the 3325-3315 and 3311 areas when it falls back to support, and pay attention to the 3357 and 3365 positions when it hits the high pressure. It is recommended to maintain the strategy of selling high and buying low in operation and respond to the trend.For more specific operational details and strategy updates, please pay attention to the notifications at the bottom 🌐 and follow them in time.

Are you ready for the next wave of gold market?Gold fell back as expected after opening high. Today's strategy arranged long orders at 3350-3352, and successfully closed the market at around 3362 with profit. The subsequent three short orders also closed the market at a profit as expected. The points were perfectly predicted, and the long and short positions were perfectly grasped during the day. The strategic ideas were disclosed in advance and all were fulfilled.
At present, the overall trend of gold is still bullish, and it is in the adjustment stage in the short term. The large range this week is 3340-3405. Although there is a rebound, the upward pressure is still not small, and the gold price may continue the wide range of long and short fluctuations. Pay attention to the 3355-3340 area below. In terms of operation, long orders are arranged according to the strength of the retreat; pay attention to 3385 in the short term above. If it can effectively break through, look at 3395-3405. The strong pressure is still at the 3405 line. If it does not break, it will still fall under pressure. On the contrary, if it stabilizes, it is expected to hit last week's high.
Operation suggestion: When gold falls back to around 3355-3340, long orders can be arranged in batches, with the target at 3370-3380. Short orders will be adjusted according to the real-time market, please pay attention to the bottom 🌐 notification for specific points.

XAU/USD(20250618) Today's AnalysisMarket news:
World Gold Council: 95% of central banks expect gold reserves to rise in the next 12 months.
Technical analysis:
Today's buying and selling boundaries:
3385
Support and resistance levels:
3422
3408
3400
3371
3362
3349
Trading strategy:
If the price breaks through 3400, consider buying, the first target price is 3408
If the price breaks through 3385, consider selling, the first target price is 3360

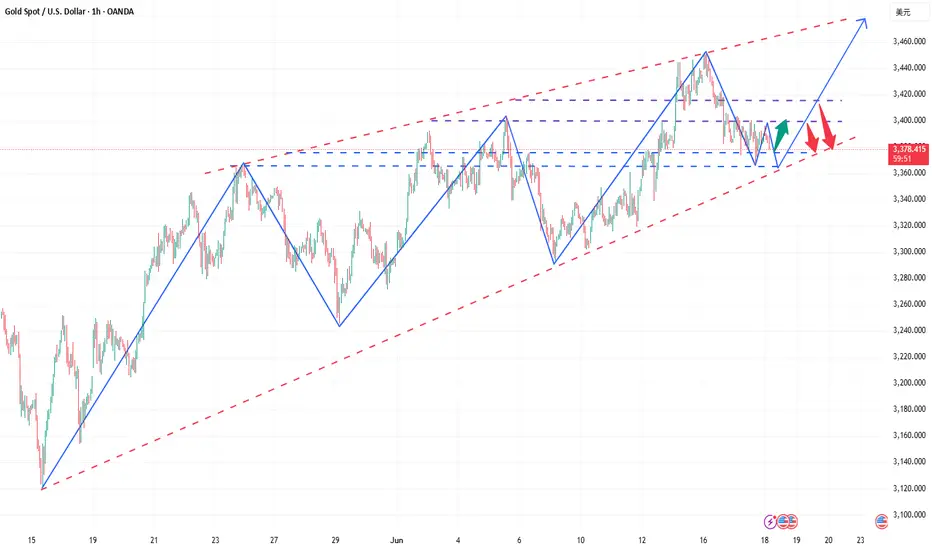
Gold (XAU/USD) 4H Technical Analysis - 18 June-2025Gold has been in a bullish 4H uptrend, making higher highs and higher lows. Recent data show gold peaked near ~$3,445 on June 16 (a new all-time high) before pulling back toward the $3,400 area.
In other words, price action remains constructive: successive higher lows (around $3,372, $3,322) and higher highs (around $3,445) indicate a strong uptrend.
As long as each pullback holds above the prior swing low (so far ~$3,372), the bullish structure (Break-of-Structure, BOS) is intact.
A decisive drop below ~3,372 (and especially below ~$3,322) would violate that structure (a Change-of-Character, CHoCH) and open a deeper correction.
Market Structure & Bias (4H)
Bullish bias: Gold has made a series of higher lows and highs on 4H, confirming an uptrend
Technical indicators (RSI bullish, price above 200-SMA) and fundamentals (safe-haven demand) support this bias.
Caution near $3,400:
The key $3,400 zone has switched roles as resistance-turned-support. Holding above $3,400 keeps bulls in control, but failure to regain it could allow a deeper dip toward ~$3,350.
Break-of-Structure (BOS): A BOS (new 4H high) upholds the uptrend.
A CHoCH (e.g. a close below $3,372/$3,322) would signal a possible reversal
Key 4H Levels & Zones
Resistance/Supply: ~$3,445–3,450 (recent swing high); ~$3,500 (psychological/all-time level).
Price may stall or reverse near these supply zones.
Pivot/$3,400: ~3,400–3,413 zone – a critical pivot. Gold traded near $3,400 recently; a break above targets $3,450, while failure could drop to support.
Support/Demand Zones: ~$3,372 (prior 4H higher-low). Near ~$3,350–3,353 – the 61.8–78.6% Fibonacci retracement of the last rally and a “golden pocket” demand area. ~$3,322–3,328 – a strong 4H demand order-block where price held on the last pullback.
Finally ~$3,300 (major low below).
Order Blocks & Imbalances: Smart-money traders note a 4H demand block at $3,322–3,328 (the low of a large bullish candle).
A brief sweep above $3,338 (a liquidity grab) was followed by a clean bounce from this zone.
Any unfilled gaps (imbalances) near $3,380–3,400 may attract price back during retracements.
In summary, the 4H chart shows a bullish structure with key support at ~$3,372–3,350 (demand/Fib zone) and resistance around $3,445–3,500. As FXStreet notes, the uptrend remains “intact” on 4H as long as dips are bought.
However, traders should watch for any break below $3,372/$3,322, which would flag a bearish structure break.
Until then, the overall bias is bullish, favoring long entries on dips into the above support zones.
1H High-Probability Trade Setups (Bullish Bias)
Setup 1 – Buy on $3,400 pivot hold: Entry zone $3,390–3,400 (at/just above 4H pivot). Stop: ~$3,380 (just below pivot, ~$10 below entry). TPs: $3,420 and $3,450. Trigger: A bullish candlestick pattern or break-and-retest of ~$3,400 (e.g. bullish engulfing or hammer on 1H). Reason: The $3,400 level is a key 4H support/resistance flip.
Holding here would confirm the uptrend continuation, targeting the recent swing highs. A 1H bullish signal (like a reversal bar) gives a clear entry.
Setup 2 – Buy on deep pullback: Entry zone $3,370–3,380 (around 4H higher-low). Stop: $3,360. TPs: $3,400 (the pivot) and $3,420. Trigger: A strong 1H bullish candle or double-bottom forming near zone. Reason: This area lines up with the 4H demand/Fib zone ($3,350–3,372).
It represents a higher-low in the 4H structure. A bounce here would signal buyers stepping in at a key support.
Setup 3 – Buy after breakout of $3,445: Entry zone $3,450–3,455 (above recent high). Stop: ~$3,440. TPs: $3,480 and $3,500. Trigger: A clean 1H candle close above $3,445 (breakout) and retest. Reason: A push above $3,445 (June high) would form a new 4H BOS, suggesting continued momentum. Buying on the breakout retest captures follow-through to the next targets.
(Each setup uses a small $~10 stop relative to gold’s price. Always wait for the specified trigger pattern before entering.)
Takeaway:
On the 4H chart, gold remains bullish while above ~$3,372/$3,350. Key zones to watch are $3,372–3,350 (buy zone) and $3,400–3,445 (sell/resistance). For now, favor long entries into support, and confirm with clear 1H signals before trading.

Golden opportunity comes again!Gold fluctuated all day yesterday, and finally did not break the range we gave. Today we continue to focus on the strong support range of 3365-3360, because this position is also the important key support we gave yesterday. Today we continue to look for opportunities to go long when we step back. As long as the strong support position below is not broken, there will be hope for the bulls to make a comeback.
From the current analysis of gold trends, gold continues to focus on the short-term support near 3375-3370 below, and the important support is around 3365-3360. The short-term focus is on the short-term suppression near 3400-3415 above. The operation is temporarily based on the range. There is a high probability that the short-term fluctuations will continue. Wait patiently for the key points to enter the market.
Gold operation strategy: Go long when gold steps back to 3375-3370, and cover long positions when it steps back to 3365-3360. The target is around 3380-3390-3400.
If you still lack direction in gold trading, you might as well try to follow my pace. The strategy is open and transparent, and the execution logic is clear and definite, which may bring new breakthroughs to your trading. The real value does not rely on verbal promises, but is verified by the market and time.
Gold (XAU/USD) 4H Technical Outlook-17 June 2025Gold’s 4-hour chart shows a clear uptrend: price is making higher highs and higher lows, trading above key moving averages and an upward trendline
Analyst ManiMarkets notes “a remarkably robust and sustained uptrend… printing higher highs and higher lows” since late 2024. The nearest major hurdle is around the $3,500 all-time high.
The current structure remains bullish: we have not seen a sustained break of the uptrend, so the overall bias is bullish. In Smart-Money terms, recent price action shows no bearish break of structure on 4H (no BOS), and price is simply consolidating near highs – a bullish sign.
Key zones to watch:
Demand/Order Block (~$3,374–3,380): Around $3,375 is a swing-low and past demand area. It lines up with the 4H EMA50 and 1H EMA200, a classical support confluence.
A strong bullish “order block” (heavy buying zone) sits here – a typical smart-money support area.
Pivot Point (~$3,389): Using the classic pivot formula
On the recent 4H range gives Pivot ≈ 3,389. This acts as a short-term balance point.
Resistance (≈$3,400–3,405): Gold has multiple prior highs around $3,400–3,405 (e.g. the overnight high ~$3,405 and the last swing high ~$3,405) which have been repeatedly tested. Traders are watching a break above ~$3,405 for follow-through. (A recent idea noted gold “bounced off support” near $3,390 and is “looking for a clean sweep of the highs at 3405”.)
Major Resistance ($3,500): The all-time peak around $3,500 is a big psychological barrier.
We expect stiff supply if price approaches 3,500.
Using these levels, the pivot-based support and resistance on the 4H chart are:
Pivot Point: ~$3,389
R1: ~$3,406 (Pivot + 1×range)
R2: ~$3,421 (Pivot + 2×range)
R3: ~$3,437 (Pivot + 3×range)
S1: ~$3,374 (Pivot – 1×range)
S2: ~$3,357 (Pivot – 2×range)
S3: ~$3,342 (Pivot – 3×range)
(These are rough levels using the standard formula on the last 4H high/low.)
Beyond numbers, price-action is key: we look for bullish patterns at support (e.g. bull-engulfing or pin-bar at ~$3,375–3,380) and cautious action near resistance. A brief “liquidity grab” happened at the $3,375 area recently (price wiggled below and then shot back up), which in Smart-Money jargon sweeps stops.
That suggests larger players may have been absorbing buying interest. In short, the tape looks healthy for bulls unless $3,375 breaks decisively. A break of the $3,400–3,405 highs would be a bullish BOS (break of structure), targeting the next supply zone.
Trade Setups (1H, Aligned with Bullish Bias)
Below are three high-probability long setups on the 1-hour chart (in line with the 4H uptrend).
Each is sized for a ~$10 stop from the entry zone.
Buy near $3,374–3,380 (Demand Zone):
Entry: $3,374–3,380 area (around Pivot S1 and the recent swing low).
Direction: Buy.
Stop: ~$3,364 (just below this zone, ~$10 lower).
Targets: ~$3,402 (near Pivot R1/previous high), and then ~$3,420 (around next resistance).
Reason: This zone is a confluence of support – it was a recent 4H low and aligns with EMAs (1H EMA200/4H EMA50)
It acts like a “bull order block” where buyers stepped in
A strong bounce from here keeps the bullish structure intact.
Trigger: Look for a bullish reversal candle on 1H (e.g. an engulfing or pin-bar) forming near $3,375. This confirms rejection of lower prices and signals a buy setup.
Chart: Example 1H gold chart. Blue shaded area marks the ~$3,374–3,380 buy zone (Pivot S1/EMA support). A bullish reversal candle here would trigger a long entry, targeting $3,402 then $3,420.
Buy break-&-retest at ~$3,402–3,408:
Entry: After a close above ~$3,405, look to buy on a pullback into $3,402–3,408 (just above the old high).
Direction: Buy.
Stop: ~$3,392 (about $10 below the entry zone).
Targets: ~$3,430 (next swing high) and ~$3,450 (round level/upper channel).
Reason: A decisive move above ~$3,405 would mark a BOS (break of the prior high), shifting structure higher. That resistance then becomes support on a retest. This is a classic “breakout retest” entry. (As noted, highs around 3,405 have been tested repeatedly, so breaking them signals strength.)
Trigger: Wait for a 1H candlestick to close firmly above 3,405, then buy on the next pullback into the $3,402–3,408 range with a bullish candle or dip-buy signal.
Buy on pullback to ~$3,385–3,390 (minor higher low):
Entry: $3,385–3,390 if price dips but holds above the 4H pivot (~3,389).
Direction: Buy.
Stop: ~$3,375 (below the entry zone, about $10 down).
Targets: ~$3,420 and ~$3,450 (same as above levels).
Reason: If the market skips Setup 1 and 2, any 1H pullback that still holds above the pivot (creating a higher-low) is another opportunity. Buying this higher-low keeps us aligned with the 4H uptrend. Essentially, we allow price to re-test the pivot area as new demand.
Trigger: A bullish reversal pattern on 1H in the $3,385–3,390 area (for example, a hammer or bullish engulfing) would mark a higher-low and signal a long entry.
Each setup has a tight stop (~$10) just beyond the support zone, and logical profit targets at nearby resistance levels. All assume the 4H trend stays intact. If support fails (e.g. a clean break under $3,374), be ready to reassess.
Takeaway: Gold’s 4H trend is bullish, so focus on buying dips into identified support zones (not shorting). Use tight stops beyond those zones and aim for the next resistance. In practice, that means looking to go long around ~$3,375–3,380 and ~$3,405 (on a clean breakout), riding any bullish continuation toward $3,430–$3,450, while managing risk at each step.

The situation has eased, and gold has pulled back!
Although Iran has released a signal of easing, Israel's action plan remains unchanged and the situation remains tense. Just recently, Israeli missiles attacked Iran's national news TV station.
Gold has only fallen back, and it is definitely not turning around. Gold continues to be bullish, and there are still long positions near 3400. Overall, it continues to look above 3460.
With the situation easing, it began to pull back. The fermentation of this round of news has restrained the big funds and did not test the high point of 3500 upwards. Overall, the increase in gold prices is not large, and there is still a process of pulling. The fundamentals have not changed, and gold is still in a bull market.
Today's trend is obviously still mainly washing the market. The big negative line came down and then pulled up strongly.
The bottom line is 3380.
It is obviously the support of the market and the bottom signal. This 3380 is the previous high point and the future support. At present, it is to keep an eye on this position and continue to increase positions near 3400. It's that simple.

Is this week a chance for gold to break through 3,500?
⭐️Gold Information:
Gold prices surged for the third consecutive trading day on Friday as geopolitical tensions intensified after Israel launched a military strike on Iranian targets, including nuclear facilities and key leaders. The escalation of the situation triggered widespread risk aversion in global markets, stimulating demand for safe-haven assets. As of the time of writing, XAU/USD was trading at $3,431.
Gold surged to a five-week high of $3,446 before giving up gains as traders took profits before the weekend. Geopolitical turmoil, coupled with dovish signals released by recent US inflation data, reinforced expectations that the Federal Reserve may begin to cut interest rates later this year - despite improved consumer confidence. These factors together support the bullish momentum of gold.
⭐️Personal Comment:
Continued military tensions next week are a big driving force for gold prices to continue to break through 3,500
. 🔥 Technical aspects:
Based on the resistance and support levels of gold prices in the H4 framework, the following important key areas can be identified:
Resistance: $3488, $3502, $3562
Support: $3382, $3342

Israel attacks Iran, gold soars
⭐️Gold information:
Israel attacks Iran's capital Tehran! Gold and crude oil soar rapidly!
The Middle East bully attacks Iran, and the risk aversion sentiment affects the early trading of gold at 3380. 30 US dollars
⭐️Personal comments:
Due to the escalation of geopolitical tensions in the Middle East, market risk sentiment has slightly rebounded, and investors are more inclined to buy traditional safe-haven assets-gold
Moving towards 3480
⭐️Set gold price:
🔥Sell gold area: 3478-3480 SL 3485
TP1: $3462
TP2: $3450
TP3: $3435
🔥Buy gold area: $3375-$3377 SL $3370
TP1: $3389
TP2: $3400
TP3: $3412
