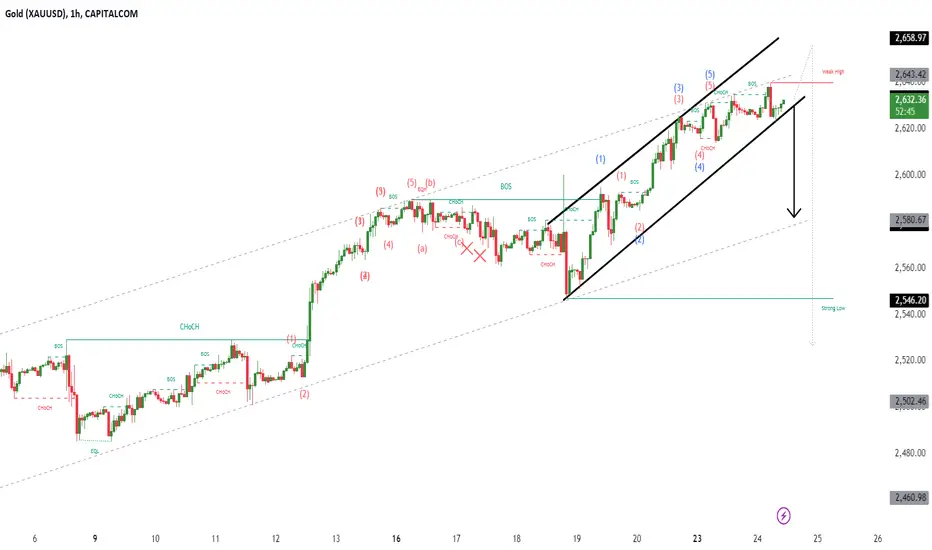
10.8 Analysis of short-term gold operationsIn the early Asian session on Monday (October 7), spot gold fluctuated in a narrow range and is currently trading around $2,640/ounce. Gold prices fell slightly after violent fluctuations last Friday, closing at $2,652.64/ounce, as the stronger-than-expected US employment report poured cold water on the Fed's expectations of aggressive interest rate cuts in November, boosting the dollar to a high of more than one and a half months, and US bond yields also rose sharply to a high of nearly two months, overshadowing risk aversion concerns over the tense geopolitical situation in the Middle East.
Technical level:
1: In 4 hours, BOLL shrinks, the range shrinks, and the range shrinks to the 70 range of 2642-26; in terms of indicators, the stochastic indicators and MACD indicators are all blunt, and the signals are unclear; in terms of form, it is a horizontal pattern, which is not the top high point;
2: In the daily K, the stochastic indicator crosses downward, which is a bearish adjustment signal; in terms of form, the time-for-space pattern, the market is relatively resistant to decline; the central axis gradually moves up, and the current track support of the central axis is around 2590, but it is expected to rise to around 2600;
Goldmansachs

Non-farm data is mixed, gold peaks in the short termThe non-agricultural data on Friday went up and down, and it was neither rising nor falling. The 4-hour moving average is sticking together, and it seems that it will break through this week and usher in a big market.
Gold has not reached its peak at all, and the 4-hour cycle is still one wave higher than the other. The only bad signal is that the 60-day moving average of the 4-hour cycle has been broken. We can see that in the previous wave of $150 increase, gold did not touch this moving average at all. This signal must be paid attention to.
The K-line signal is still bullish, and this wave of triangle consolidation is about to change. Technically, gold has not reached the top yet, and gold has one last rise.
Intraday short-term trading strategy:
Gold 2665 short stop loss 2670 target 2645---40
Gold 2633 long, stop loss 2623, target 2655---60

Sell gold in the ultra-short term. The room for decline is about $6 or more.
The price range of 2655-2652 is the top of the triangle pressure. Selling is the main method in the ultra-short term.
If you hold a loss order for a long time a CAPITALCOM:GOLD OANDA:XAUUSD nd don’t know how to deal with it, leave me a message.

How to get rid of a sell order in hand ?If you make money, it's because of your good skills or luck. But how should you deal with orders that lose money?
Stop loss or continue to hold? It depends on whether the market continues to rise or fall. I personally think that the market will continue to fall. The main reason is that there is a lot of pressure from above.
CAPITALCOM:GOLD BITSTAMP:BTCUSD BINANCE:BTCUSDT
For investors who hold short orders, I suggest you continue to hold and wait for a suitable time to close the order. After all, after the stop loss, the loss is huge. Many people cannot accept it. Moreover, many people have different selling timings and positions.
Getting rid of the short orders in my hands is my only idea at present. Whether you are a novice or an investor who has been in the market for a long time, you will face this problem.
OANDA:XAUUSD
Judging from my more than ten years of trading experience, it is only a matter of time before the gold price falls. It is reasonable to mitigate the loss through other transactions in the short term. After all, as long as it reduces the loss, any method can be implemented.
Starting next week, I will share my real-time views and operation strategies one after another. If you want to recover your losses, keep paying attention. In this way, while you continue to pay attention to me, you will definitely get help and the answers you want.

Gold fluctuates and awaits non-agricultural data!!!For today, we need to divide the non-agricultural data into two parts.
1. Before the data, it rose in the morning. The European market rose and fell in the past two days. From the perspective of the daily line pattern, it tested 2664 4 times, and the resistance level was very small. This must be a breakthrough, but if this breakthrough continues to fall, it will not make much sense.
So, either it is around 2658-60, with a loss of 50, and look at 2673=75 above, and arrive before the data.
2. Give up the intraday market and wait for non-agricultural data.
Referring to Wednesday's ADP, the non-agricultural data is likely to bottom out and rebound, but this bottoming must be based on the breakthrough and rise in the European market, and the US market will see a bottoming and rebound.
If it has been suppressed below 2664 during the day, then the bottoming and rebounding will not make much sense. The trend is not very strong.
Only if it breaks through during the day and the US market bottoms out and rebounds, there is a risk of breaking high. If it is suppressed, it is likely to continue to fluctuate.
So whether it is strong today depends on the strength of the breakthrough in the European market.
If there is no breakthrough, look for shocks; if there is a breakthrough, look for strength

Gold keeps hitting new highs, and today is the day to see a breaThe gold price moves perfectly along the trend line. It starts to rise when it approaches the trend line. Gold is accumulating strength at a high level. Today, the gold price may break through the historical high and start the rising mode.
The gold price trend is very healthy. It starts to rise when it approaches the trend line and important moving average. The best operation is to follow the trend, because the risk of going long is much lower, just like the Chinese A-shares that are winning by doing nothing now. Shorting may burst at any time, and going long may reach the daily limit at any time.
Today's data:
The number of layoffs of challenger companies in the United States in September (10,000 people)
The number of initial jobless claims in the United States as of the week ending September 28 (10,000 people)
The final value of the S&P Global Services PMI in the United States in September
Trading strategy: Gold 2640 more, stop loss 2630, target 2665--------2670

10.3 Gold short-term operation strategyAt present, gold continues to fluctuate. The hourly chart has formed a converging triangle. The short-term support is 2648, and the upper pressure is at 2670. From the daily chart, the "big positive front resistance line" pattern has been formed. Under the support of the big positive line of last week, after repeated short-term fluctuations, the market tends to choose to break down! ! !
Today's data:
The number of initial jobless claims in the United States as of September 28 (10,000)
Intraday operations:
BUY: 2648 Stop loss: 2643 Target: 2655----2660
SELL: 2665 Stop loss: 2660 Target: 2630----2625

10.2 Gold bottoms out and correction is made from high levelsGold daily line is still sideways at a high level, and the K line continues to deviate far from the moving average. This is an abnormal trend. The gold price will inevitably return to the moving average. This is inevitable. At the same time, there is an obvious double top pattern near 2670, and the upper shadow line continues to close.
Gold fell under pressure from the high level in 4 hours. Gold continued to have a double top structure in 4 hours. Gold rose to 2673 last night and fell under pressure. The resistance is obvious.
The tension in the Middle East is still an important factor affecting the gold price. This week will usher in non-agricultural data.
Intraday operation:
SELL: 2675 Target: 2660------2650
BUY: 2645 Target: 2665------2675

10.1 Analysis of gold short-term technical operations1. The daily line has adjusted for two days and just stepped back on the 10-day moving average. According to the bulls, this is a typical correction. The biggest step back in the strong trend is 10 days. Whether it can go up today is very critical.
2. The usual high-rise and fall in the morning, the European market is weak. For the continuous market, the European market is weak and the US market is difficult to increase.
3. Yesterday, the US market retreated twice, and the European market broke the bottom, and the US market was weak after the bottom.
It cannot continue the retracement. 2623 is the retracement of the rise to 382, which is very critical. It breaks the bottom and affects the bulls.
In addition, the daily line is weak, so the rise is affected.
And today, it is above the turning point of long and short.
The watershed in the morning is 2640. It is not considered whether the European market will go through a cyclic retracement for the time being.

Gold's short-term downturn has passed, go long at 30Gold is long near 2630.
Gold has gone out of the turning point, the decline is over, and it is about to start rising. Go long in the short term today, seize this opportunity to get a big wave.
Gold fell back to the moving average and closed with a hammer line, and the turning point signal is obvious. Go long near 2630. If we look at the moving average, it also meets the bullish trend, because every time the gold price falls back to the moving average, there will be a rebound. Can it rebound and break the historical high? Let's not consider it for now, grab the long orders near 2630, and let the market give us the rise we want.
Trading strategy:
Gold is long at 2630, stop loss at 2620, target 2650-------2655

9.30 If the short-term gold high is not broken, it will be a corTechnically, the 2670 level has become an important resistance level, which has not been broken through many times. The Bollinger Bands have begun to close. From all angles, gold will not rise in the short term.
With such a big thing happening in the Middle East, gold should have started a wave of $50 rise, but it didn't. That must be because gold digested the news in advance. If there is no positive news, gold will turn to a sharp drop.
Intraday operation:
SEII: 2665 Stop loss: 2672
BUY: 2645 Stop loss: 2640

XAUUSDPair : XAUUSD ( Gold / U.S Dollar )
Description :
Completed " 12345 " Impulsive Waves
Break of Structure
RSI - Divergence
Symmetrical Triangle as an Corrective Pattern in Short Time Frame
Demand Zone

XAUUSDPair : XAUUSD ( Gold / U.S Dollar )
Description :
Completed " 12345 " Impulsive Waves
Break of Structure
RSI - Divergence
Symmetrical Triangle as an Corrective Pattern in Short Time Frame
Demand Zone

Gold closes higher and may fall back to peakThe gold hourly line has obviously reached the top. The K line rushed to around 2685, and then the big Yin line directly covered it and crushed it directly. It once fell by 30 US dollars. The top was obviously bearish engulfing. The moving average was directly bent and turned downward. Of course, the gold price deviated far from the moving average, and it was bound to return to the 50-day moving average. Detailed operations during the day: SELL: 2650------2645

Gold bulls are strong and aiming at 2700!At present, the support for the continuous rise of gold prices is still the strong demand of the Federal Reserve and other European countries for gradually loose monetary policies; coupled with the tension in Middle East relations, economic downturn and geopolitical relations, gold prices continue to rise. In terms of technical forms, the room for gold prices to retrace is limited, and the time for correction is also very short. The momentum of continuous rise is very strong, and the upward space is expected to continue to open up.
The Asian session is corrected by the conversion of the hourly Yin and Yang lines. The European session began to rise. Even if economic data is released, it does not affect the bullish trend. There is not much room for recent corrections, especially in the European session. There is basically no retracement, and it continues to rise after the middle cross K pattern. Based on the above situation, even if the retracement relies on the top of the previous hourly line Yang line 2675, it will continue to be bullish.
Resistance level: 2683 2690. Break to see 2700

9.26 Gold Short-term Operation StrategyThe gold four-hour line is a positive line throughout the whole process. Even if it closes with a negative line, it can still break through the positive line directly and close with a long lower shadow. The K line always stands above the moving average and always crushes the moving average. The bullish trend has not changed at all, and the support level has been constantly moving up. This is a super buying trend that continues to set new highs.
Short-term operation in the Asian session:
BUY: 2658 Target: 2670

9.26 Technical Analysis of Gold Short-term OperationsGold rose again in 1 hour and is currently trading at 2660 without breaking a new high.
At present, gold has begun to form a small double top. After continuous rise, the bullish momentum of gold has gradually begun to be consumed. A major adjustment is imminent. If the rebound of gold in the US market does not break a new high, it can still be shorted.
On the 1-hour K-line chart, gold has risen. At this time, the Bollinger Bands began to close, and the gold price fluctuated and adjusted. As for the target position, we look at the 1-hour moving average
Today's focus
The number of initial jobless claims in the United States as of the week of September 21 (10,000 people)
Detailed operations during the day:
Sell: 2665 Target 2650-2645

9.26 Technical Analysis of Gold Short-term OperationsYesterday, gold continued to break highs in the US market, performing extremely strongly. The early trading price was 2661. Yesterday, it rose by 30 US dollars and continued to rise to the 2670 line. There is no doubt that with the frequent breakthrough of high points, the rising gold bulls are coming, and the upward trend will accelerate. Bulls will be the main theme in the future; the correction action is presented in the form of shocks.
"Although it has set new highs many times this year and outperformed major stock indexes, in the long run, gold still has room for further growth. Pay attention to the correction in the short term." In a low interest rate environment and geopolitical turmoil, interest-free gold is often the preferred investment.
Today's operation:
BUY: 2650 stop loss 2640 target: 2665-2675
SELL: 2680 stop loss 2685 target: 2660-2655

9.25 Professional Gold Short-term Operation Analysis StrategyToday, the recommended upper pressure position is 2665, and the lower support is 2645. The overall market still shows a trend of raising the low point to a new high, and the structural low point of this round is around 2624. The support effect of this position was also mentioned in yesterday's analysis. So if the market has a strong correction today and directly breaks through 2645 without stopping, the alternative plan is to look at the support of 2638. This position is the support of the Fibonacci 0.618 correction level of yesterday's overall pull-up.

9.25 Gold short-term operation analysis strategyIn the early Asian session on Wednesday (September 25), spot gold fluctuated in a narrow range near its historical high and is currently trading around $2,660.16 per ounce. Gold prices rose by $30 on Tuesday and hit a record high of $2,664, continuing the recent rally. The daily line closed with a big positive, with basically no leads.
In addition to the tensions in the Middle East that have enhanced the safe-haven appeal of gold, the US consumer confidence index has recorded the largest drop in three years, and concerns about the labor market are growing. Market expectations for the Federal Reserve to cut interest rates by 50 basis points in November have increased, and the US dollar index has recorded the largest single-day drop in nearly a month, which also provides momentum for gold prices to rise.
Gold is undoubtedly strong at present, whether from a short-term or long-term perspective, especially in the 4-hour period, which basically starts to rise as soon as it steps back on the moving average, and there is basically no retracement. Although gold is undoubtedly strong, this round of gold has risen by nearly 200 points in just two weeks, so the risks of peaking and retracement that I have been emphasizing in my previous articles are needed. Of course, we have no idea where the top is. We all have guessed the top, but the current price is already in danger. When it reaches our position, we can still participate in short orders.
Detailed intraday operation strategy:
Short at 2665, defense at 2670, target 2650-2640
Long at 2635, defense at 2628, target 2650-2660

9.24 Gold Short-term Operation StrategyYesterday, the gold market opened at 2621.6 in the morning, then the market rose slightly to 2131.6, and then the market fell rapidly. The daily line reached a low of 2613, then the market rose, and the daily line reached a historical high of 2635.2, and then the market consolidated. The daily line finally closed at 2628.2, and the daily line closed with a spindle pattern with equal upper and lower shadows. After such a pattern ended, today's market still has bullish demand. In terms of points, the long positions of 1996 and 2028 below are followed by stop loss at 2350. After the long positions of 2601 were reduced last Friday, the stop loss was followed by 2601.
Today's market operation:
2615 long stop loss 2609, target 2635
2640 short stop loss 2645 target 2620

XAUUSD GoldPair : XAUUSD ( Gold / U.S Dollar )
Description :
Completed " 123 " Impulsive Waves
Bullish Channel as an Corrective Pattern in Short Time Frame
Break of Structure
RSI - Divergence
Fibonacci Level - 361.8%
9.24 Technical Analysis of Gold Short-term OperationsThe bullish market sentiment after the Fed's rate cut last week and geopolitical tensions pushed up gold prices. Gold hit a new record high yesterday, reaching 2634, and then began to fall slightly, closing the daily line with a small positive. However, the US dollar index stabilized and rebounded, and Ukrainian President Zelensky said that the Russian-Ukrainian war was "close to the end". Everyone still needs to beware of the risk of a short-term correction in gold prices.
Gold hit a new high again, and the high point was constantly refreshed, from 2500 to 2634. In the short term, it is still dominated by a bullish trend. The weekly level broke through strongly last week. The current market is running on the upper track of the long-term channel. At present, it is necessary to focus on the support near 2600. The gains and losses of this position are related to the trend guidance of gold bulls and bears. If this position is broken, gold is likely to have a large retracement.
It is still expected to fluctuate during the day. In the short term, if gold wants to completely get out of the strong pattern, it still needs time to exchange space. I have repeatedly emphasized that the current point chasing long profits and risks are not proportional. The operation is around the 2600-2635 range during the day.
Detailed intraday operation strategy:
Short gold at current price 2633, defense 2638, target 2620-2600
Long gold at 2600, defense 2594, target 2610-262
