Analysis and layout of the latest gold trend in the evening📰 Impact of news:
1. The ceasefire agreement reached earlier did not take effect, and Trump believed that both sides violated the agreement
2. Federal Reserve Chairman Powell delivered a speech 3 hours later
📈 Market analysis:
After falling below the 3300 mark, gold hit the 3295 line and then rebounded. However, there are too many long orders at the current high level of gold, and the market will not rise easily. The current international situation is so tense, and gold is still slowly declining. It is difficult to rebound sharply in this situation. In the short term, focus on 3290-3280 below. If effective support is obtained, you can go long and look towards 3300-3310. If it falls below the support line of 3290-3280, the downward channel of gold will be opened and it is expected to reach 3265. At the same time, pay attention to the 3328-3338 resistance range on the upside. If the first rebound in the evening encounters pressure and resistance here, you may consider shorting.
🏅 Trading strategies:
SELL 3328-3338-3400
TP 3310-3300-3295
BUY 3290-3280
TP 3300-3310
If you agree with this view, or have a better idea, please leave a message in the comment area. I look forward to hearing different voices.
TVC:GOLD FXOPEN:XAUUSD FOREXCOM:XAUUSD FX:XAUUSD OANDA:XAUUSD
Goldmansachs

XAU/USD) Bullish reversal analysis Read The captionSMC trading point update
Technical analysis of Gold (XAU/USD) on the 30-minute timeframe, based on technical signals and price action behavior. Here's the breakdown
---
Gold Bullish Reversal Setup – Targeting 3,384
---
Key Technical Highlights:
1. Support Zone & Price Reaction:
Price has tested a strong horizontal support level (highlighted in yellow).
Multiple bullish rejection wicks indicate buying pressure at this zone.
The green arrows show successful support bounces, hinting at bullish intent.
2. Trendline Analysis:
Price bounced near the lower boundary of the falling wedge/downtrend channel.
An uptrend line convergence supports potential reversal.
A breakout above the short-term descending trendline is indicated.
3. EMA & Target Projection:
EMA 200 at 3,364.33 may act as dynamic resistance, the next short-term hurdle.
Target zone projected at 3,384.04, offering a potential move of +65.67 pts (~1.98%).
4. RSI Indicator:
RSI(14) is oversold (~29.93), signaling a potential reversal.
A bullish crossover may be forming, supporting upward momentum.
---
Trading Plan:
Entry Zone: Near current support area around 3,325
Target: 3,384
Stop Loss (Suggested): Below 3,300, under support structure
Risk/Reward: Favorable based on support hold and breakout projection
Mr SMC Trading point
---
Conclusion:
This setup suggests a short-term bullish reversal from a key support area, with confirmation likely if price breaks above the descending trendline and clears the 200 EMA.
Please support boost 🚀 this analysis)

Bearish Continuation Pattern Detected on GOLD/USD Bearish Continuation Pattern Detected on GOLD/USD 📉
📊 Chart Analysis Summary:
The GOLD/USD chart shows a clear bearish continuation pattern, following a rejection from a major resistance zone.
🔍 Key Technical Highlights:
🔺 Resistance Zone:
Strong resistance at 3,420 – 3,440 USD, marked by multiple rejections (🔴 red arrows).
Price formed a Bearish Harmonic Pattern (likely a Gartley or Bat), suggesting reversal from this resistance.
🔻 Bearish Momentum:
After the pattern completed, price broke below the minor support structure and is currently forming lower highs and lower lows, indicating bearish structure.
📉 Support Level:
Strong horizontal support zone around 3,298 – 3,300 USD, marked as “TARGET.”
This area was previously tested (🟠 orange circles) and now projected to act as a target level again.
🔄 Minor Retracement Zone:
Expecting a minor pullback to 3,347 USD (purple line) before potential continuation downward.
This zone aligns with the previous support turned resistance (classic SR flip).
🎯 Target Projection:
Based on the bearish impulse and measured move, the projected target is around 3,298.758 USD, which coincides with the previous support zone.
📌 Conclusion:
The price action suggests a high-probability bearish continuation, targeting the 3,298 USD zone unless the price breaks and holds above 3,347 USD. Traders may consider selling on rallies with a confirmation of rejection at resistance.
📉 Bias: Bearish
📍 Invalidation: Break and daily close above 3,347 USD
📉
📊 Chart Analysis Summary:
The GOLD/USD chart shows a clear bearish continuation pattern, following a rejection from a major resistance zone.
🔍 Key Technical Highlights:
🔺 Resistance Zone:
Strong resistance at 3,420 – 3,440 USD, marked by multiple rejections (🔴 red arrows).
Price formed a Bearish Harmonic Pattern (likely a Gartley or Bat), suggesting reversal from this resistance.
🔻 Bearish Momentum:
After the pattern completed, price broke below the minor support structure and is currently forming lower highs and lower lows, indicating bearish structure.
📉 Support Level:
Strong horizontal support zone around 3,298 – 3,300 USD, marked as “TARGET.”
This area was previously tested (🟠 orange circles) and now projected to act as a target level again.
🔄 Minor Retracement Zone:
Expecting a minor pullback to 3,347 USD (purple line) before potential continuation downward.
This zone aligns with the previous support turned resistance (classic SR flip).
🎯 Target Projection:
Based on the bearish impulse and measured move, the projected target is around 3,298.758 USD, which coincides with the previous support zone.
📌 Conclusion:
The price action suggests a high-probability bearish continuation, targeting the 3,298 USD zone unless the price breaks and holds above 3,347 USD. Traders may consider selling on rallies with a confirmation of rejection at resistance.
📉 Bias: Bearish
📍 Invalidation: Break and daily close above 3,347 USD

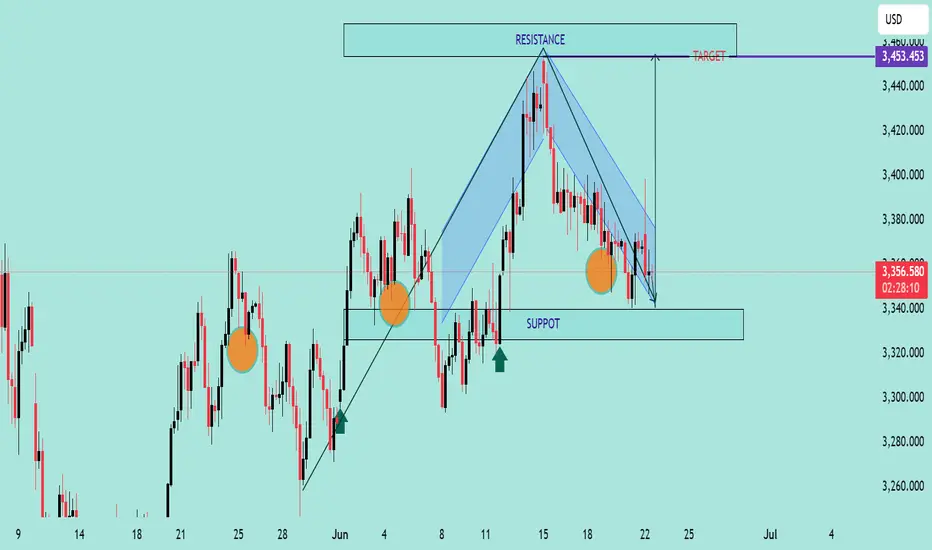
GOLD/USD Falling Wedge Breakout PotentialChart Analysis:
The chart illustrates a Falling Wedge Pattern, a bullish reversal setup typically signaling a breakout to the upside.
📌 Key Observations:
📉 Downward Channel: Price has been compressing within a falling wedge (highlighted in blue), indicating potential exhaustion of sellers.
💪 Support Zone: Strong support observed near the 3,340 level, with price rejecting this zone multiple times (highlighted with orange circles).
🔼 Bullish Signals: Price recently tested the lower wedge boundary and bounced, suggesting potential reversal.
🎯 Breakout Target: Projected target after breakout is around 3,453.453 USD, aligned with previous resistance zone.
🟢 Buy Pressure Arrows: Green arrows signal previous bullish reactions from similar demand zones.
📈 Conclusion:
If price breaks above the wedge’s upper boundary with volume confirmation, a bullish rally toward 3,453 is expected. Keep an eye on breakout retest for entry validation.
✅ Trading Plan Suggestion:
Entry: On breakout above wedge resistance
SL: Below recent swing low (~3,330)
TP: 3,453 zone 🎯
🔔 Note: Wait for a confirmed breakout before entering to avoid false signals.
When will the price of gold fall?Market news:
In the early Asian session on Friday (June 20), spot gold fell narrowly and is currently trading around $3,360 per ounce. London gold prices fluctuated violently under the dual influence of the Fed's hawkish stance and geopolitical tensions. Powell's hawkish stance cooled the market's expectations for interest rate cuts. As a non-yielding asset, international gold is under obvious pressure under high interest rate expectations. In sharp contrast to the Fed's hawkish stance, geopolitical tensions have provided important safe-haven support for international gold prices. The escalation of the Israeli-Iranian conflict has not only exacerbated tensions in the Middle East, but also triggered market concerns about the global security environment. As a traditional safe-haven asset, gold is often sought after when geopolitical risks rise. In the short term, the continued escalation of the conflict between Israel and Iran may continue to drive safe-haven funds into the gold market, but the direction of the Fed's monetary policy and the specific implementation of the Trump administration's tariff policy will have a key impact on the medium- and long-term trend of gold prices.
Technical Review :
Gold maintained a volatile closing. The daily chart closed with alternating buying and selling for four consecutive trading days. There was no trend continuation. We will continue to pay attention to the 3350/3390 range during the day. Today's trading ideas are still short-term, selling at high prices and buying at low prices to participate in the volatile trend.So far this week, gold has been difficult to break out of the continuity of buying and selling. Yesterday, Thursday, under the temporary performance of gold's short-term dollar trend, we are optimistic that gold will fluctuate in the range, with the maximum range at 3350/3400, but there may often be a breakout on Thursday. Therefore, today we should pay attention to both trading within the range and the strength after the breakout.
Today's analysis:
Gold fluctuated overall yesterday due to the early closure of the US market, and the fluctuation was not large. However, gold as a whole is still biased towards selling. Gold is now weak in buying and rebounding, so there is a lot of room for gold selling. Next, we will continue to sell gold. If there is no particularly large profit to support gold, then gold buying may not cause any big waves in the short term. Gold 1-hour moving average continues to cross and sell downward. Gold selling is strong and there is still room for downward movement. After gold fell yesterday, the highest rebound was around 3378, and then it continued to fall back. After rebounding several times, it did not break through 3378 again. Gold continued to sell at high prices under pressure at 3378. Gold is now fluctuating and falling, and the center of gravity is constantly moving downward. With this trend, gold may accelerate downward at any time.
Operation ideas:
Short-term gold 3335-3338 buy, stop loss 3328, target 3370-3380;
Short-term gold 3360-3370 short, stop loss 3387, target 3330-3340;
Key points:
First support level: 3352, second support level: 3344, third support level: 3331
First resistance level: 3378, second resistance level: 3388, third resistance level: 3400

GOLD/USD Support Retest & Breakdown SetupGOLD/USD Support Retest & Breakdown Setup 📉🔍
🔹 Overview:
The chart indicates a potential bearish continuation pattern on GOLD/USD as the price is approaching a key support level at 3,335.305. Previous price action shows multiple rejections from the resistance zone (~3,435), followed by lower highs – a sign of weakening bullish momentum.
📊 Technical Analysis:
🔺 Resistance Zone (~3,435)
Multiple rejections (🔴 red arrows) indicate strong supply pressure.
Price has failed to break above this area thrice, forming a clear ceiling.
🔻 Support Zone (~3,335)
Marked as the target for a short setup.
Price is testing this level again after forming a minor consolidation below lower highs.
A clean break below this purple zone may trigger a continuation to the downside, targeting the broader support range below (~3,240).
🟠 Bearish Structure:
Series of lower highs (highlighted with circles).
Breakdown pattern is developing with declining bullish momentum.
📈 Potential Play:
A confirmed breakdown below 3,335 could lead to a drop toward the next major support.
If support holds, short-term bounce is possible but limited by the dominant resistance.
📌 Conclusion:
GOLD/USD is currently in a bearish setup, with the market eyeing a potential breakdown below a critical support zone. If this level fails to hold, we could see accelerated bearish momentum toward the lower support range.
💡 Caution: Wait for a confirmed close below support before entering any short trades.

XAU/USD) Back Bullish trand Read The captionSMC Trading point update
Technical analysis of Gold (XAU/USD) on the 3-hour timeframe based on a price action setup within a rising channel and a key support zone. Here's a breakdown of the analysis:
---
Technical Overview:
Trend Structure:
The price is moving within a rising channel (marked by the black trendlines). Recent touches on both the top and bottom of the channel suggest that it is being respected.
Key Support Zone (Yellow Box):
Price recently tested a strong support zone around $3,338 – $3,350, which aligns with:
Historical price reaction area.
The 200 EMA (blue line).
An uptrend line support.
A bullish reaction (green arrow) confirming demand.
Bear Trap Breakout:
There’s a false breakout below the support followed by a sharp reversal (green arrow), which could indicate a bear trap, often followed by a bullish rally.
Price Projection:
The projected move suggests a bullish rally toward $3,478.89, offering a potential 3.97% gain (~133 points).
The path includes a possible consolidation before a breakout (illustrated by the wavy arrow).
RSI Indicator:
RSI is recovering from the oversold zone (~45), indicating increasing bullish momentum.
Mr SMC Trading point
---
Trade Idea Summary:
Bias: Bullish
Entry Zone: Around $3,350–$3,370 (post-retest of support)
Target: $3,478.89
Confirmation: Bullish price action at support, 200 EMA bounce, RSI reversal
---
Please support boost 🚀 this analysis)

XAU/USD) Back support level Read The captionSMC trading point update
Technical analysis of XAU/USD (Gold Spot vs U.S. Dollar) – 2H Timeframe:
---
XAU/USD Bearish Rejection from Resistance – Short-Term Sell Setup
Key Observations:
1. Rejection from Upper Channel & Resistance Zone:
Price was rejected sharply after touching the upper boundary of the ascending channel and the newly established resistance zone (~3400–3420).
A strong bearish candle confirms selling pressure at the top.
2. Support Retest in Progress:
The price is currently descending toward the EMA 200 and the KYY support zone (approximately 3343–3348).
The previous bounce originated from this level, making it a significant retest zone.
3. EMA 200 as Confluence:
The 200 EMA (currently at 3346.92) aligns with the support zone, increasing the likelihood of a bounce or at least temporary pause in bearish momentum.
4. RSI Bearish Signal:
RSI has dropped below 50, confirming a momentum shift toward the downside.
Still above oversold territory, suggesting more downside room.
---
Trade Idea:
Bias: Bearish (Short-Term)
Entry Zone: Around 3390–3400 (confirmed rejection area)
Target Zone: 3348 – 3343 (KYY support + EMA 200)
Stop Loss: Above 3425 (just above resistance zone)
Mr SMC Trading point
---
Summary:
Gold has faced a clear rejection at a key resistance zone within an ascending channel, and is now targeting the EMA 200 and previous structural support. Short opportunities could be considered toward the 3343–3348 zone, with RSI and price action supporting the move.
Please support boost 🚀 this analysis)

Accurately grasp the interest rate trend, today's gold layout📰 Impact of news:
1. The interest rate remains unchanged and leads to new lows in the short term
2. Geopolitical tensions provide support for risk aversion
📈 Market analysis:
I told you yesterday that 3363 is not the recent low. Today's lowest point has reached around 3347. The current day's K-line closed with a medium-sized negative line with balanced upper and lower shadows. The shape shows that gold will fluctuate in the short term and be bearish. Therefore, it is not suitable to blindly guess the bottom in the short term. As geopolitical tensions still exist, it is expected that the lowest level may reach 3330. During the day, focus on the upper resistance range of 3380-3390. If the rebound is blocked, try to intervene with short orders. The lower support is at the key level of 3330-3320. Pay attention to the defense of the support area.
🏅 Trading strategies:
BUY 3335-3325
TP 3360-3380-3390-3400
SELL 3375-3385
TP 3365-3355-3345-3300
OANDA:XAUUSD FX:XAUUSD FOREXCOM:XAUUSD FXOPEN:XAUUSD TVC:GOLD

Is 2025 the right time to make plans?Market news:
On Thursday (June 19) in the early Asian session, spot gold fluctuated in a narrow range and is currently trading around $3,380/ounce. As an important safe-haven asset in the global financial market, the price fluctuations of international gold are often affected by macroeconomic policies, geopolitical situations and market sentiment. Recently, the gold market has shown a complex and eye-catching trend under the dual influence of the Federal Reserve's interest rate decision and geopolitical tensions in the Middle East.The Federal Reserve decided to keep the benchmark overnight interest rate unchanged at 4.25%-4.50% at its meeting on June 18. This decision was in line with market expectations, but its subsequent statement brought new uncertainty to the London gold price market. This cautious stance weakened the market's expectations for the Federal Reserve's rapid easing, causing gold prices to fall 0.57% on Wednesday to close at $3,369/ounce.The current gold market is in a complex environment with multiple factors intertwined. The Federal Reserve's cautious monetary policy stance and inflation expectations caused by tariffs have brought short-term pressure on gold prices, but geopolitical tensions and signs of economic slowdown have provided potential upward momentum for gold prices. Pay attention to the dynamic changes in the global economy and geopolitics to seize investment opportunities in the gold market.
Technical Review:
Gold fell to the MA10-day moving average of 3662 in the early morning and counterattacked 3380 in the Asian session. The Asian session will continue to look at the rebound strength. The gold price will continue to fluctuate and adjust. The large range is 3408/3343, and the small range is 3390/3360. The daily chart fell back to the 10-day moving average at 3362, and the MA5/7-day moving average was suppressed at 3385/90. The RSI indicator continued to flatten the middle axis. The short-term four-hour chart price is running in the middle and lower tracks of the Bollinger Band!
This week, gold rose sharply to 3450 at the opening, and gradually fell slowly to 3365, with a strength of 100 US dollars. Although the main strength in the first two trading days was a decline, the buying trend remained unchanged. In an uncertain environment, there is still a chance of a big rise in the future. So this week's idea continues to maintain short-term selling and long-term buying.
Today's analysis:
After the Fed's interest rate decision, the Fed kept the interest rate unchanged as expected, which was in line with market expectations. Gold continued to fluctuate and fall in the short term, and there was no obvious upward momentum for buying. Even if it was a risk aversion, it might be careful of the trend of rising and falling. Since gold was under pressure at 3400, it continued to sell at high prices when it rebounded under pressure at 3400 during the day.The gold 1-hour moving average continued to sell downward dead cross patterns, and the gold buying rebound was weak. It was under pressure at 3400 for many times in the past two days and began to fall. The short-term 3400 line of gold has become a strong resistance. If gold buying cannot break through 3400 strongly, then gold buying will be difficult to improve. It is likely that it will still be the main venue for gold selling. Gold rebounded at 3400 during the day and continued to sell at high prices.
Operation ideas:
Short-term gold 3365-3368 buy, stop loss 3356, target 3390-3440;
Short-term gold 3395-3398 sell, stop loss 3407, target 3370-3350;
Key points:
First support level: 3368, second support level: 3354, third support level: 3333
First resistance level: 3396, second resistance level: 3408, third resistance level: 3420

The interest rate remains volatile,and the gold operation layout📰 Impact of news:
1. Initial jobless claims data
2. US-Iran conflict continues
3. Pay attention to the Fed's decision
📈 Market analysis:
Gold has been trading sideways recently. It is expected that there will not be much fluctuation before today's Fed interest rate information and Powell's speech. It is expected to continue to fluctuate in the range of 3405-3365. At the same time, the escalation of geopolitical conflicts in the short term is also a point we need to pay attention to.
🏅 Trading strategies:
BUY 3380-3375-3365-3355
TP 3395-3400-3405
SELL 3405-3395
TP 3380-3375-3360
If you agree with this view, or have a better idea, please leave a message in the comment area. I look forward to hearing different voices.
TVC:GOLD FXOPEN:XAUUSD FOREXCOM:XAUUSD FX:XAUUSD OANDA:XAUUSD

Interest rate decision bearish
Today, the focus is on the Fed's latest interest rate decision, which will be announced on Wednesday. The market generally expects that it will maintain the policy rate range of 4.25%-4.50%. Trump recently asked the Fed to cut interest rates by one percentage point immediately, but the market reacted cautiously, believing that a sharp rate cut may increase inflation risks, especially in the context of Middle East conflicts pushing up oil prices. Fed Chairman Powell's statement at the press conference will become the focus of market attention. The market expects the Fed to maintain a cautious and patient tone, and the guidance on the interest rate outlook may be vague.
Technically, in terms of support, the 10-day moving average and the 20-day moving average form important support near 3464/3463 and 3445 respectively. In terms of resistance, yesterday's high near 3403 constitutes a key resistance above. If gold prices want to reverse the current weak pattern, they need to successfully break through this resistance level to open up upward space.
Today's detailed operation strategy
Short gold rebounds near 3400, defense 3410, target 3380-3364
Long gold falls back near 3364, defense 3356, target 3380-3400

Wide range fluctuations continue, the latest layout of gold📰 Impact of news:
1. Initial jobless claims data
2. US-Iran conflict continues
3. Pay attention to the Fed's decision
📈 Market analysis:
At present, the gold price is testing the 3380 line again, and the strong support below is 3365-3355. As long as it does not fall below this key support, the bulls will remain strong. At the same time, the two key points of 3405 and 3420 above are still short-term resistance. Breaking through may directly test 3450. In the short term, gold fluctuates repeatedly at the 3405-3365 level, temporarily maintaining a high-altitude low-multiple cycle. There is also initial jobless claims data released today. At the same time, the geopolitical situation in the short term is severe, so we need to be cautious. In addition, the New York Stock Exchange will be closed tomorrow. The focus this week is mainly on Friday, especially when it is superimposed with the Fed's interest rate decision, we need to be vigilant about the transmission effect of sudden changes in liquidity on the market.
🏅 Trading strategies:
BUY 3380-3365-3355
TP 33395-3400-3405
SELL 3405-3390
TP 3380-3360
If you agree with this view, or have a better idea, please leave a message in the comment area. I look forward to hearing different voices.
OANDA:XAUUSD FX:XAUUSD FOREXCOM:XAUUSD FXOPEN:XAUUSD TVC:GOLD

Golden investment opportunity emerges!Market news:
In the early Asian session on Wednesday (June 18), spot gold fluctuated in a narrow range and is currently trading around $3,380 per ounce. As the "safe haven king" in the global financial market, international gold has shown resilience in bottoming out and rebounding under the dual drive of recent geopolitical and economic uncertainties. The rise in London gold prices is inseparable from the fueling of tensions in the Middle East. The conflict between Iran and Israel has entered its fifth day, and geopolitical risks continue to heat up, injecting strong momentum into safe-haven assets.Although geopolitical risks have pushed up the safe-haven demand for gold, the strong performance of the US dollar has significantly suppressed gold prices. Against the backdrop of escalating conflicts in the Middle East, the dollar's renewed support and the Federal Reserve's cautious attitude have become important factors limiting the upward trend of international gold prices. Investors need to pay close attention to the Fed's policy guidance, the trend of the US dollar and the latest developments in the Middle East. In addition, the initial value of the annualized total number of US building permits in May and the annualized total number of US new home starts in May will also be released on this trading day, and investors also need to pay attention.
Technical Review:
Gold bottomed out and rebounded, and adjusted widely and fluctuated fiercely. The daily chart closed with a positive cross line, and the RSI indicator's central axis 50 value flattened. The price dropped to the MA10 daily average line of 3366 and rebounded sharply, reaching 3396 in the Asian session. The short-term four-hour chart moving average is glued together, and the RSI indicator's central axis is adjusted. The hourly chart Bollinger Bands are closed, and the moving averages are glued together. Technically, gold maintains a wide range of fluctuations and short-term participation.The intraday trend and the weekly chart's high point gradually move downward, which shows that the control of selling in the market is gradually increasing. Although the gold price failed to continue the buying trend at the beginning of the week, it does not mean that buying is completely dominant, especially before the announcement of the Federal Reserve's interest rate decision on Thursday this week, the market still has strong uncertainty about the future trend!
Today's analysis:
After gold bottomed out, it began to fluctuate again, but the overall trend is still selling. The gold rebound is still under pressure at 3400 and began to fall back. In the short term, gold 3400 is still an important resistance. Gold continues to sell at high prices before it effectively breaks through 3400. Today’s market is once again blocked when it hits a high point. The current intraday high is around 3396. The market has been operating under the pressure of 3400 in the past two days, and there is no sign of the market standing above 3400. Therefore, the 3400 barrier is still an effective pressure point. As long as it does not break through and stabilize at 3400 today, the rebound is an opportunity for us to sell!
Operation ideas:
Short-term gold 3365-3370 buy, stop loss 3356, target 3390-3440;
Short-term gold 3390-3400 sell, stop loss 3408, target 3370-3350;
Key points:
First support level: 3363, second support level: 3346, third support level: 3333
First resistance level: 3400, second resistance level: 3408, third resistance level: 3420

GOLD/USD Bearish Rejection at ResistanceGOLD/USD Bearish Rejection at Resistance 📉🟥
🔍 Technical Analysis Overview:
The GOLD/USD chart shows a clear bearish rejection pattern forming near the resistance zone around $3,450, marked with red arrows. After price tested this level twice, strong selling pressure appeared, resulting in a sharp decline.
📌 Key Observations:
🔴 Resistance Zone:
Price was rejected from the resistance area around $3,450 twice, indicating strong seller presence.
Double top-like behavior seen with lower highs confirming weakening bullish momentum.
🟠 Support Zone:
A well-respected support level near $3,250 has been identified based on past reaction (highlighted with orange circles).
Price previously bounced twice from this zone, validating it as a strong support level.
🎯 Target Level:
A near-term target of $3,305.586 is marked, which aligns with previous reaction zones and short-term structure support.
If momentum continues, a deeper push toward $3,250 support is probable.
📉 Bearish Bias Justified By:
Clear rejection from resistance
Lower high formation
Current consolidation with downward bias
Possible breakout to downside if $3,305 fails to hold
⚠️ Risk Note:
If price retraces and breaks back above $3,400 with volume, the bearish setup will be invalidated.
📊 Conclusion:
The chart favors bearish continuation with a primary target around $3,305, and extended downside to $3,250 if bearish pressure sustains. Traders should watch for bearish confirmation patterns below current price before engaging.
🔽 Resistance: $3,450
🔼 Support: $3,250
🎯 Target: $3,305

Goldman and BofA agree: The dollar is losing its edgeGoldman Sachs now expects the EUR/USD to hit 1.20 by the end of the year. While this prediction draws comparisons to the 2017 rally in the pair, Goldman notes a key difference. This time, the pricing reflects pessimism in the US dollar, rather than optimism in the euro.
Bank of America seemingly agrees and warns that even a “hawkish” dot plot at this week’s FOMC meeting, where Fed officials signal fewer rate cuts, may only cause a brief bout of euro weakness against the dollar.
EUR/USD has recently broken out of a long-term descending triangle pattern, which capped price action from mid-April through early June, aligning with Goldman Sachs’ and BofA’s view of a broad EUR strength/ USD weakness.
This recent pullback to the 1.1480 area is a retest of former resistance turned support, suggesting a potential continuation pattern if buyers defend this level.

Falling below 3380,testing 3365,the low position remains bullish📰 Impact of news:
1. Geopolitical tensions in the Middle East
2. Iran nuclear talks
3. Retail sales data
📈 Market analysis:
After rebounding to the 3400 line, gold encountered resistance and fell back to test the support level of 3380. Although it was very close to the point of 3405 we gave, I did not enter the trade because gold has been in the middle section in the short term and has not rebounded to the ideal point.
There are too many long orders at high levels in gold. The international situation is so tense that gold is still slowly declining, but the geopolitical situation is still continuing. In addition, the retail sales data is bullish. Then, as the trading strategy given at noon, it is expected to test the short-term support of 3365-3355 below. I will consider going long in this range
🏅 Trading strategies:
BUY 3365-3355
TP 3380-3390-3400
If you agree with this view, or have a better idea, please leave a message in the comment area. I look forward to hearing different voices.
TVC:GOLD FXOPEN:XAUUSD FOREXCOM:XAUUSD FX:XAUUSD OANDA:XAUUSD

Forward-looking trading, focus on 3380 support📰 Impact of news:
1. Geopolitical tensions in the Middle East
2. Iran nuclear talks
3. Retail sales data
📈 Market analysis:
Gold prices are currently in a narrow range of fluctuations again, and the signal of Iran restarting nuclear negotiations has weakened risk aversion, triggering a correction in gold prices during the session, but tensions in the Middle East remain an uncertain factor. In the short term, we still need to focus on the breakthrough of the 3380 support line. If the 3380 support line is strong, we can still maintain a long trading idea in the short term and look to 3400. On the contrary, once it falls below, it is expected to look to the 3350 line. Pay attention to the breakthrough of 3400 on the upside. If the Asian and European sessions cannot effectively break through this short-term resistance, gold will continue to fluctuate.
🏅 Trading strategies:
BUY 3380-3370
TP 3390-3400-3450
SELL 3400-3390
TP 3380-3370-3350
If you agree with this view, or have a better idea, please leave a message in the comment area. I look forward to hearing different voices.
OANDA:XAUUSD FX:XAUUSD FOREXCOM:XAUUSD FXOPEN:XAUUSD TVC:GOLD

GOLD/USD Bearish Rejection at Resistance ZoneGOLD/USD Bearish Rejection at Resistance Zone 📉🟥
📊 Technical Overview:
The chart for GOLD/USD shows a clear price action behavior between a well-defined resistance zone (~3,480–3,510) and a support zone (~3,260–3,280).
🔻 Bearish Signals:
The price has tested the resistance zone multiple times (highlighted with red arrows and orange circles) but failed to break above it, indicating strong selling pressure.
The current price action suggests another lower high formation, which is a bearish signal 📉.
Recent candles are rejecting the upward move, pointing to potential downside movement.
🟩 Support Confirmation:
Previous reactions from the support zone (green arrows) show that buyers have consistently stepped in near the 3,260–3,280 range.
This level remains a key demand zone where a bounce might be expected.
🔁 Outlook:
If the price continues to reject the resistance and follows the pattern, we might see another drop towards the support area.
A break below the support zone would confirm a bearish breakout and could open the door to deeper downside targets.
📌 Conclusion:
GOLD/USD is trading within a range, but the repeated failures at resistance suggest bearish momentum might take control in the short term. A move back toward the support zone is likely unless a breakout above resistance occurs.
📉 Resistance: 3,480–3,510
🟩 Support: 3,260–3,280
🔍 Bias: Short-term Bearish unless resistance breaks

Is gold a short-term correction or a bull market turning point?Market news:
The London gold price has experienced a significant correction after hitting an eight-week high. Spot gold fell more than 1% on Monday, wiping out all the gains of last Friday. However, the escalation of geopolitical tensions in the Middle East, especially the continued conflict between Israel and Iran, still provides support for international gold prices. The upcoming Federal Reserve policy meeting has become the focus of market attention.The continued tension in the Middle East is an important driving factor for the recent fluctuations in spot gold. The conflict between Israel and Iran has escalated significantly since June 12. Israel's air strikes on the Iranian National Radio and Television Building and the Natanz uranium enrichment plant have caused serious damage to Iran's nuclear facilities. In addition to geopolitical factors, the policy trends of the Federal Reserve also have an important impact on international gold.For gold, the Federal Reserve's maintenance of high interest rates usually puts pressure on its price, because gold, as an interest-free asset, is less attractive in a high-interest rate environment. However, geopolitical risks and rising inflation expectations may offset some of the negative impacts, causing gold prices to remain volatile in the short term. Investors should pay close attention to the latest developments in the situation between Israel and Iran, the results of the G7 summit, and the Federal Reserve's economic forecasts, while being wary of the short-term impact of market sentiment and technical factors on gold prices. The monthly rate of US retail sales (commonly known as "horror data") will also be released on this trading day, and investors also need to pay close attention!
Technical review:
Technically, the daily price of gold is still running above the MA10/7-day moving average at 3364, the RSI indicator is above the value of the middle axis 50, and the price is running in the upper track of the Bollinger Band channel. The short-term four-hour chart MA10/7-day moving average high 3420 dead cross opens downward, the price pulls back to the middle track of the Bollinger Band, and the RSI indicator retreats to the middle axis. The short-term formation is a bearish shock and fall, but the gold price is still in the buying structure channel on the daily and weekly charts. The main idea of today's trading is to sell at a high price and buy at a low price! Gold began to pull back when the situation eased. The fermentation of this round of news was relatively restrained by large funds, and did not test the high point of 3500 upwards. Overall, the increase in gold prices was not large, and there was still a process of pulling. The fundamentals have not changed, and gold is still in a bull market. As we said before, if we keep above the key point of 3400, gold will continue to be bought. Now that it has fallen below 3400, the short-term has gone out of the small-level top, and the market is no longer so strong. For our short-term operations, the short-term correction of gold prices should focus on the daily cycle MA5 support and the weekly level MA5 support to buy!
Today's analysis:
Gold continues to weaken in the short term. After the rapid decline last night, the rebound strength is not strong at all. It is obvious that there is a large selling pressure above. For the market that broke the original upward trend, we also said last night that the decline is not very large. It just changed from buying to shock. Our intraday operations can be sold in the short term first!Although gold has fallen below 3400, the short-term direction has changed, but the general direction has not changed. It is still buying. In the future, we still have the opportunity to look at the high point of 3500, but we have to wait for the bottom to stabilize before we go to buy the bottom. I will say later that in the current market, we can only follow the trend. We will do whatever the market goes!
Operation ideas:
Buy short-term gold at 3383-3385, stop loss at 3372, target at 3420-3440;
Sell short-term gold at 3420-3423, stop loss at 3432, target at 3390-3370;
Key points:
First support level: 3383, second support level: 3372, third support level: 3353
First resistance level: 3418, second resistance level: 3430, third resistance level: 3450

Have you seized the golden opportunity again and again?Today, the strength of gold is very weak. It only rushed up at the opening, and quickly fell below the 3400 mark. Keeping above the key point of 3400, gold continues to be bullish. Now that it has fallen below 3400, the short-term has gone out of the small-level top, and the market is no longer so strong. For our short-term operations, the short-term correction of gold prices focuses on the daily cycle MA5 support, and the weekly MA5 support is long. The rebound focuses on the 3403-3408 resistance card. The rebound can be followed by the short-term! Although gold has fallen below 3400, the short-term direction has changed, but the general direction has not changed. It is still bullish. In the future, we still have the opportunity to look at the high point of 3500, but we have to wait for the bottom to stabilize. Now we can only follow the trend. We will do what the market does.
From a technical point of view, the current macd high dead cross in 4 hours has a large volume, and the smart indicator sto is oversold, which represents the 4-hour shock trend. The current bollinger band three-track shrinkage in 4 hours also represents the range compression. At present, the upper pressure of 4 hours is located at the adhesion point of the middle rail and the moving average MA10 at 3404-3409, while the support corresponds to the moving average MA30 and MA10 near the 3380-3363 line. From the current 4 hours, if the price is to fall directly, the rebound will not exceed the 3420-3422.5 line. The current macd dead cross of the gold 1-hour line is shrinking and sticking, and the smart indicator sto is running downward, indicating that the hourly line continues to fluctuate weakly. What we need to pay attention to now is the adhesion pressure of the upper moving average MA60 and MA30 corresponding to the 3412 line. Pay attention to the resistance of 3403 in the short term. Today's short-term operation of gold recommends rebound shorting as the main, and callback long as the auxiliary, and pay attention to the support of 3380-3370 in the short term.

3400 3380 are the two points that determine the trend of gold📰 Impact of news:
1. Geopolitical risks
2. Expected Fed policy
📈 Market analysis:
This week, the Federal Reserve's policy meeting, retail sales data, initial jobless claims and geopolitical situation will be the core factors affecting global markets. In the short term, gold rebounded after hitting the 3383 line. This round of decline was relatively rapid. At the same time, there is a certain resistance at the 3405-3410 line above in the short term, which is also the main reason for our long orders to leave the market. In the short term, it is recommended to first look at the support situation at the 3380 line below, and then enter the long order after obtaining effective support above this position. On the contrary, if it falls below this short-term support, the gold price is expected to fall to the 3350 mark! For the evening layout, it is recommended to focus on the 3400 long-short watershed, pay attention to the 3410 line of resistance, and pay attention to the 3380 line of support below.
🏅 Trading strategies:
BUY 3390-3380
TP 3400-3410-3420
SELL 3400-3390
TP 3380-3360-3350
If you agree with this view, or have a better idea, please leave a message in the comment area. I look forward to hearing different voices.
TVC:GOLD FXOPEN:XAUUSD FOREXCOM:XAUUSD FX:XAUUSD OANDA:XAUUSD

Gold----Buy near 3417, target 3440-3450Gold market analysis:
The continuous bombing of Israel and Iran for several days has allowed gold to stand on 3400 again. The big tombstone before the weekly line was wiped out, and the weekly line closed with a big positive line again, and formed a positive-enclosing-negative pattern. This is the long-term rebound caused by geopolitical factors. There is an old saying in the market that cannonballs are always worth a lot of gold. We are not sure how long the situation between Iran and Israel will last, but what is certain is that the buying situation is obvious. The next operation is to follow the buying. I estimate that gold will continue to rise this week. In addition, under such fundamentals that control the market, we must strictly carry out each order with a loss. The market will not change the trend because you resist the order. Following the trend is the kingly way.
In the Asian session, we first focus on the hourly support of 3417 and the shape support of 3419. The position of 3417 is also the watershed of strength and weakness in the short term. If it breaks, it will reach around 3407. In addition, 3451 is the top of the daily line. There was a dive at this position before. If the daily line cannot stand on it for a long time, there is also the possibility of another dive. 3407 is a hurdle in the big cycle. If it breaks, it may bring a waterfall drop.
Support 3417, strong support 3407, suppression 3451, the watershed of strength and weakness in the market is 3417.
Fundamental analysis:
There are many fundamental analyses and data in the recent period. Geopolitical factors are the main reason for its violent fluctuations. In addition, there is a holiday in the United States this week, and there is also a Federal Reserve interest rate result.
Operation suggestion:
Gold----Buy near 3417, target 3440-3450
