Goldman Sachs | Detailed Fundamental Analysis Investment banking behemoth Goldman Sachs recently announced its intention to acquire GreenSky, a sales and "buy-now-pay-later" fintech company, in an all-stock deal worth about $2.2 billion. GreenSky is a major intermediary for home improvement loans and planned transactions, and allows customers to make purchases and repay them in multiple payments over some time.
GreenSky currently serves a $9 billion loan portfolio and has served about 4 million consumers with about $30 billion in loans since launch. Here are three reasons why Goldman is entering the "buy-now-pay-later" realm and acquiring GreenSky.
First, to help continue Marcus' growth.
Over the past several years, GS has been looking to grow its franchise in consumer lending to generate more stable revenues that can be volatile in investment banking. An important part of that strategy was the bank's launch of its digital bank, Marcus, which offers high-yield savings accounts, loans, and credit cards, and eventually plans to offer checking accounts as well.
GreenSky will help Marcus expand its offering of credit products, but apart from that, it will help the bank increase its overall user base. Marcus currently has about 8 million customers.
GreenSky provides a low-cost strategy for acquiring not only more customers who will take high-profit loans, but also customers who can be cross-sold other Marcus products - whether it's a savings or checking account or perhaps a mortgage.
In a presentation on the acquisition, Goldman said GreenSky represents an opportunity to capture the $430 billion home repair market, which provides 20% plus returns at scale.
GreenSky has also created a network of more than 10,000 salespeople with whom it works to transact and engage customers at the point of sale. This segment could also be valuable in the future. Goldman already offers many capital markets and investment banking products that it could sell to these customers.
And who knows, maybe at some point the bank will expand its consumer franchise into business banking. Of course, this is not projected or anticipated, but this segment could be a great starting point if Goldman ever decides to do so.
Second, it would help improve the bank's stability.
Most fintech companies tend to struggle to generate the profitability and returns that shareholders want because they are acting as a bank without being a licensed bank. Not being a bank has its advantages, most notably less regulatory oversight, which allows these fast-moving technology companies to be more nimble and acquire customers in a much more efficient way than a traditional bank.
But the disadvantage is that fintechs cannot collect cheap deposits to finance loans and therefore have to count on partner banks and warehouse space, which increases the cost of financing. GreenSky also relies on partner banks for its loans, which probably costs them as well.
With the backing of a major bank like Goldman, GreenSky won't have to worry as much about the financing aspect, especially if Marcus proves successful in collecting deposits. The bank will also probably be able -- if it wants to -- to put these high-interest loans on its balance sheet and collect regular monthly interest payments.
This is more profitable than selling loans for fees, on which GreenSky earns most of its income. Goldman will also be able to offer GreenSky more resources to improve its technology platform.
Well, third, it's a pretty good purchase price.
Goldman's $2.2 billion offer sent GreenSky's stock soaring more than 50 percent, but the purchase price is not such a crazy valuation for a somewhat promising fintech company operating on a "buy-now-pay-later" basis, a sector that is now attracting a lot of investor interest. On a prospective basis and after the Goldman announcement, GreenSky currently trades at 3.8 to sales, 20 to earnings, and 14.3 to earnings before interest, taxes, depreciation, and amortization (EBITDA).
As Marcus and the consumer banking franchise seem to be on the right track, this Goldman deal is to everyone's liking. It offers the consumer banking business a whole new customer base with a low acquisition rate to which it can hopefully cross-sell its other consumer banking products. In addition, the price Goldman is paying is reasonable, given how large the bank is and how the bank's stability should make GreenSky's operations more efficient and profitable.
Goldmansachs

GS Daily TimeframeSNIPER STRATEGY (new version)
It works ALMOST ON ANY CHART.
It produces Weak, Medium and Strong signals based on consisting elements.
NOT ALL TARGETS CAN BE ACHIEVED, let's make that clear.
TARGETS OR ENTRY PRICES ARE STRONG SUPPORT AND RESISTANCE LEVELS.
ENTRY PRICE BLACK COLOR
TARGETS GREEN COLOR
STOP LOSS RED COLOR
DO NOT USE THIS STROTEGY FOR LEVERAGED TRADING.
It will not give you the whole wave like any other strategy out there but it will give you a huge part of the wave.
The BEST TIMEFRAMES for this strategy are Daily, Weekly and Monthly however it can work on any timeframe.
Consider those points and you will have a huge advantage in the market.
There is a lot more about this strategy.
It can predict possible target and also give you almost exact buy or sell time on the spot.
I am developing it even more so stay tuned and start to follow me for more signals and forecasts.
START BELIEVING AND GOOD LUCK
HADIMOZAYAN

GOLDMAN SACHS FLAG AND POLE GOLDMAN SACHS DAILY TF GIVING A FLAG AND POLE WITH $43 UPSIDE DURING AN EARNINGS SEASON.
FEEL FREE TO DROP IN YOUR FEEDBACK..
Thanks

JPM swing idea$375 call July 23rd exp. Sitting above the 200 ma w a MACD crossover and parabolic SARS showing. Nice swing to the upside Price Target $385-$388


Thanks billionaires friend FED $GS bullshit almost overThanks billionaires friend FED $GS bullshit almost over

GS - $384 PT C&H BreakoutAs you can see we have a C&H breakout with an implied price target of $384 on this pattern. May see a re-test of the neckline and if so, this will be your best entry on confirmation that this becomes support. GL!
Complete Market Cycle x BTC Part 9 Possibly the most prolific take on the future of the coin given the current, controversial period of its existence. Here we see a complete market cycle based on the Elliott Wave theory. The layout is limited to primary and intermediate waves only with exception to the emphasis placed on the leading diagonal pattern. The motive VS correctional distinction is also highlighted with 5 intermediate motive waves as well as 3 intermediate correctional waves. The price right now resides in a symmetrical triangle biased to a reversal with a possible false breakout - nothing further than 28k. Thus I strongly believe the 3rd wave of the primary cycle shall follow, taking Bitcoin to new highs and to the moon !

Silver 4 hour Buy :)First position very small. Will be adding to idea as plays out as currently the 10 years are not in my favour. Lets wait and see with this one. Looks nice, but not the best short term fundamentals. Long term bullish on silver anyways due to fundamental uses.

$FSR Goldmans Sachs Releases Bias To Save Trade Desk! UPDATE! $FSR Goldman can sack it, they released a sell rating this morning to 10 citing overcrowding and unrealistic Q4 Targets. This is flat out wrong. Hoping to a see this gap filled in spite of them as there are more buy ratings than sell. Most in the $30s and $40s.

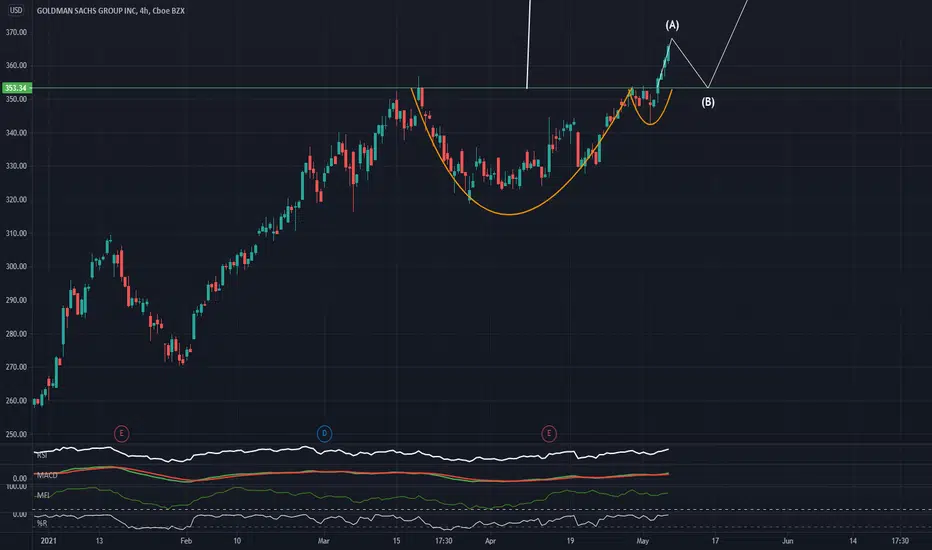
$GS Before earningsGS has put in a larger wave 1, 2 o the daily timeframe, and it seems that this near term pullback that we've experienced could be a wave 3 to 4, looking to break higher in the following days. Indicators show and upwards trend, ready to test those highs again. The only bearish divergence is the conversion wave on the Ichimoku indicator, crossing lower over the last few days. Whether this is a corrective wave or not, due to the recent low on the daily chart, we are still prime to correct to a wave around the .382 or .236 fib levels. If we break higher, then my target of 370.35 is still on target. This is all dependent on ER coming up this week.

GOLDMAN SACHS LOOK FOR DOWNSIDEAS YOU CAN SEE C WAVE OF SECONDARY ABC CORRECTION LOOKS COMPLETE. I CAN EXPECT PRICE TO COME TO DOWNSIDE TO COMPLETE BIGGER PRIMARY CORRECTION PATTERN. YOU CAN LOOK FOR SELL SETUPS ON LOWER TIME FRAME FOR BETTER ENTRY.
Take care & Thanks.

goldman sachs... life on the edgegoldman has moved very high, very fast
any bad news or a reversal in trend with profit taking could see this fall off of a cliff

Divergence back to FX – Goldman SachsGoldman Sachs discussed the importance of divergence in a recent note to clients, arguing it will be a key driver of FX for the remainder of the year.
Goldman Sachs explains:
We think this divergence will be an important factor for G10 FX this year. It will help inform currencies respond to a faster or slower recovery than expected, and contribute to a different path for policy in normally closely-linked currency pairs.
The expected timing of policy normalization should support CAD and NOK (both components of our USD short basket) while it may eventually hold back GBP (which we currently recommend vs CHF, due to the UK’s successful vaccine rollout).

#Bitcoin: Still showing bullish signs, with strong news week.After Bitcoins crazy run up from 30,000-58,000 we saw an almost $10,000 retracement with many traders reacting in panic.
But is the run really over? I doubt it.
__________________________________________________________________________________________________
Below i am going to explain some basic reasons why I think we are going upwards from here:
1. Institutional Interest
Many "High Profile" buyers are still interested and purchasing BItcoin such as Square, Microstrategy & Grayscale Investments.
2. Bullish Pattern
The Falling Wedge is a strong Bullish Reversal Pattern that may give us a good sign buyers are now in control of this market again.
3. Similar Price Action
The current Falling Wedge & Price Action is quite similar to that of $33,000 area, we had a Falling Wedge, aswell as institutional buyers towards the bottom of the pattern. Just like we are currently, as marked on the Falling Wedge forming from $58,000.
__________________________________________________________________________________________________
1. Institutional Interest
Below I am listing current news which I think is definitely supporting the idea that the Buyers are in control:
The news is flowing HEAVY around Bitcoin and quite positive! The big guys are interested, and everyone is trying to get a piece of the pie now. The Demand outweighs the Supply.
Microstrategy Purchases more Bitcoin:
twitter.com
JP Morgan recommends 1% in Bitcoin:
techstory.in
Goldman Sachs opens Bitcoin trading again:
markets.businessinsider.com
Twitter Announces $1.25 Billion Convetible Notes Offering (Founder is a fan of Bitcoin, and Microstrategy had a similar offering to generate capital to purchase more Bitcoin:
apnews.com
Square payments buys more Bitcoin:
www.cnbc.com
Cititbank states Bitcoin could become the currency of Global Trade:
www.theblockcrypto.com
__________________________________________________________________________________________________
2. Falling Wedge Pattern & Similarities in Price Action
In this pattern price swings 5 times between two converging trendlines while falling to form a “Wedge", this a potential sign the buyers are slowly taking control and we see a "breakout" to confirm this"
Works extremely well with Bulllish Divergence and the pattern has a high sucess rate. It often sweeps the lows at A before breaking out and this is the ideal entry point followed by the bullish retest (B).
Target is the top area of the pattern. Pattern tends to break out when around 60% complete and commonly off the 0.78 fibonacci level.
In the below images you can see the similarities between late January & Now. In January we had the Falling Wedge Pattern with a Tesla purchase, and now we have a similar pattern with a few other big names purchasing (Microstrategy, Square).
First example of the Falling Wedge (Note how Elon Musk purchased around the Bottom of this Pattern before the upwards move began):
Here we can see how once we had the breakout we had a strong upmove:
Here we can see a comparison of the current pattern:
__________________________________________________________________________________________________
3. Conclusion
The most important thing to consider when investing and trading Bitcoin is the Fundamentals & Supply & Demand.. currently there is a huge Demand still for buyers of the Cryptocurrency as you can see from the above articles (they are all recent) and the potential signs on the chart as well the buyers are regaining control.. The use case for Bitcoin grows strong with the FED still printing and seeing more and more big names getting behind it every week.
These factors alone give us a high probability of a sustained upwards movement from here.


GOLDGold has been bearish since August 2020. Although, it can be clearly seen that the overview of the market on weekly is bullish since May 2019. However, (continue thread below)....

gold Due to the changing terend in the price index of the dollar.
i will be happy if you have a theoretical elliot wave comment and help for better analysis.

GS tryna dig a hole to China (for now)Boy do I love gartleys.
Goldman Sachs hit the double top. I predict the value will fall for a few months. But remember gartley is a harmonic pattern rooted in human emotion and this is a fairly large scale to be applying that sort of TA to.
For now I think it's a safe bet to assume the value will fall over the next few months. Target between $242 and $214 if the trend continues.
What do you think?

GOLDMAN SACHS Trend Analysis + LEVELS GSGS is going through the correction. This should be a good opportunity to open LONG TERM positions for HOLDERS.
ENTRY LEVELS LONG:
$264
$252
$222 - STRONG BUY

Oldman Sachs 👴🏾Reddit, WallStreetBets, GameStop, Silver, Dogecoin, Shortselling, Twitter and so on. These key words are currently dominating the financial world. But what comes quickly, fades quickly, too. Let us not be distracted that there are thousands of well-managed and strongly positioned companies that await your investments. While many assets’ future already are gambles in themselves, there are some assets that have withstood time and will almost surely back you in retirement or pay off your children’s and grandchildren’s tuition fees. One of those assets is the Goldman Sachs stock. Currently declining, there might be a great opportunity opening up for an entry within the yellow box. Between $260.49 and $269.12, we expect a turnaround and a soaring Goldman. On its way up, it will surpass the marks of $281.90 and even $317,76, aiming for new peaks. It is important to note, however, that the price should not drop below $260.49, in order to keep the current scenario alive.
Follow us for daily updates!

