Gold is finishing at a high level to resist the fall! The bullis
📌 Driving events
U.S. President Trump said on Monday that he was exploring the possibility of temporarily exempting tariffs on imported cars and parts to give auto companies more time to establish production bases in the United States.
New York Fed: The unemployment rate is expected to rise to the highest level since April 2020 in March. In March, households were more pessimistic about employment and future income. The expected inflation rate for the next five years is 2.9%, down from 3% in February.
Geopolitical situation:
It was learned on the 14th local time that Israeli officials said that Israel and the Palestinian Islamic Resistance Movement (Hamas) still have great differences on the ceasefire in Gaza. The official said that compared with the previous negotiating position, Hamas seems willing to release more Israeli detainees, but if Hamas insists on requiring all parties to guarantee that Israel must stop waging war in the Gaza Strip after the ceasefire, it will still be difficult to promote an agreement. The official expects Hamas to respond to the new ceasefire proposal in the next few days.
📊Comment Analysis
The hourly level shows that the short-term gold price has fallen from a high level and gradually fell into a narrow range above the hourly 60-day moving average support level. The current hourly level indicators are narrowing, maintaining a short-term shock guide reference. The 5-day moving average and the 10-day moving average at the four-hour level are arranged in a downward cross, maintaining the four-hour level peak signal. The short-term decline gradually brings about the four-hour RSI mean reversion, forming a four-hour level adjustment trend. The gold price has risen and fallen to maintain a shock downward trend, which has not changed the medium- and long-term upward trend. Be cautious to maintain a bullish shock trading strategy during the day.
💰Strategy package
Long order:
Aggressive participation at 3185-3195, profit target above 3210
Steady participation at 3175-3185, profit target above 3195
Short order:
Aggressive participation at 3250, profit target below 3230
⭐️Note: Labaron hopes that traders can properly manage their capital
- Choose the number of lots that matches your capital
- Profit equals 4-7% of the capital account
- Stop loss equals 1-3% of the capital account
Goldmansachs

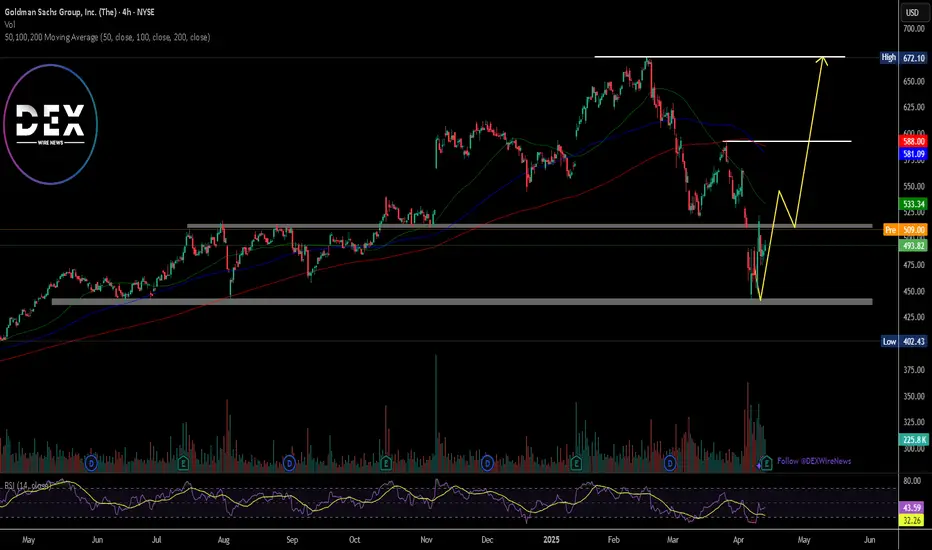
Just In: The Goldman Sachs Group, Inc. (GS) Set for Breakout The Goldman Sachs Group, Inc. (GS) shares is set for a breakout today as the firm smashes Q1 Estimates leading to a 2.45% surge in Monday's premarket trading.
Reports Overview
Goldman Sachs delivered a strong first-quarter performance, beating Wall Street expectations on both earnings and revenue, thanks to a record-setting quarter in equities trading. The bank posted earnings of $14.12 per share versus an expected $12.35, with revenue reaching $15.06 billion compared to forecasts of $14.81 billion.
Financial Performance
In 2024, The Goldman Sachs Group's revenue was $52.16 billion, an increase of 15.34% compared to the previous year's $45.23 billion. Earnings were $13.48 billion, an increase of 71.52%.
Analyst Forecast
According to 16 analysts, the average rating for GS stock is "Buy." The 12-month stock price forecast is $593.43, which is an increase of 20.02% from the latest price.
Technical Outlook
Prior our last analysis on NYSE:GS stock, the asset is already approaching the short term resistant point and a break above that pivot would cement the path for a bullish campaign for NYSE:GS shares . As hinted by the RSI at 43, NYSE:GS shares has more room to capitalize on the dip and pull on a bullish campaign today.
All eyes are set on the $520 level, should NYSE:GS shares break that pivot, a bullish breakout might be inevitable.
Gold price hits new high, 3216 as the dividing lineGold prices rose strongly by nearly $276 in three trading days, and broke through historical highs one after another. There is no highest, only higher.
There are many similar points in the rise, which can be summarized into five points. The first is the continued rise in the early trading and breaking through the new high. The second is the 0.382 position of the space adjustment and the same amplitude switching of the space. The third is the wandering back and forth sweep of the European session. The fourth is the flash of good points. The fifth is to learn to stop when you are ahead.
Combining these five points to look at the market situation, the gold price continues to rise. Last Friday, it closed directly at the high of 3237-3238 area.
Today The price opened lower in the morning and touched 3210, and hit a new high of 3245.6. But this time it was different. After the high, it fell back. The rise was 30 US dollars, and the high fell back 25 US dollars. Basically, the rise was as much as the fall. In the afternoon, the resistance of 3238 was confirmed for the second time, and it fell 22 US dollars again to find 3216, which was basically recovered.
The overall trend will be more adjusted. The cooperation between the high fall and the bottom recovery will provide momentum for the start of a new round of market.
Specifically, the key points to note are:
1. The correction range of the market space is at least 30 US dollars, and the start is at least 60 US dollars. Instead of focusing on the high and low issues, we should grasp the present.
2. The daily and weekly lines are rising strongly, and the indicators and patterns are overloaded. At present, only the direction is referenced; the four-hour pattern opening situation, the lifeline position is slightly far away, 3154 is close to the support point 3151 area that was stepped back late at night, and together they become the spatial dividing line. The resistance above is 3270-3275 and 3299.
3. The hourly chart pattern closed and flattened. Today's white market has been running back and forth around the upper and lower rails. The current pattern further closed the range of 3242-3216. Break through this space and then look at the space switch, and then cooperate with the small cycle double-line upper rail position 3194 area. If the price breaks the early low of 3210, it will switch space downward.
4. As shown in the figure, the price last week accelerated the rise and broke through 3190, and last Friday, it repeatedly broke through the new high around 3210, first the new high of 3238 (looking for 3210), then the new high of 3245 (looking for 3210), and then the new high of 3245.6
Now the price is down to 3216, which is also the starting point of the Asian session
Using 3216 as the switching point, the current sweeping space is about 30 US dollars, and the subsequent price breakthrough will switch the space of 30 US dollars
Focus on 3276-3278 upwards and 3186-3188 downwards
And it is very interesting that the 0.382 position of the latest wave of rise is also at 3187-3188
So, here we need to focus on the key points , with 3246-3216 as the range sweep, breaking through and switching to 30 US dollars, focusing on the support of the 3186-3188 area, and then looking at the upward switching space
In addition, it is necessary to remember that the online position is the 3131-3129 area, the top and bottom conversion position, and it is also a strong resistance level that turns into a strong support level after breaking through. After breaking through, it directly rises unilaterally
In summary, for gold at the beginning of the week, we treat it with a biased adjustment and sweeping idea. Referring to this idea, we have deployed high altitude twice in the 3236-3238 area. As of press time, the price fell to 3216, and all short orders were closed at 3217, waiting for the next plan. Now the price has risen again to 3230, and it continues to sweep, rushing high and falling, bottoming out and rising, which is in line with the above-mentioned biased sweeping and adjustment method.

XAU/USD) Bullish trand analysis Read The ChaptianSMC Trading point update
technical analysis of Gold (XAUUSD) on a 2-hour timeframe, with a bullish outlook. Here's a breakdown
1. Trend & Structure:
Uptrend Channel: Price is moving within a clear upward channel, respecting the trendline.
Higher Highs and Higher Lows: Indicates strong bullish momentum.
2. Key Zones:
Key Support Level (Yellow Box): Around $3,158.49 – this is the "safe entry point" if price pulls back.
First Entry Point: Around $3,222.76 – likely a breakout entry above a local resistance.
Target Point: $3,378.01 – a projected bullish target based on continuation.
3. Indicators:
RSI (14): Currently above 70 (overbought zone), but still climbing. There's bullish strength, but a pullback may occur soon.
200 EMA: Positioned below current price, confirming the bullish bias.
Mr SMC Trading point
4. Expected Scenarios (2 Paths):
Bullish Continuation: Price keeps rising, respecting the uptrend and hitting the target.
Pullback and Bounce: Price may retrace to the support zone or trendline, then bounce back up to target.
Summary of Idea:
This is a buy setup:
Buy at breakout above $3,222.76 (First Entry)
Safer buy at $3,158.49 (Support Re-test)
Target: $3,378.01
Watch RSI for pullback clues.
Pales support boost 🚀 analysis follow)

GOLD Ready to Break Highs Again! 🔥 3058 Level in Sight – Are You Ready? 🔥
📊 Market is following H4 Structure
📈 H4 BMS & OB in Play – Strong Momentum Building!
For detailed analysis & real-time updates, follow our TradingView page! 📍📩

XAU/USD) Bearish trand analysis Read The ChaptianSMC Trading point update
This chart analysis is for Gold Spot (XAU/USD) on the 1-hour timeframe. Here’s a breakdown of the idea shown:
---
Key Points in the Analysis:
1. Current Price:
XAU/USD is around $2,982.92 at the time of the chart.
2. Trend:
The chart suggests a bearish outlook.
Price has been consistently rejected from the yellow supply zone (around 3,020–3,033).
EMA 200 (blue line) is above the current price, confirming downward momentum.
3. Rejection Zone:
Marked in yellow between 3,020 and 3,033. Labeled as “Reject points”.
Price failed to break above this zone multiple times.
4. Breakout Pattern:
Two descending rectangles highlight bearish continuation patterns.
A bearish flag or wedge is visible, followed by a breakout downward.
5. Target Zone:
Highlighted in yellow between 2,900 and 2,921, with target point at 2,920.615.
Price is expected to move down to this level.
6. RSI (Relative Strength Index):
RSI is declining and shows bearish divergence, supporting downside move.
Currently around 39.19, which is closer to oversold territory but still has room to drop.
Mr SMC Trading point
---
Trade Idea Summary:
Bias: Bearish
Entry Area: Rejection near 3,020–3,033 zone
Target: 2,920.615 (highlighted support zone)
Stop Loss: Could be placed above 3,033 (supply zone or EMA 200)
Confluence Factors:
EMA 200 rejection
Bearish RSI divergence
Repeated supply rejection
Breakout from bear flag structures
Pales support boost 🚀 analysis follow)

XAU/USD) Bearish analysis Read The ChaptianSMC Trading point update
This chart analysis of Gold (XAU/USD) on the 2-hour timeframe appears to be a bearish setup based on Smart Money Concepts (SMC). Here's a breakdown
Key Elements:
1. Price Channel Break & CHoCH:
The price was in a rising channel.
A clear Change of Character (CHoCH) occurred after the price broke below the structure, signaling a shift from bullish to bearish.
2. Fair Value Gap (FVG):
There's a bearish Fair Value Gap (FVG) highlighted in the yellow box around the 3,047–3,075 level.
The expectation is that price may retrace into this FVG before continuing downward.
Mr SMC Trading point
3. Target Zone:
A major demand zone or target point is marked around 2,940, indicating a potential bearish move of around -148 points (~4.8%) from the FVG.
4. EMA & RSI:
200 EMA is around 3,047, acting as dynamic resistance now.
RSI is below 40 and trending down, showing bearish momentum with slight bullish divergence, hinting at a short retracement before another drop.
---
Summary of the Idea:
Bias: Bearish
Trade Plan:
Wait for price to retrace into the FVG zone (~3,047–3,075).
Look for bearish confirmation (like bearish engulfing or rejections).
Enter short with a target at 2,940, stop above FVG.
Let me know if you’d like help formulating a trade setup or risk management plan based on this.
Pales support boost 🚀 analysis follow)

Gold (XAUUSD) Bullish Reversal Setup – FVG Entry to EMA 200 ResiThis chart shows a potential bullish setup for Gold (XAUUSD) on the 15-minute timeframe, with some key technical elements and a projected trade idea. Here's a breakdown of the analysis:
1. Current Market Overview
Price: Trading around $3,038.51.
Trend: Recent downtrend followed by a minor recovery.
Indicators:
EMA 200 (Blue): Currently at $3,090.41, acting as a dynamic resistance.
EMA 30 (Red): Positioned below the EMA 200, indicating a still bearish trend but with potential for a pullback.
2. Key Zones & Labels
Limit Entry Zone: Highlighted around $3,025.72 (bottom purple zone)
Labeled as “LIMIT ENTRY”, indicating a potential buy entry.
This area corresponds with a fair value gap (fvg) — often used in smart money concepts as a sign of institutional interest.
Target Zone: Around $3,082.22 (top purple zone)
Labeled as “target point EA”.
Lies just below the EMA 200 resistance level, which is a likely take-profit area for a bullish move.
3. Projected Price Action
A possible bullish retracement is anticipated:
Dip into the limit entry/fvg zone at ~$3,025.
Then, a rally targeting the $3,082 zone, possibly extending toward the EMA 200 at ~$3,090.
4. Trade Setup (Based on the Chart)
Entry: Around $3,025.72 (limit buy)
Target: Between $3,082.22 - $3,090.41
Risk: Likely below the FVG zone (~$3,015–$3,020), depending on risk appetite.
Conclusion
This is a smart money concept-based setup anticipating a liquidity grab or fair value gap fill before a bullish move. The trade aims for a reversal at a key demand zone, with confirmation from EMA confluence above as a profit target.
Would you like help plotting stop-loss levels or analyzing the risk/reward ratio?

Goldman Sachs Raises Recession Odds to 35% Amid Tariff Fears Goldman Sachs (NYSE: GS) has lowered its S&P 500 year-end target again. The firm now sees the index ending at 5,700 points, down from its earlier forecast of 6,200. This revision comes just days before President Trump’s new round of tariffs is set to begin. The updated target implies only a 2% gain from Friday’s close of approximately 5,597.
Chief U.S. Equity Strategist David Kostin pointed to rising tariffs and slowing economic growth as key concerns. The revised forecast reflects a cautious outlook in light of economic risks. This is the second time Goldman has slashed its target this month.
At the same time, Goldman Sachs has raised its 12-month recession probability to 35%, up from a previous 20%. Chief Economist Jan Hatzius explained that higher tariffs and softening economic data contributed to the decision. Goldman now estimates the average U.S. tariff rate will rise to 15% in 2025, compared to an earlier projection of 10%.
Alongside these changes, the bank has cut its Q4 2025 U.S. GDP growth forecast to 1.0% from 1.5%. The adjustment follows weakening household and business confidence. Recent White House comments also suggest officials may accept short-term economic strain to pursue long-term trade objectives.
These developments reflect growing concern across Wall Street. Goldman’s 5,700 target ranks among the lowest of major forecasts. With markets already on edge, the new projection underscores broader fears over trade tensions and economic resilience.
Technical Analysis: Bearish Momentum Below $500
The S&P 500 has turned bearish after falling below a key support at $510. This level had held firm previously but now acts as resistance. The break and close below the key level signals strong bearish pressure and there is a possibility of more bearish momentum.
Price is currently trending lower towards the next potential support at $440. If it breaks below it, further drop could follow. The bearish pressure may continue unless the bulls defend the key support level.
However, if the bulls can finally defend the $440 level, it could potentially recover and target $510. In that case, the first resistance to overcome is $510. If it is also broken above, the next target would be the $592 resistance zone. A break above $592 could revive bullish momentum.
As of April 4th 2025, Goldman Sachs stock closed at $21.74, down 1.50% on the day. Investors await further updates ahead of the earnings report due April 14th 2025.

Perfect ending, gold trend analysis and layout for next weekEarly layout plan for gold: 3.31-4.4 Reviewing this week, a total of 20 layouts were arranged, and the overall harvest was 1245pips! This week can be called a super week. After the tariff fundamentals were implemented, the market started the callback mode, and there was a big sweep in the middle. It is unrealistic to say that we can win all the games. The number of mistakes we made this week has also increased. This is normal, but our eye-catching operations are even more dazzling, and we have gained more. Overall, I am quite satisfied. I will continue to work hard next week.
Analysis of gold market trends next Monday: Technical analysis of gold: The gold market on Thursday and Friday this week can be described as thrilling, with a rise and fall of more than 100 points in two days! The gold market suddenly changed, and there was an extremely violent sweep. First, it rose rapidly to 3136 without any signs, and then fell back quickly at lightning speed, and fell below the intraday low. After a series of big negative declines, the current short-term trend of gold is bearish. The daily line has a big negative downward trend, breaking the short-term moving average and piercing the middle track, leaving a lower shadow below. The pattern shows a bearish signal of Yin engulfing Yang. In the short term, it may rely on the support of the middle track to confirm the 10ma resistance and fall again. The 4-hour Bollinger band opens and extends downward. The K-line continues to decline, and the trend is bearish and downward. The callback space is larger than the rising space. Falling below the previous day's starting low of 3054 is a short-term empty point, and the lowest retracement is around 3015. The daily line is in a partial adjustment in the short term.
Combined with the falling wave space of the 4-hour chart. The 3000 integer mark is the support position of the golden section point 0.5. The 4-hour Bollinger Bands open downward, and the K-line continues to decline. The downward trend is obvious. The focus below is on the break of the 3000 mark. As long as the 3000 mark is held, the short-term bullish structure will not change. The market will continue to rise to new highs. If the 3000 mark is broken, the market will form a large-level adjustment structure. The short-term operation is mainly to buy on dips above 3000, and to sell at high altitudes. The upper resistance is around 3054-3057-3072, and the lower support is 3015-3000. On the whole, the short-term operation of gold next Monday is mainly to buy on rebounds, and to buy on callbacks. The upper short-term focus is on the 3054-3057 resistance line, and the lower short-term focus is on the 3000-3015 support line. Friends must keep up with the rhythm. It is necessary to control the position and stop loss, set the stop loss strictly, and do not resist the single operation. The specific points are mainly based on real-time intraday trading. Welcome to experience and exchange real-time market information ☎️, enter ✈️✈️ to follow real-time orders.
Reference for gold operation strategies on Monday:
Short order strategy: Strategy 1: Short gold rebounds near 3045-3055, stop loss 10 points, target near 3030-3015, break to see 3000 line.
Long order strategy: Strategy 2: Long gold pullback near 3015-3005, stop loss 10 points, target near 3030-3040, break to see 3050 line.

Gold (XAU/USD) Technical Analysis: SMC Trading point update
This chart is a technical analysis of Gold (XAU/USD) on a 4-hour timeframe. Here’s a breakdown
1. Ascending Channel:
The price is moving within an upward channel, showing a bullish trend.
Higher highs and higher lows confirm the uptrend.
2. Support and Resistance Zones:
Yellow Boxes: Key support zones where price previously consolidated before moving higher.
Red Arrows: Marking resistance zones where the price faced rejection.
Green Arrows: Indicating support levels where the price bounced.
3. Current Price Action:
Price recently dropped to a key support zone (around $3,050).
A bullish reaction is expected from this level.
If support holds, the price may continue the uptrend toward the target of $3,186.
4. Projected Move:
The black zigzag line suggests a potential bounce from support.
If the support level holds, price could move back up within the channel.
Mr SMC Trading point
Conclusion:
If price respects the support zone, there could be a good buying opportunity.
A break below the support zone would signal potential bearish movement.
Monitoring price action around the yellow zone is crucial for confirming direction.
Pales support boost 🚀 analysis follow )

Gold has been moving big recently, don’t hold it blindly!What is coming has come, more than 100 US dollars a day, the decline is always faster than the rise, and more fierce, after breaking the 3100 watershed, it accelerated downward, the current minimum is 3054, the key position below is 3000/3040, pay attention to the plunge and the card position can also participate in the long, but must be patient to wait for the position.
After the big drop, the stage high point appears, and the follow-up is that both long and short can participate. The first plunge only establishes the high point position, and it is not so fast to turn short. It will fluctuate for a period of time. Generally, major news is an opportunity. The evening news detonates the market, and the main force often uses the news to pull up shipments. If the rebound touches 3110-3120, short it.

Gold (XAUUSD) 15-Minute Chart Analysis: Bullish Setup with Key SGold (XAUUSD) 15-Minute Chart Analysis
Key Technical Indicators:
Current Price: $3,122.28
30 EMA (Red Line): $3,115.90 (Short-term trend indicator)
200 EMA (Blue Line): $3,081.17 (Long-term trend indicator)
Support Zone: Around $3,106.62
Target Point: $3,154.02
Analysis:
Trend:
The price is in an uptrend, as it is trading above both the 30 EMA and 200 EMA.
The 30 EMA is acting as dynamic support, showing strong buying interest at pullbacks.
Key Levels:
Support: $3,106.62 (marked in blue) is expected to hold as a key support level.
Resistance Zone (Previous Supply Area): Around $3,090-$3,100 (shaded purple) was previously a resistance zone but has now turned into support.
Target Level: $3,154.02 is the expected bullish target if the price respects the support zone.
Trade Setup:
Bullish Scenario: The price may pull back to the support zone (~$3,106.62) before bouncing higher towards the target.
Stop Loss: Below $3,106.62 to minimize risk.
Entry Point: A retest of the support area with bullish confirmation could provide an optimal entry for a long trade.
Risk Management:
Stop Loss: Set just below the support zone.
Reward-to-Risk Ratio: Favorable if targeting $3,154.02 with a stop at $3,106.62.
Conclusion:
The chart suggests a bullish outlook, with price expected to continue its upward momentum if support holds.
A breakout above $3,123 could further confirm bullish strength.
Caution: If the price breaks below $3,106, further downside movement toward the 200 EMA ($3,081.17) is possible.

Goldman Sachs Earnings Tomorrow – Ready for a Bullish Breakout?Goldman Sachs (NYSE: GS) is shaping up for a potential bullish move ahead of its earnings report tomorrow (January 15) before the market opens. With the stock bouncing off key support levels and positive momentum indicators, a strong earnings surprise could trigger further upside toward my targets.
Let’s break down the setup:
💼 Trade Setup for Swing Trade:
🔹 Entry Price: $569 (current price)
🎯 Take Profit 1: $600
🎯 Take Profit 2: $625
🎯 Take Profit 3: $650
🛡️ Stop Loss: $540 (below key support)
📈 Why Am I Bullish on Goldman Sachs?
1️⃣ Earnings Catalyst (January 15, Pre-Market)
Goldman Sachs will release its Q4 2024 earnings tomorrow before the market opens. Historically, the bank has outperformed expectations, particularly in trading revenues and fixed income.
Given the recent recovery in capital markets, there’s a good chance Goldman will report higher-than-expected revenues, which could trigger a sharp rally.
2️⃣ Technical Reversal in Play
GS is bouncing off a key support zone near $550, which has acted as demand multiple times in the past. The RSI is rising from oversold levels, and Stochastic has turned bullish, suggesting momentum is building.
A break above $575 would confirm the reversal and open the door to higher targets at $600, $625, and $650.
3️⃣ Valuation and Undervaluation
Goldman Sachs is trading at a P/E ratio of 16.8, which is cheaper than peers like JPMorgan and Morgan Stanley. This leaves room for valuation expansion, especially if the bank delivers positive earnings surprises.
With recovering trading volumes, M&A activity, and IPO deals, GS could see a significant boost to revenue and profitability.
💡 Final Thoughts:
Goldman Sachs is setting up for a potential bullish move, with a solid technical and fundamental backdrop. The upcoming earnings report is a key catalyst that could trigger strong upside if results beat expectations.
I’m targeting $600, $625, and $650, while managing risk with a stop loss at $540. Let's see how it plays out!
💬 What do you think? Are you bullish on Goldman Sachs too? Drop your thoughts in the comments! 👇

Gold (XAU/USD) Technical Analysis – Bearish Rejection Expected fThis chart represents an analysis of Gold (XAU/USD) on a 30-minute timeframe. Below is a breakdown of the key elements:
Key Observations:
Downtrend Formation
The price is trading within a downward channel, marked by two descending trendlines.
The overall trend appears bearish, indicating potential further declines.
Supply Zone (Resistance) Around $3,025 - $3,030
The price is approaching this key resistance area.
If the price fails to break above, it could lead to a rejection and continuation of the downtrend.
Demand Zone (Support) Around $3,000 - $3,006
This is the target area where buyers may step in to support the price.
A downward move towards this zone is anticipated.
Projected Price Movement
The blue arrows suggest a bearish scenario.
A rejection from the supply zone is expected to push the price downward.
The final target is the demand zone near $3,000.
Conclusion:
Bearish Bias: The price is currently in a downtrend, with the expectation of a rejection from resistance and a move toward the lower support zone.
Confirmation Needed: Watch for price action signals, such as rejection wicks or bearish candlesticks, to confirm the downward move

Gold (XAU/USD) Bearish Outlook: Key Levels to WatchBuddy'S dear friend SMC Trading Signals Update 🗾 🗺️
This chart represents the price action of Gold (XAU/USD) on a 1-hour timeframe, showing potential areas of resistance, support, and liquidity zones. Here’s a breakdown of the analysis:
Analysis of the Chart:
1. Resistance Level (3,023-3,030 zone)
The price has reacted multiple times (red arrows), indicating strong selling pressure.
A fair value gap (FVG) is present, suggesting potential mitigation before further movement.
2. Current Price (3,011.76)
The price is trending downward after rejecting the resistance level.
It is approaching the diamond zone, a potential short-term support before continuation.
3. Key Support Levels:
Diamond Zone (~3,000 region)
Could cause a temporary bounce before further decline.
Order Block (~2,952-2,938 zone)
This is a strong demand zone and a potential target area for price action.
4. Target Levels:
The analyst expects a downward move toward 2,952, aligning with a liquidity grab scenario.
5. RSI Indicator:
RSI is at 44.27, suggesting bearish momentum, with the possibility of further downside.
A break below 40 RSI may confirm more selling pressure.
Mr SMC Trading point
Risk Management Considerations:
Entry: A possible short entry could be around the FVG level (~3,020-3,030) if price retraces.
Stop Loss: Above 3,035 to avoid being trapped in a fake breakout.
Take Profit: Around 2,952-2,938 as per the target point.
USD Update & Impact on Gold:
If USD strengthens, gold may drop further due to their inverse correlation.
Key upcoming economic data (interest rate decisions, inflation reports) could increase volatility.
Pales support boost 🚀 analysis follow)

Perfect hit, interval thinking remains unchangedThe idea remains unchanged according to the previous article!
In the wave of financial markets, accurate prediction is the badge of strength. Previously, we firmly arranged short selling, and it turned out that this decision was extremely correct! The trend of gold perfectly matched our expectations, falling all the way back to the area around 3010-3000.
Next, new opportunities have emerged. We will adopt the high-altitude and low-multiple operation mode within the range. At present, we have decisively gone long in the area around 3010-3000. Every ups and downs of the market are opportunities for us to make profits. Let us be full of confidence and look forward to the subsequent wonderful performance of gold together, and work together to reap more fruits of victory!
If you don’t know when to enter the market, you can follow my 🌐signal. I will release specific signals in real time. Remember to pay attention to the 🌐signal in time.

GOLD ALERT | BIG DROP LOADING!🏦 Institutions Are Taking Profits – Are You Ready for the Next Move?
For the last 4 weeks, institutions have been reducing their long positions on #GOLD ( OANDA:XAUUSD ). This is exactly what I warned about – profit-taking from big players, signaling potential downside ahead.
technical down

GOLD TRADING POINT UPDATE > READ THE CHAPTIAN Buddy'S dear friend
SMC Trading Signals Update 🗾🗺️ Gold Traders SMC-Trading Point update you on New technical analysis setup for Gold 🪙 list time post signals 💯 reached target point 3059. ). Analysis update on gold. Gold look 👀 patterns chart 📉 sellers recover and strong 💪. 30M time frame 🖼️ looking short trend 📉 target 🎯 point 3001 that entry buying said good luck 💯
Key Resistance level 3042 + 3046
Key Support level 3006 - 3001
Mr SMC Trading point
Palee support boost 🚀 analysis follow)

GOLD TRADING POINT UPDATE >READ THE CHPTAIAN Buddy'S dear friend 👋
SMC Trading Signals Update 🗾🗺️ Gold Traders SMC-Trading Point update you on New technical analysis setup for Gold 🪙 list week profitable profomans reached target point 2961 ) New technical analysis setup for Gold 🪙 a short trend 📉 analysis setup. Guys 🤝 Gold 🪙 1 Time Frame 🪟 patterns chart 📉. Looking for selling zone ☺️ 🤝 FVG level 3006$ 2996$ rejected point below 👇 ⬇️ target point 2832 - 2818. ) again back 🔙 that entry buying said. Update you next analysis Guys 🤝 now follow it' good luck 💯
Key Resistance level 2996+ 3006
Key Support level 2832 - 2818
Mr SMC Trading point
Pales Support boost 🚀 analysis follow)

GOLD TRADING PONT UPDATE >READ THE CHAPTIANBuddy'S dear friend 👋.
SMC Trading Signals Update 🗾🗺️ Gold Traders SMC-Trading Point update you on New technical analysis setup for Gold 🪙 Gold Traders Gold 1H time. Look 👀 first take FVG level that take entry buying said target point 2959 New ATH wait for FVG level good luck 🤞
Key Resistance level 2930 + 2959
Key Support level 2909 - 2902 - 2896
Mr SMC Trading point
Pales support boost 🚀 analysis follow)

GOLD(UPDATE)Hello friends
Considering that we are at a price ceiling and the power of buyers has decreased and we are witnessing the formation of lower ceilings, we can enter a sell transaction if the resistance level is not broken, of course with capital and risk management.
This analysis is reviewed only from a technical perspective.
*Trade safely with us*

Gold Now Low 2860 $Gold now low possible in near future as 2860 $ ,as per my view, this is price based study, after this price new high is possible .
