Xauusd overview (with trend analysis )We've experienced gold surge in the last 3days (about 1000pips)
This analysis was made on the Daily timeframe were we've observed a bullish trend and if we break past 3430, we have a lot of liquidity above and could float; But if it holds through, we expect a minor bearish pullbacks
Further updates would be given, Stay Tuned
Goldmarket

Xauusd overview (with trend analysisWe've experienced gold surge in the last 3days (about 1000pips)
This analysis was made on the Daily timeframe were we've observed a bullish trend and if we break past 3430, we have a lot of liquidity above and could float; But if it holds through, we expect a minor bullish pullbacks
Further updates would be given, Stay Tuned

Xauusd Market Projection As shown in the analysis, 2297 is a key zone whi h extends down to the 2260's on the higher time frame
If those zones hold us above then bullish momentum confirmed but if it doesnt hold, bears still have the upper hand in the market
Do you agree with this analysis ?

Xauusd Market ProjectionAs shown in the analysis, 2297 is a key zone whi h extends down to the 2260's on the higher time frame
If those zones then bullish momentum confirmed but if it doesnt hold us above, bears still have the upper hand in the market
Do you agree with this analysis ?
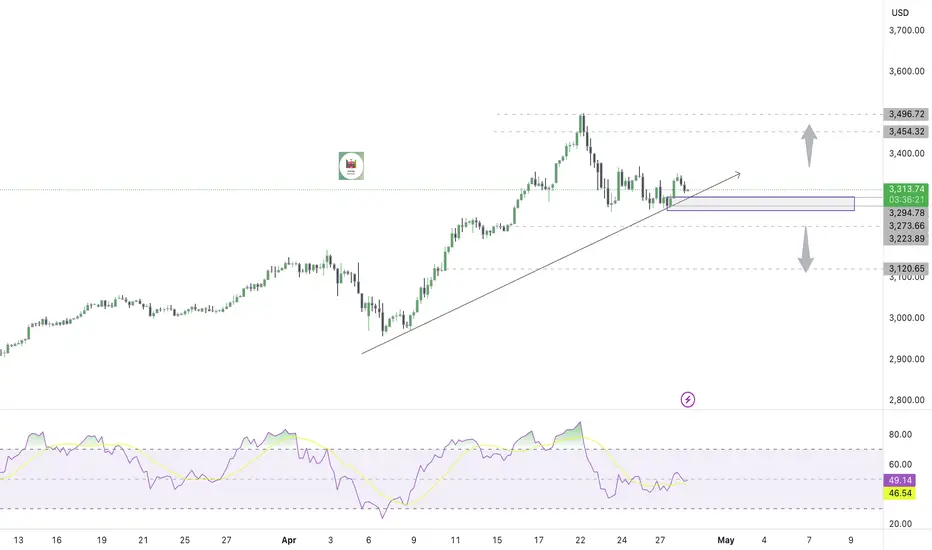
Gold prices bottomed out and rebounded, market trend analysis.Analysis of gold trend: From the perspective of market sentiment, interest-free gold as a safe-haven asset has performed strongly this year, with prices soaring by nearly $700 and hitting record highs several times. However, the recent optimistic expectations of easing global economic and trade relations have boosted market risk appetite, and the equity market has generally performed positively. Some funds have flowed out of safe-haven assets such as gold and turned to risky assets, which is also the main psychological factor under pressure on gold prices. If market risk appetite continues to improve, global economic and trade relations further ease, and the US dollar strengthens, gold prices may face greater downward pressure. From a technical point of view, the gold price needs to effectively fall below the $3,265-3,260 range in the short term before a larger correction downward may be confirmed. Once confirmed to fall below, the gold price may quickly fall to the 50% retracement level near $3,225, further pointing to the $3,200 mark. If $3,200 is lost, it will suggest that gold may have peaked in the short term.
Gold opened higher in the Asian session on Monday and continued to fall last week after hitting 3336. The idea of the Asian session was to directly bearish at the analysis point of 3277. After hitting the lowest point of 3268, it fluctuated upward. The European session also fell to 3273 and then rebounded. The highest point in the US session just reached 3336 again, a standard bottoming and rebounding trend. Since it is an adjustment structure, let's re-analyze the idea. The gold price fell at 3500 and rebounded at 3260 last Wednesday. The rhythm was volatile. It rebounded above 3260 many times below and did not cross the first rebound high of 3367 above.
Today, we mainly focus on the closing price. If it stands firmly at the 3313 line, we will adjust our thinking on Tuesday. On the contrary, it will fall back after encountering resistance at 3336, today's opening high, and go to 3278. On Tuesday, we will continue to look at the idea of swinging and falling. Now it is the end of the market, and the market is also falling from a high.

XAU/USD 15 April 2025 Intraday AnalysisH4 Analysis:
-> Swing: Bullish.
-> Internal: Bullish.
Price has now printed a bearish CHoCH as mentioned on various occasions in previous analysis. This is the first indication, but not confirmation, of bearish pullback phase initiation. I will however continue to monitor price.
Intraday Expectation:
Price to continue bearish, react at either discount of internal 50% EQ or H4 demand zone before targeting weak internal high priced at 3,235.845.
Note:
With the Federal Reserve's dovish stance and persisting geopolitical uncertainties, heightened volatility in Gold is expected to continue. Traders should proceed with caution and adjust risk management strategies in this high-volatility environment.
Price could also be driven by President Trump's policies, geopolitical moves and economic decisions which are sparking uncertainty.
H4 Chart:
M15 Analysis:
-> Swing: Bullish.
-> Internal: Bearish.
Price printed as per my alternative scenario in yesterday's analysis where I mentioned that due to the narrowing of the internal range, it could be a potential early signal that all HTF's are beginning their bearish pullback phase initiation. I would therefore not be surprised if price printed a bearish iBOS.
Price has printed a bearish iBOS.
Price has subsequently printed a bullish CHoCH to indicate bullish pullback phase initiation and has traded up to premium of internal 50% EQ.
Intraday Expectation:
Price has traded up to premium of internal 50% EQ and should technically target weak internal low priced at 3,193.630. However, price could also potentially trade up to mitigate M15 supply zone before targeting weak internal low.
Note:
With the Federal Reserve maintaining a dovish stance and ongoing geopolitical tensions, volatility in Gold prices is expected to remain elevated. Traders should exercise caution, adjust risk management strategies, and stay prepared for potential price whipsaws in this high-volatility environment.
Trump's tariff announcement will most likely cause considerably increased volatility and whipsaws.
M15 Chart:

GOLD WEEKLY CHART MID/LONG RANGE ROUTE MAP UPDATEDWeekly GOLD Analysis: February 2024
Hello Traders,
Here’s a weekly chart analysis of the GOLD, offering a comprehensive view of recent market trends and future predictions. Our diligent tracking since October 2023 has consistently delivered 100% target accuracy, as evidenced by the marked Golden Circle areas on the charts. Let’s dive into the highlights and what lies ahead.
Recap of Recent Successes
Weekly Chart Highlights:
Last week, the market flawlessly followed our predictions:
* Key Level 2735 ✅ DONE
* Entry Level 2735.88 ✅ DONE
* EMA5: Crossed and locked above Entry ✅ 2735 DONE
* Bullish Target TP1: 2877 ✅ DONE
* The FVG zone around 2735 sustained bullish momentum, while resistance was broken, leading to a new all-time high of 2886.
What’s Next for GOLD? Bullish or Bearish?
We anticipate continued bullish momentum with updated GOLDTURN levels and refined targets.
Key Level: 2735 remains critical.
EMA5 Behavior:
* If EMA5 holds above 2735 and crosses/locks above TP1 (2877), the next target is TP2 (3018), followed by TP3 (3160).
* A failure to hold above 2735 could indicate bearish momentum, prices will be retesting support at 2595 in the demand zone.
Recommendations & Strategy:
* Focus on EMA5: Its behavior near 2735 and TP1 will provide clear direction for short- and long-term trades.
* Support Levels: GOLDTURN levels at 2735 and 2595 are critical for identifying reversal zones and optimal dip-buying opportunities.
* For precise entry and exit points, review our daily, 12H, 4H, and 1H analyses to navigate the market confidently.
* Slight pullbacks may occur, with potential reversals near GOLDTURN levels.
* Long-Term Outlook: The monthly chart suggests sustained bullish momentum, offering excellent opportunities for dip-buying near key support zones.
Stay Updated:
We’ll continue to share daily updates, insights, and strategies on our TradingView channel and YouTube channel every Sunday. Don’t forget to like, comment, and share to support our work and help others benefit!
The Quantum Trading Mastery

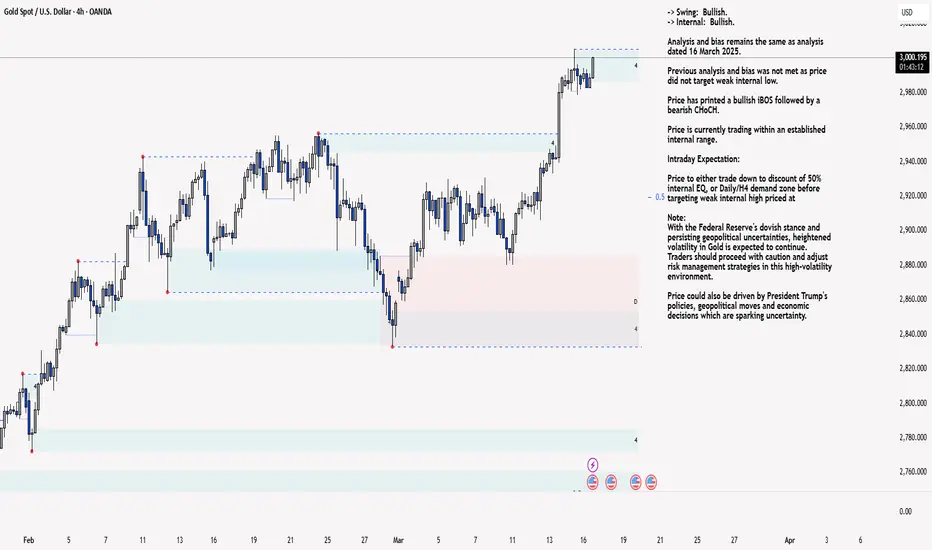
XAU/USD 17 March 2025 Intraday AnalysisH4 Analysis:
-> Swing: Bullish.
-> Internal: Bullish.
Analysis and bias remains the same as analysis dated 16 March 2025.
Previous analysis and bias was not met as price did not target weak internal low.
Price has printed a bullish iBOS followed by a bearish CHoCH.
Price is currently trading within an established internal range.
Intraday Expectation:
Price to either trade down to discount of 50% internal EQ, or Daily/H4 demand zone before targeting weak internal high priced at
Note:
With the Federal Reserve's dovish stance and persisting geopolitical uncertainties, heightened volatility in Gold is expected to continue. Traders should proceed with caution and adjust risk management strategies in this high-volatility environment.
Price could also be driven by President Trump's policies, geopolitical moves and economic decisions which are sparking uncertainty.
H4 Chart:
M15 Analysis:
-> Swing: Bullish.
-> Internal: Bullish.
Price has printed a bearish CHoCH confirming internal range, however, price has not in any way pulled back significantly enough to classify current internal high as an iBOS, should price print higher than current internal high.
Remainder of analysis and bias remains the same as yesterday's analysis dated 13 March 2025
Analysis and bias has not been met, largely due macroeconomic events, particularly the Trump trade tariff war, which is causing uncertainty within the markets which is supporting Gold price.
Price has printed a bullish iBOS.
Within the structure following the iBOS, price has printed a several bearish CHoCH's with very minimal pullbacks before continuing bullish.
In order not to distort internal structure range I will apply discretion and not classify bearish CHoCH without considerable pullback.
Intraday Expectation:
Await for price to print Bearish CHoCH which is supported by a pullback relative to recent price action.
Note:
With the Federal Reserve maintaining a dovish stance and ongoing geopolitical tensions, volatility in Gold prices is expected to remain elevated. Traders should exercise caution, adjust risk management strategies, and stay prepared for potential price whipsaws in this high-volatility environment.
M15 Chart:
Gold is about to plummet! Short gold!!!Bros, gold is about to fall sharply. I have shorted gold again. Are you ready? If you don't short gold now, you will completely lose the good opportunity to short gold.
At present, under the pressure of the triple top near 2930 in the technical form, gold has dropped and tested the 2900 mark again. It is only a matter of time before it completely breaks through. As the center of gravity of gold moves down, the upper short-term resistance moves down to the 2910-2920 zone. Under the pressure of the technical form and the fact that gold has just tentatively broken through the 2900 mark, gold still has more room to fall. It is expected that gold will at least retest the 2880-2870 zone in this round of decline, or even lower.
Bros, I have executed the short gold transaction, let us wait and see!Bros, are you optimistic that gold will continue to fall?Wise choices are far greater than hard work. Only by following the right people can we execute the right transactions and accumulate profits that change our lives and destiny. If you want to copy trading signals and make stable profits, or want to learn the correct trading logic and techniques in depth, you can consider joining the channel at the bottom of this article!
Still short gold, TP: 2895-2885Bros. good morning!!!To be honest, I still hold my short position. In the past two days, gold has fallen back to around 2902-2901 many times. Although I made a good profit in the process, I think the fall of gold has not reached my target expectation, so I continue to maintain the short position for the time being and have not closed the position.
According to the current stage, gold has formed a current high point near 2956, and the 2930-2940 zone has also become an important current resistance area. Therefore, I believe that the current rebound of gold is not enough to support gold to continue to rebound and break through the key resistance level.
In addition, the situation between Russia and Ukraine is developing towards peace expectations, and the factors supporting gold have decreased again. After the fermentation and digestion of the market in recent days, the positive impact of the tariff issue will gradually weaken. On the technical level, gold is likely to replicate the trend between February 25th and 27th, and fall again after building a double top structure in the short term.
So in terms of short-term trading, if you don’t have any positions, you can still continue to short gold and look forward to gold falling back to the 2895-2885 zone.Bros, profits are the ultimate goal in trading. Accumulating profits is what changes lives and destinies. Choosing wisely is far more important than just working hard. If you want to replicate trade signals and earn stable profits, or if you want to deeply learn the correct trading logic and techniques, you can consider joining the channel at the bottom of this article!

Profitable trading methodsDear Traders,
Since yesterday, I have maintained my short strategy on gold, entering small positions at 2919, 2927, and 2939, with a TP set at 2916. Gold faced resistance near the 2940 zone and has since retraced, hitting the TP of 2916 as expected. All of our short positions were closed with a profit when the TP was reached.
Based on the current structure, the 2940 region remains a significant resistance zone for gold in the short term. If gold fails to break this resistance, it could potentially form a double top pattern, which would favor further downside movement. We should first focus on the support at 2915-2910, and then monitor the 2900-2895 region for additional support. If gold manages to hold above 2900 during the pullback, we should avoid aggressively chasing short positions, as a potential liquidity increase could attract more buying interest.
For the upcoming trades, there are two possible scenarios:
1. If gold rebounds above 2930, we can consider shorting again.
2. If gold maintains support above 2910-2900 or fails to break below this range, we could look to take long positions.
Bros, have you followed me to short gold and made a profit? If you want to learn more detailed trading ideas and get more trading signals, you can choose to join the channel at the bottom of the article to make trading no longer difficult and make making money a pleasure!

Advocate continuing to short goldIf you have been following my trading strategy, you should be aware that I have already initiated short positions around the 2900 level. Currently, gold is trading near 2910.
After reaching the 2905 level, gold unexpectedly failed to produce a meaningful pullback and instead extended its rally beyond 2910. However, the bullish momentum is gradually losing steam, and gold is approaching short-term trendline resistance. I anticipate that once gold tests this resistance level, a retracement toward the 2880 region, or even as low as 2860, remains a strong possibility.
On the other hand, despite gold’s strong uptrend, we must remain cautious about macroeconomic factors. If the Trump administration continues to advocate for a strong U.S. dollar policy, potential intervention in the gold market cannot be ruled out, which could pressure gold prices.
From a short-term trading perspective, I do not recommend chasing longs at this level. I am still holding my short positions initiated around 2900 and have just added to my short exposure above 2910, anticipating a corrective pullback as projected.
Bros, have you followed me to short gold? If you want to learn more detailed trading ideas and get more trading signals, you can choose to join the channel at the bottom of the article to make trading no longer difficult and make making money a pleasure!

Start shorting gold before the marketGood morning, dear traders! A new trading week has begun!
Last week, I consistently emphasized in my trading strategy that gold still had the potential to rally towards 2900. Since the market opened today, gold has accelerated its upward move, approaching 2900, which suggests a short squeeze from a technical perspective. Additionally, in my trading outlook shared on Friday, I specifically pointed out that as gold approaches or tests the 2900 level, we must remain cautious of a potential pullback. If gold fails to decisively break through the 2895-2905 resistance zone, a short-term retracement to the 2880 zone, or even the 2860 level is possible.
In the short term, I will continue to look for short opportunities within the 2895-2905 range, anticipating that gold will pull back as expected, setting us up for a strong start to the trading week!
Bros, do you have the courage to try shorting gold with me? If you want to learn more detailed trading ideas and get more trading signals, you can choose to join the channel at the bottom of the article to make trading no longer difficult and make making money a pleasure!

Profit of 130pips, retracement is an opportunity to buy goldDear traders, did you follow my trading strategy and go long on gold in the 2860-2850 zone? As I emphasized in my previous analysis, if gold holds above the 2850-2840 support level during its pullback, it retains the potential to rally toward 2900. Based on this logic, we executed a highly successful trade in the NFP session, going long on gold within the 2860-2850 range as per my outlined strategy.
Following the NFP data release, gold briefly dipped to around 2852 during the retracement. I strictly adhered to my trading plan and entered a long position at 2853. As expected, gold extended its rally above 2880, precisely hitting my projected take-profit (TP) target. This outcome reaffirms the accuracy of my trading strategy, and the gold market has indeed moved in line with my expectations. Cheers to our victory, everyone!
At this point, there are still no clear signs of a market top, and gold may attempt to test the 2900 level. However, as it approaches or touches 2900, we must remain cautious about the risk of a potential retracement.
Bros, have you followed me to do long gold? If you want to learn more detailed trading ideas and get more trading signals, you can choose to join the channel at the bottom of the article to make trading no longer difficult and make making money a pleasure!

XAU/USD H4The XAU/USD pair appears poised for a bullish trend in the near future. After a brief pullback to retest a key support zone and trendline, it is expected to resume its upward momentum, presenting an excellent opportunity for long positions. Traders should monitor these levels closely for confirmation of the trend continuation.

GOLD 12H CHART ROUTE MAP ANALYSISHello Traders,
Here’s our 12H chart analysis and target updates:
📌 Previous Chart Review
Key Resistance: Identified 2,790 as a critical resistance level, anticipating a potential reversal.
Buy Signal: Recommended waiting for EMA5 to cross and hold above TP1 (2,745) as confirmation for a bullish move toward TP2 (2,786) & TP3 (2,826).
Dynamic Support: Highlighted the FVG zone (2,745) as a key support area.
📊 Outcome
✅ All targets and entry levels (marked with Golden Circles) were achieved as predicted.
✅ EMA5 crossed above TP1 (2,744), leading to TP2 (2,786) being achieved.
✅ Resistance at 2,790 was broken.
❌ TP3 was nearly reached but reversed after EMA5 failed to cross and hold above TP2 (2,786).
🔍 What’s Next for GOLD?
The daily candle closed above TP2 (2,786), but EMA5 failed to sustain above it.
This suggests a potential short-term reversal.
📉 Key Levels
📌 Support: Strong support expected from the FVG zone and Gold Turn Levels (2,770, 2,745 & 2705).
⚠️ Downside Risks
If EMA5 crosses and holds below 2,770, the next target shifts to 2,745.
If EMA5 crosses and holds below 2,745, the downside extends toward 2,705 (Retracement Range).
📈 Bullish Path
A bounce from support could retest TP2 (2,786) and potentially extend toward TP3 (2,826).
📌 Trading Recommendations
🔹 Short-Term Trades:
Utilize 1H and 4H timeframes to capitalize on dips at Gold Turn Levels, targeting 30–40 pips per trade.
Focus on shorter positions in this range-bound market to navigate volatility.
🔹 Long-Term Bias:
We remain bullish and view pullbacks as buying opportunities.
Buying dips from our marked levels provides better risk management rather than chasing tops.
📢 Final Note
Trade with confidence and discipline—our precise analysis ensures you’re well-equipped to navigate the market. Stay tuned for daily updates and multi-timeframe insights.
Best regards,
📉💰 The Quantum Trading Mastery

GOLD 4H CHART ANALYSIS AND TRADING PLAN FOR THE WEEKHello Traders,
Here’s our updated analysis for the 4H GOLD chart. Last week’s projections played out perfectly, with EMA5 crossing and holding above key levels, successfully reaching our targets TP1, TP2, and TP3 (marked with orange circles on the chart).
Target Levels for the Coming Week:
This week, GOLD reversed from the resistance level at 2785.94. Currently, EMA5 and price are fluctuating between two weighted levels, with a gap above at 2785 and a gap below at 2733. We’ll need EMA5 to cross and hold above or below the ENTRY LEVEL at 2733 to determine the next range.
Key Updates:
Resistance Level: 2785.94
Bullish Targets:
TP1: 2785
TP2: 2810
TP3: 2833
If EMA5 crosses and locks above 2758, the next bullish target is TP1 (2785).
If EMA5 crosses and locks above TP1 (2785), the path to TP2 (2810) will open.
If EMA5 crosses and locks above TP2 (2810), the path to TP3 (2833) will open.
Bearish Targets:
Key Level: 2733
If EMA5 crosses and locks below 2733, it will open the path to 2706.
If EMA5 crosses and locks below 2706, the path to 2680 will open.
If EMA5 crosses and locks below 2680, the path to 2653 will open.
Additional Ranges:
Retracement Range: 2706 - 2680
Swing Range: 2664 - 2634
We will continue to monitor these levels and provide updates based on how EMA5 interacts with the weighted zones.
The QUANTUM Trading Mastery

Short gold again after rebounding to 2750-2760 zoneGold has currently retraced to the 2741 level, triggering significant profit realization for our positions. Since gold rallied above 2770 last week, I have consistently maintained a bearish stance, anticipating profit-taking and sell-offs driven by market sentiment. Our short positions have once again delivered substantial returns.
This morning, we initiated long positions near the 2756 level and closed them at 2770, securing an easy profit of 140 pips. As gold approached 2770, I explicitly shared in my previous analysis that if gold failed to decisively break through the 2770-2775 range, I would switch to shorting. Thus, after closing the long positions, I reversed my position and shorted gold near 2770. Gold has since declined as expected to around 2741. Although we closed our short positions near 2753, capturing a profit of 170 pips, I am still satisfied with this result. It's been a strong start to the week's trading!
Currently, gold has bottomed out around 2740. I do not recommend chasing shorts at this level, as the 2740-2730 zone provides notable technical support, which could potentially drive a rebound to the 2750-2760 range. For those looking to short gold further, it’s advisable to wait for a rebound to the 2750-2760 region before executing short trades. Alternatively, a moderate long position could be considered, with a short-term target set between 2750 and 2760.
Bros, have you followed me to do short gold? If you want to learn more detailed trading ideas and get more trading signals, you can choose to join the channel at the bottom of the article to make trading no longer difficult and make making money a pleasure!

Gold (XAU/USD): Analyzing the 4-Hour ChartAs we delve into the gold market, it's clear that the recent economic and geopolitical developments are having a profound impact on XAU/USD. The 4-hour chart provides an insightful snapshot of the current market dynamics and potential future movements.
Currently, gold is trading at $2,760.790, reflecting a slight decrease from its opening price of $2,762.960. The highest price reached in this session was $2,763.680, with a low of $2,753.618, showing some volatility in the market. The closing price stands at $2,760.790, marking a minor decline of -0.08%.
The chart highlights several critical support and resistance levels. Resistance is noted at $2,795.558, $2,721.846, and $2,696.912, while support levels are identified at $2,790.417, $2,739.758, $2,666.224, and $2,633.618. These levels will be crucial in determining future price movements, as traders look to these points for potential reversals or continuations of the trend.
A notable feature on the chart is the upward trend channel, formed by two black trend lines. This channel indicates a bullish trend in the gold market, suggesting that prices are likely to continue their upward trajectory. However, the presence of two red arrows projecting potential future movements indicates a possible short-term correction before the trend resumes.
At the bottom of the chart, the Relative Strength Index (RSI) stands at 66.03, signaling that the market is approaching overbought conditions. This is important for traders to consider, as it may indicate a potential pullback in the near term before gold resumes its upward march.
In conclusion, the 4-hour chart of XAU/USD reveals a bullish outlook for gold, driven by the ongoing economic uncertainties and geopolitical tensions. The weakening US dollar, inflationary pressures, and safe-haven demand for gold are key factors supporting this trend. Traders should keep a close eye on the support and resistance levels, as well as the RSI, to make informed trading decisions. As always, staying informed and considering all aspects of the market will be crucial for navigating the gold market successfully.
follow for More ideas.

Continue and try to short gold with a target of 2760Dear traders.
Gold unexpectedly accelerated during the early hours, surging to around 2778, which was beyond my expectations.Gold has currently reached a maximum of around 2785.
It’s evident that the only significant resistance lies at the previous high of 2790 or the psychological level of 2800, leaving limited upside room. Therefore, I continue to advise against chasing long positions on gold in the short term. At this stage, technical indicators have been significantly overshadowed, and market sentiment has become a more critical factor to monitor.
In the context of short-term trading, I recommend avoiding long positions to reduce the risk of being trapped at high levels in the event of a sharp selloff triggered by profit-taking or liquidation of long positions. Instead, I prefer taking short positions with well-defined stop-loss levels. Even if gold continues to rise and hits the SL, the loss will be manageable, and the capital will remain intact. On the other hand, if a sudden crash occurs, short positions could yield significant profits.
Bros, are you still optimistic about the decline of gold? If you want to learn more detailed trading ideas and get more trading signals, you can choose to join the channel at the bottom of the article to make trading no longer difficult and make making money a pleasure!

GOLD DAILY CHART MID/LONG TERM UPDATEHello Everyone,
Here’s the latest update on the daily chart we’ve been tracking and trading, providing an overview of the current range.
On the daily timeframe, there’s a strong resistance level at 2790, which may cause a rejection. Below this resistance, there is a Fair Value Gap (FVG) at 2740, which could provide support and help the price hold above.
To simplify your trades, we’ve included entry levels and take profit (TP) targets (TP1, TP2, TP3) aligned with the EMA5. The EMA5 crossing and holding above these weighted levels will determine the subsequent targets.
Key Update:
EMA5 lock is now in place, providing additional confirmation for the gap.
Strategy Highlights:
ENTRY LEVEL: 2744
If a candle closes above this level and EMA5 crosses it for confirmation, we’ll look to enter bullish positions.
First Target (TP1): 2804
Apply the same strategy to determine TP2 and TP3.
Rejection Scenario:
For ranging markets, focus on smaller timeframes (15M, 1H, 4H, 12H) to buy dips from weighted levels.
Target clean 40-60 pips moves, which work well in these conditions while avoiding the risks of long-term swings.
Dip-Buying Strategy:
Continue buying dips at our support levels, targeting 40–60 pips per trade.
Each level structure offers a 40–60 pip bounce, ideal for precise entry and exit points.
Monitor the EMA5 crossing and locking above or below the ENTRY LEVEL to confirm the next directional range.
Stay focused and trade wisely!
TheQuantumTraders

Start shorting goldDear Traders,
Gold has now surged above 2750, with bullish momentum remaining robust. It appears that gold is showing signs of attempting to challenge the previous high of 2790. However, as prices continue to rise, the risks also increase. For short-term trading, I would avoid chasing long positions unless there is a significant pullback opportunity.
Despite gold's strong upward trajectory, I believe there are indications of a short squeeze. Therefore, I do not advocate aggressively pursuing further long positions at this stage. In the near term, gold faces resistance in the 2760–2765 range. If it fails to decisively break through this level, there is a high probability of a notable correction. Consequently, I currently prefer to explore opportunities to short gold, targeting the 2735–2730 zone, or potentially as low as 2720.
Bros, do you expect gold to retrace in the short term like me? If you want to learn more detailed trading ideas and get more trading signals, you can choose to join the channel at the bottom of the article to make trading no longer difficult and make making money a pleasure!

When gold retraces, be brave enough to buy goldDear traders:
As I expected, gold failed to fall below 2700 even during the recent bull-bear game. The 2695-2690 area has formed a support area that cannot be ignored, which is conducive to the continued rise of gold.
At present, gold has formed a new low structure near 2700 many times in the local structure, so gold may form a new relay platform near 2700. Once the relay platform is successfully built, it will further stimulate buying to support gold to continue to rise to the 2740-2750 area. As mentioned in my previous article, during the fierce battle between the bulls and bears for control of gold, I have already bought gold near 2702. At present, gold has rebounded above 2709 again. Our long positions have begun to make good profits. Wait patiently for gold to take off!
Bros, have you followed me to do long gold? If you want to learn more detailed trading ideas and get more trading signals, you can choose to join the channel at the bottom of the article to make trading no longer difficult and make making money a pleasure!
