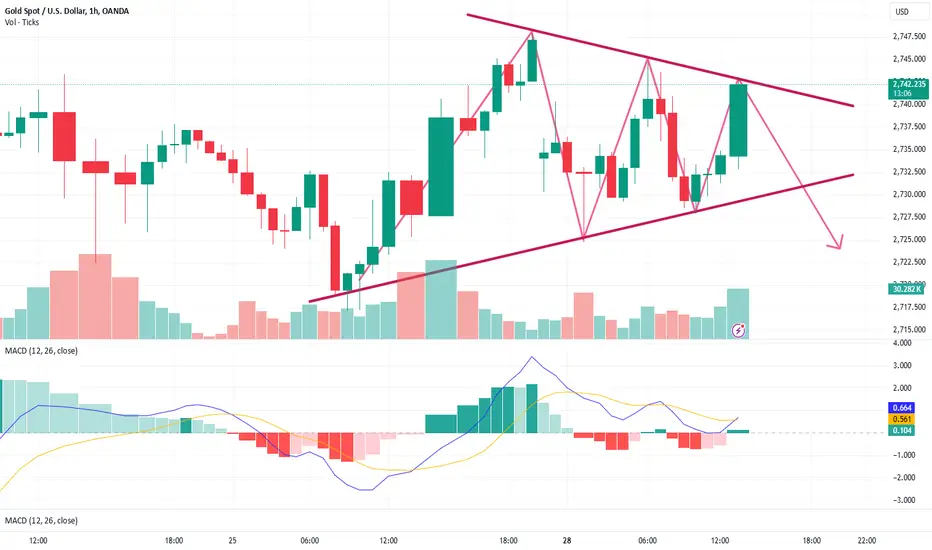
10.31 gold box vibration???Gold is mainly affected by the following three aspects:
1: The October US non-farm payrolls data will be announced at 20:30 on Friday. The US September ADP employment data released on Wednesday increased significantly beyond expectations. Next tonight, the US September PCE price index and the number of initial jobless claims for the week will be released.
2: The US presidential election next Tuesday (November 5th), there are less than 4 trading days left. Who will eventually enter the White House in the battle between the Donkey and the Elephant parties? Especially on November 5th, the day of the election, the gold market will definitely fluctuate violently!
3: Geopolitical risk events, North Korea tested an intercontinental ballistic missile around 7:10 this morning, and Iran will say that it will retaliate against Israel before November 5th. With the reshaping of the world pattern, the geopolitical risks in the Middle East are spreading to the world.
As the price of gold approaches $2,800, bulls and bears diverge again. The last time gold approached $2,700, it adjusted around $2,685, which ultimately did not affect the upward trend. It just threw the bulls off the train during the adjustment, which also hit the bulls' morale for short-term operations.
This time, when it approached $2,800, the bulls paused. On Wednesday, the market repeatedly washed between 2,790 and 2,770. In addition, the heavy pound data will be released today, tomorrow and next week. The suspense will naturally be left to the non-agricultural data today and tomorrow night.
1 hour, it quickly fell back to the 2,770 point where it started to rise in the morning, forming a high-level box shock. At present, the gold price has not stabilized at 2,790. Don't rush to chase more, but pay attention to the direction of the 2,790-70 box range breakthrough, and try to avoid chasing the edge position within the box.
Goldminers

ADP data is coming soon! Gold shortThe market performance on Wednesday (October 30) continued the recent strong upward momentum. The price of gold hit $2,789.83/ounce in early trading, setting a new record high and rising sharply by more than $15. With the ongoing conflicts in the Middle East and the intensification of geopolitical risks, gold has once again become a safe haven choice for investors.
Technical analysis
After breaking through the resistance area of 2,780-2,785 US dollars/ounce, the price of gold became an offensive signal for bulls. The price of gold may further push towards the $2,800/ounce mark. At present, any meaningful correction is expected to find good support around $2,750/ounce. If there is a subsequent sell-off in the price of gold, it may push the price of gold to the support level of $2,732-2,730/ounce, or even further down to the $2,715/ounce area.
Today's focus data:
US unemployment rate in October
US non-farm payrolls in October (10,000 people)
Today's expected trend of gold prices can focus on the fluctuations between the support level of $2,765.00/ounce and the resistance level of $2,800.00/ounce. Under the current market sentiment and technical conditions, gold is still a worthy investment option.

10.30Gold accelerates to the top, 2780 watershedThe gold market rose strongly yesterday. It opened at 2742.3 in the morning and then fell back to 2739.5. After that, it rose strongly. After reaching the previous historical high of 2758, the market was under pressure and consolidated to 2745.8. After that, the market rose strongly in the US market due to fundamental stimulus. After breaking the previous historical high, it reached the highest point of 2774.9 and then consolidated. The daily line finally closed at 2774.5. After that, the market ended with a saturated large The market closed with a positive line, and after this pattern ends, today's market has the technical need to impact the 2805 pressure. In terms of points, the longs at 1996 and 2028 below have stop losses followed up at 2600. After the long positions at 2722 were reduced last Friday, the stop loss followed up at 2735. Today's market is 2762 longs and 2759 longs are conservative with stop losses at 2755. The target is 2775. If it breaks through, the target of this round of impact will be at the 2800-2805 pressure.

Those who are shorting or want to short remember to readToday, the market has reached my target position of 2757, 2765.2770 for the third time. The long order has completely won. After the fast strategy of high-level selling and low-buying was announced today, members all made good profits. In such an extreme market, I think such a profit is acceptable. Maybe for many people, not losing money is a good result. But not for me. There must be a profit every day. And it must be a good profit.
Next is the short selling plan. Today, the New York market is expected to retreat to 2765 or below. If it reaches, continue to go long. The target is 2775. The Asian market can continue to wait for the position of 2780. The announcement of GDP the next day needs to be paid special attention. If the data is negative, the probability of reaching 2800 this week is not high. If the data is positive, then 2800 is very close. Because there will be a non-agricultural data release on Friday this week. This value can determine whether the market can reach 2800 points. In layman's terms, the gold price will continue to rise from today to tomorrow.
It has been expanding profits for a month. Others verify based on the winning rate. My verification method is based on the failure rate. If you want to save your account, follow me. And leave a message.

Perfectly achieved goal 2757The market is crazy.
After buying gold at 2741 price. Had a good nap. Hit the target directly.
I think there is nothing more pleasant than this. Is it because yesterday's market fluctuations were too stable, so today I was given a small surprise in advance?
I believe many people have seen the quick trading strategy I posted and bought it. That is worth toasting.
This is the fast trading strategy.It is a beacon on the road.It guides you in the direction and allows you to see the road clearly in the dark night.
OANDA:XAUUSD COMEX:GC1! CAPITALCOM:GOLD BITSTAMP:BTCUSD COMEX_MINI:MGC1!

Gold short-term day trading plan.From the trend point of view. Compared with long and short positions, the bulls are still slightly stronger. So the operation is still mainly based on low buying.
The intraday trend maintains high fluctuations. The amplitude is about 15 US dollars. But it finally returned to the high level in the New York market, which is enough to prove the strength of the bulls.
At present, the gold price is maintained at the 2741 line. The analyst of the fast trading team said that in the short term, it can be maintained at a low buy below the price of 2735. Whether the pressure of the upper 2760 line can be broken. If it breaks through, continue to go long. If the pressure is very high. Then short selling at high levels can be maintained in the short term. Short selling at a high level. (This view is for reference only) Specific transactions are mainly based on real-time notifications.
There was no loss in trading failures on Monday. Others look at the record by the winning rate. I only measure the record by the losing record.
The fast trading strategy is tailored for: novices. Trading losses, those who want to expand profits but do not expand profits, and those who are unclear about the direction and do not know how to analyze the market. If you are also. Then you can try to change your trading style with fast trading strategies and get rid of those hateful labels. OANDA:XAUUSD CAPITALCOM:GOLD BITSTAMP:BTCUSD NYMEX:MCL1! BINANCE:BTCUSDT

The beginning of shorting gold prices.Just now I made a profit when I bought in the London market. Now I will make a profit after selling in the New York market.
The target is about 2731 additional position.
OANDA:XAUUSD CAPITALCOM:GOLD
10.29 Gold Short-term Professional Operation AnalysisLast Friday, the gold price generally showed an upward trend. The highest price rose to 2747.56 on the day, and the lowest price fell to 2716.9, closing at 2746.25. Looking back at the details of the gold market performance last Friday, the price was suppressed by the four-hour resistance position during the early trading, and then it was under pressure to go down as expected, and then it stopped going up again after falling in the European session, and the US session rose strongly again, and finally ended with a big positive state on the daily line. At present, gold is still above the daily support of 2692, so it is still more band-oriented for the time being. At the same time, the price in the four-hour period continued to fluctuate in the range of 2710-2758.5, with the middle position in the 2730 area, so the price in the range focuses on selling high and buying low. Considering the overall bullish trend, the focus is on the subsequent upward trend in the range, and the price will continue after breaking the range.
Intraday operation:
Gold 2719-20 range is more, defending 10 US dollars, target 2730-2750

10.28 Gold fluctuates and moves upwardAs the safe-haven demand caused by the ongoing tensions in the Middle East pushed up the price of gold, coupled with the Federal Reserve's 50 basis point rate cut, the price of non-yielding gold has risen by more than 32% so far this year. The uncertainty of the US election has also stimulated the safe-haven demand for gold, as opinion polls show that the presidential election competition is still fierce. Despite the rise in the US dollar, the price of gold still rose. At the same time, the price of gold rebounded from the profit-taking trend last Friday and then rose slightly.
The high sideways trading of the daily line, the two consecutive positive rises of the weekly line and the upward support of the trend indicator MA moving average, so the overall trend is still bullish. In the European session last Friday, the bottom rebounded and the highest test was 2747.70. This morning, the price of gold continued to pull back and opened, increasing the intraday volatility. Combined with the strength of the recent retracement, it is difficult to have the momentum of a continuous and sharp decline. The intraday will continue to fluctuate.
1. There is only one negative line correction in the high consolidation process. This is also the reason why the gold price will not retrace for too long in the recent rising market, and the retracement strength is not strong and it is also consolidating near the high point, so it is expected to continue to rise and test the previous high point of 2758.40.
2. In the bull trend, the low point of the retracement last Friday was 2717, and the position of the previous retracement was supported many times at 2714, forming a double bottom pullback, so the lower low is moving up, and the upper high point of last Thursday was 2743. It closed at 2747 in the early morning of Saturday, breaking through the high point of the pullback after the decline last week. Although there was a negative line retracement this morning, it was more in the form of correction.
3. From the perspective of the overall correction strength, the space for gold price to retrace from 2605 to now is only between the golden section line of 382 and 236, and the correction space is very limited; in addition, although there are repetitiveness recently, it is still rising during the high-level consolidation process, the correction time is shortening, and the momentum to continue to test the new high is increasing.
Intraday thinking plan:
BUY:2715 SELL:2740

2731-2725 Short Sell,SELL XAUUSD
Overnight gold prices continued their bearish trend again, and the fast trading strategy members made another good profit.
Trading is like this, buy in a bullish trend and sell in a bearish trend, so as to earn the difference and make a profit.
Don't miss the deal in hesitation. I said this a month ago. Now is the best time to trade the market. Trading is a place to experience risk, passion, and thus expand profits. Whether you are a novice or an old hand, you will have different gains.
This week, most members of the fast trading strategy have achieved a profit of more than 168%. A few are less than 80% due to the time of joining the group. In addition to accurate market analysis and strict guidance, all members have achieved different levels of profit.
This is the result I want to see. This is also my original intention.
Today is the last trading day of the week. The market may not be particularly volatile, but there are still opportunities to expand profits and recover losses. If this is you, don't hesitate. The strategy of the Fast Strategy Group is definitely suitable for you. Whether you are a novice or an old hand.
Supplement. Today's trading market is mainly short at a high level. The trading strategy notified in real time by the fast team is the main one.

Did you follow the low position to buy yesterday?
If you didn't follow. It's a pity, you just missed the profit of more than 20 points.
After the big drop yesterday, it rebounded overnight. And I just announced the fast trading strategy. The market development trend is consistent with my fast trading strategy, and the target is 2725-2740. The obvious pressure is 2735-2740. At present, the increase in the Asian market and the London market is almost the same. There is a big upward pressure in the short term, so we will not buy. Selling is the main thing.
A head and shoulders posture is also formed above. Whether you have large funds or small funds, you can make money by selling gold prices.
The 2735-2740 range is mainly short-selling.
tp2724-2714, you can close it at any time when the profit reaches your expectations.
OANDA:XAUUSD BITSTAMP:BTCUSD CAPITALCOM:GOLD

10.27 Weekend Summary: Gold Wins BigIn last week's gold profit plan, the brothers of the team showed their professional strength. They perfectly predicted the trend of gold in every gold transaction, which made the profit plan for members perfectly completed last week. The total profit was 55K+ USD. Thanks again to the brothers of the team for their efforts and the trust of the members. Finally, I wish you all a happy weekend.

10.25 gold Asian market analysis ideas! !! !!Yesterday, gold began to fluctuate and rise in the early trading, and continued to rise in the European trading, reaching a high of around 2743 in the US trading. Then the market was blocked and fell. After dropping to around 2722, it rebounded to above 2730 in the late trading and fluctuated. The daily line closed with a positive line, and gold once again stood firm at the 2730 line.
On the daily line, there was a single negative decline correction on Wednesday, and a volatile rise on Thursday. There was still some resistance to falling in the short term. At the opening of today, the gold price was above the moving average. In the short term, we will first pay attention to the 5-day moving average, which is currently located near 2730. As long as it stands firmly at 2730 today, gold will definitely continue to rise.
First pay attention to the resistance near yesterday's high point of 2743, and then pay attention to the resistance near the current high point of 2758. If it continues to break through the high, we need to pay attention to the 2768 pressure level. 2768 is the current resistance position after the extension of the high point line of July 17 and September 26. In terms of intraday operations, it is still mainly low-long.
In terms of geopolitical situation, US Secretary of State Blinken said on Thursday that the United States does not want Israel to carry out protracted military operations in Lebanon. At present, all parties are working hard to hold new negotiations on the ceasefire and hostage agreement in Gaza.
In terms of economic data, the number of initial jobless claims in the United States last week released on Thursday unexpectedly fell, but the number of continued jobless claims in mid-October rose to a nearly three-year high, suggesting that it is becoming increasingly difficult for the unemployed to find new jobs.
The influence of various aspects has also further promoted the upward trend of gold. Although gold fell back on Wednesday, it still rose sharply the next day. The price is expected to break a new high again, and it is far from the target level at present.
Support level: 15 Resistance level: 35————45

10.24 Can gold reach a high level?On Thursday (October 24), gold prices partially recovered, continuing the previous upward momentum. After a brief correction on Wednesday, spot gold once again broke through the $2736-2737/ounce area, and then narrowed its gains to 0.66%. It is currently trading around $2733, up about $18/ounce on the day. Thanks to the weakening of the US dollar and the decline in US bond yields. In addition, the uncertainty in the Middle East and US politics has also increased the market's demand for safe-haven assets, further boosting the attractiveness of gold.
From a technical perspective, there is a certain downward pressure on the short-term trend of gold prices. According to the technical chart, the upward trend line of gold was broken on Wednesday, indicating that the market may have a further correction in the short term. If gold prices cannot remain above the support of the $2730-2732 range, they may face greater downward pressure. The first target is the $2700 mark. If it falls below this level, the next step will test the intermediate support of $2685, and may even fall to around $2670.
If gold can hold the key support level of $2,730 and successfully break through the recent resistance level of $2,750, the market will re-enter the upward channel. At that time, the price of gold is expected to challenge the high point of the $2,770-2,775 range again, and may even further attack the psychological barrier of $2,800.
In terms of technical indicators, the oscillator on the hourly chart shows a certain callback signal, indicating that there are still opportunities for short sellers in the short term. However, given the current geopolitical and macroeconomic uncertainties, the strength of short sellers may be limited.

Buy XAUUSD at a low level.
Today, the New York market dealt a severe blow to bullish investors. Shortly before the opening, prices began to decline, reaching a low of 2708, with a drop of approximately 50 points. This downward movement was primarily driven by heightened bearish sentiment resulting from overbought conditions, as well as negative news and comments from the Federal Reserve Chair. These combined factors led to a rapid decline in gold prices over several hours.
Currently, bearish sentiment appears to be persisting. In the short term, we need to observe whether the market stabilizes in the 2700-2708 range. If stability is achieved, gold may rebound to the 2741 level, as the market has formed a double bottom support at the hourly level. Conversely, if the market fails to stabilize in the 2700-2708 range, the lower channel will open, potentially exacerbating the downward sentiment and increasing bearish pressure.
Latest Trading Thoughts: The New York market is expected to maintain a low-range consolidation with limited trading opportunities; hence, a cautious approach is advisable. Focus on movements in the Asian market and any bullish news stemming from geopolitical developments. If the New York market does not drop below the 2708 level before the close, the probability of a rebound in the Asian market exceeds 98%, making a bullish stance prudent.
Trading Plan:
Buy Zone: 2711-2708
Take Profit: 2725-2740
Stop Loss: 2700
For those unfamiliar with trading, please stay updated on real-time trading strategies.
CAPITALCOM:GOLD OANDA:XAUUSD

10.24 Gold fluctuates upwardThe price of gold fell below the moving average and now began to fluctuate. The upper side was originally at 2755, and the lower support was at 2713. You can buy low and sell high. Yesterday evening, the price fell quickly and found the support of 2713. When the price of gold retreated, you can buy on dips.
In terms of the day, the sharp drop in the rise can be alleviated, but whether it can change direction depends on the continuation.
Only if the sharp drop continues can it be the top. The focus is on how many bulls are above 2740.
Only if the price rises in a cycle in the morning, it fell back twice in the early morning yesterday, and the watershed was 2709.
Today's data: Number of initial jobless claims in the United States as of October 19 (10,000 people)
Today's focus is whether the daily line will be negative or positive when it fluctuates.
In terms of rhythm, the European session is still the focus. If we look at the continued retreat, then pay attention to the watershed 2735, which is the empty point. Remember, once the watershed continues to break, then this high point will be formed in the short term, and there will be opportunities for the mid-term in the future.
But no matter what, there is definitely not much room for bulls above the risk area, and it is not recommended to make a layout.
Resistance level 2735 Support level 2715

10.23 Will gold turn around? Bearish view 2760In the early Asian session on Wednesday (October 23), spot gold fluctuated narrowly at a high level and is currently trading around $2,750.98 per ounce. Gold climbed 1% on Tuesday, shaking off the impact of a strong dollar and U.S. bond yields, reaching a high of $2,748.87 per ounce, setting a new record high again, closing at $2,748.86 per ounce, as the uncertainty of the U.S. election and the war in the Middle East stimulated safe-haven demand, and expectations of further monetary easing magnified the rise in gold prices.
Yesterday, gold did not continue to adjust. It broke through 2740 and is currently running at 2745. Obviously, the single-day high and fall did not cooperate with the next day's big Yin, and the short-term has not yet peaked. Yesterday's closing was barefoot Yang, suggesting that there is still inertia to rush up, so the upper track 2765 pressure will be tested again. There is no need to chase more at this time. The follow-up rise of silver and oil suggests that gold is close to the stage of adjustment. There are not many fundamental data recently. Even if there is before the election, it is fake. At the same time, the US dollar, gold, and US stocks are all rising at the same time. Obviously, it is peaceful. In fact, the biggest news is the BRICS meeting. This is a step to whether the payment system can abolish the US dollar settlement. Of course, at this time, the US dollar remains strong in order to compete for the status of international capital settlement. Therefore, there is no shock decline after the interest rate cut, but it has risen strongly since the interest rate cut. There are election reasons and suspicions of manipulation behind the scenes. I have always said that no matter who is elected, the US dollar must remain strong to cater to the essence of plundering global wealth. The two sides are talking about topics again, just for the election, but whoever is elected will remain essentially unchanged, so it is rare for gold to follow the strength of the US dollar at this time, so there is no need to chase the rise.
Resistance: 2760---2765
Support: 2700---2650

10.22 Gold intraday short-term operation guideYesterday, we entered the US market at 2715 and entered the long position, making a profit of 18K.
Yesterday, in the technical points, as long as you are bullish, you can follow.
1. Cyclic rise in the morning, this is the case in the extremely strong market. Everyone is bullish, and basically there is no retracement. If there is a retracement, it will not rise.
2. The second rise in the afternoon, the retracement position is slightly larger, but the morning rise in the strong market, the afternoon is expected to continue, one is not to break the morning low watershed, but to continue to break the European market.
3. Rapid bottoming and rebound before the US market, and 6-8 points of big sun.
10.22 intraday analysis:
1. Daily cross, the probability of this top cross is very small, and the continuous sun is still rising.
The price has reached the 2740 risk area, but the shape is not enough, and there should be another high point.
2. In the strong market, the cross is seen, this is not the top, and the probability of today's shock is relatively high. It is still cyclical rising in the morning, and it is still expected to rise in the afternoon today, and it will fluctuate at a high level.
3. If you feel that the price is high, you dare not buy more. In fact, the acceleration is not enough. At least you need to force out the short positions.
In terms of operation, it is expected to fluctuate today.
Relying on the 2713 watershed, short-term long positions are expected during the day. Looking at the situation of the European session, the upper resistance is 2732-4.

10.22 Gold hits new highs, near 2710, longOn Monday (October 21), gold prices rose for the fifth consecutive trading day to a record high, while silver prices hit their highest level in nearly 12 years, affected by factors such as uncertainty in the US election, continued tensions in the Middle East, and expectations of interest rate cuts by central banks.
Fundamental analysis: safe-haven demand supports gold prices
The current global instability, especially tensions in the Middle East, provides strong support for gold. As a traditional safe-haven asset, gold usually attracts a lot of buying when uncertainty increases, especially when geopolitical conflicts continue to ferment.
On the other hand, the market lacks the release of heavyweight economic data, and investors will pay attention to the speeches of several Fed policymakers this week. These speeches may have a significant impact on market expectations, especially in terms of monetary policy. If the Fed expresses its inclination to continue to maintain a tight policy, it may put pressure on gold prices. Conversely, any signs of easing will further push gold prices up.
The situation in the Middle East continues to ferment
Tensions between Israel and Iran are one of the main drivers of this round of gold price increases. The latest military action has further escalated the market's risk aversion. The US investigation into leaked documents has also added uncertainty. Gold naturally becomes a safe haven for investors in such an environment. In the short term, as long as geopolitical risks are not resolved, gold prices may remain high and volatile.
Federal Reserve Policy Expectations
With Fed policymakers about to speak, the market is closely watching their latest views on economic growth, inflation and monetary policy. Any hint of rate hikes or balance sheet reduction may change the market's expectations for future gold trends. Currently, gold prices remain high due to the interweaving of safe-haven demand and policy expectations.
Technical analysis: The risk of a correction is increasing
Gold bulls can break through the resistance level of $2,730, and gold prices are expected to test the psychological level of $2,750. $2,730 is currently a key watershed, and breaking through this level will greatly enhance gold's bullish sentiment and open up further room for growth.
BUY: 2,715 Target 2,730----40

There are more gold price trading opportunities in New York time
The gold price is mainly at 2728 as the first buying position, 2725 as the second buying position. 2720 is mainly the third buying position.
tp2740-2750. This target is expected to be reached in the New York market.

Gold Prices Surge to New Heights
The weekend news cycle has once again ignited tension in the market, leading to gold prices hitting a historic high of $2732 at Monday's open, followed by a sustained increase of approximately 10 basis points. This trend aligns with my forecasts, and I anticipate that both the London and New York markets will continue to rise in the coming days.
Looking ahead, gold prices are expected to reach new dimensions this week. In terms of trading strategy, I recommend employing a buy-low, sell-high approach, with particular attention to the critical levels of 2725 and 2712. Members utilizing rapid trading strategies should remain vigilant, as new strategies will soon be announced.

How to Position if you Missed the Gold RallyGold prices have reached another all-time high, supported by strong bullish momentum. However, the composition of buyers has shifted. While central banks fuelled the previous phase of the rally, institutional investors and retail buyers are now leading. Over the past six months, ETF inflows have totalled nearly $5 billion, and asset managers continue to build net long positions, nearing the peak levels seen during the pandemic.
Despite the bullish outlook, higher prices are tempering demand and reducing the potential for future returns. As an alternative, investors can opt for a tactical position using CME Micro Gold futures and the Van Eck Gold Miners ETF (GDX).
RATE CUTS ARE A GOLD DRIVER
Over the past four easing cycles, gold prices have appreciated by 10% following the start of Fed rate cuts. This time around, prices are up 5% since the first rate cut in September. That leaves room for further gains as the Fed cuts further.
Still, it is crucial to consider that gold prices are already trading at an all-time-high. Higher prices are pressuring further gains and consumer demand.
According to Prithviraj Kothari, president of the India Bullion and Jewellers Association (IBJA), gold demand during this year’s festival season in India is likely to be 20% lower YoY in terms of quantity of gold purchased.
CENTRAL BANK BUYING NO LONGER THE DRIVING FACTOR
Since April, the People's Bank of China (PBoC) has halted gold purchases, while Poland and India acquired 24.3 tons and 17.7 tons of gold, respectively, between June and August, exceeding their purchases from March to May. However, the pace of buying from these central banks may be slowing. The latest data from the Reserve Bank of India (RBI) shows a decline in gold reserves by $98 million to $65.6 billion, indicating a slowdown in gold accumulation despite still substantial holdings.
One of the largest buyers of gold this year, Turkey, also slowed its pace of purchases as it acquired just 7.9 tons of gold between June and August compared to 27.6 tons between March and May.
Source: World Gold Council
Additionally, the urgency for central banks to buy gold has lessened. Earlier, rising yields and a strong U.S. dollar prompted increased gold buying. As U.S. interest rates decrease, a weakening dollar is expected.
ASSET MANAGERS NET LONG POSITIONING IS NEAR ALL-TIME-HIGH
Asset Manager net long positioning has increased consistently over the last six months. It is near the highest level since the pandemic and 2016. Crucially, the increase in long positioning has been driven by both increasing longs and declining shorts indicating bullish consensus among asset managers.
SUBSTANTIAL ETF INFLOWS OVER THE PAST 6 MONTHS
Gold ETFs listed in the US have accumulated USD 4.9 billion in inflows over the past 6 months. Inflows have grown by more than USD 1.7 billion since the Fed cut rates in September. While substantial outflows were observed on 8/Aug as global markets fell sharply, the decline was reversed in just 2 weeks.
Gold ETF inflows tend to follow cyclical patterns, and their current levels are relatively modest compared to previous inflow cycles, which have been significantly larger.
Substantial flows to gold ETFs and rallies in gold prices also tend to trigger flows into gold miner ETFs. Though these flows tend to lag flows into gold ETFs by several months.
GOLD MINERS HAVE STARTED TO CATCH UP
The outlook for gold remains mixed. While bullish momentum is supported by the anticipation of a Federal Reserve easing cycle, gold is already near all-time highs, which is discouraging further investment, particularly from retail investors.
A strategic way to capitalize on the later stages of a gold rally is through gold mining stocks. Gold miners typically lag behind gold during rallies, as returns from equities take longer to materialize and involve greater risk compared to direct gold investments. However, the impact of higher gold prices on miners' profitability is clear. In Q2 2024, Barrick, the world's largest gold miner, saw net income rise by 24% quarter-over-quarter, driven by a 13% increase in realized gold prices. Similarly, Newmont's net income increased by 32%, alongside a 12.3% rise in gold prices.
Gold miners are also benefiting from easing cost pressures. While costs remain high compared to last year due to inflation and energy-related increases, they improved in Q2, and further reductions are expected based on company guidance.
The gold to gold miner ratio is a cyclical quantity that has been trending higher for decades but also tends to mean-revert when the ratio edges to far in either direction.
As the ratio is due to cross the 200-week moving average, it may be due for an extended period of decline favouring gold miners.
HYPOTHETICAL TRADE SETUP
Gold remains bullish through the Fed easing cycle and strong investment demand provide momentum. However, higher prices are dampening consumer demand and central bank buying is slowing. Further increase in gold is likely, however, further gains may be limited. Gold prices have already realized half of their average increase following a rate cut.
Alternatively, a position that is long on gold miners also benefits from rising gold prices.
Gold prices, as tracked through gold futures, are highly correlated with gold miners, measured by ETFs like GDX and SGDM, with a correlation coefficient typically near 0.9, though there are occasional period breaks. Since December 2023, gold prices have outperformed SGDM by nearly 20% and GDX by 5%.
As the current gold rally progresses, increased flows into gold miner ETFs are expected to support their prices. Additionally, improving cost structures for miners and higher realized gold prices create positive momentum.
Investors can hedge a long position in GDX by taking a short position in CME Micro Gold futures. This hedge protects the ETF position against potential declines in gold prices. The smaller contract size of CME Micro Gold futures makes them ideal for precise hedging, particularly given the smaller unit size of ETFs like SGDM.
637 units of GDX (at a price of 43.15 as of 18/Oct) are balanced by a hedge of 1 CME Micro Gold futures contract expiring in December. CME Micro Gold Futures require margin of just USD 1,100 while the GDX leg requires notional of USD 27,470.
The position offers multiple income-generating advantages. The GDX ETF provides a net dividend yield of 0.65% (after accounting for the management fee), and the short position in CME Micro Gold futures benefits from contango, which adds approximately 1% per quarter.
The payoff scenarios for this position are provided below:
MARKET DATA
CME Real-time Market Data helps identify trading set-ups and express market views better. If you have futures in your trading portfolio, you can check out on CME Group data plans available that suit your trading needs tradingview.com/cme .
DISCLAIMER
This case study is for educational purposes only and does not constitute investment recommendations or advice. Nor are they used to promote any specific products, or services.
Trading or investment ideas cited here are for illustration only, as an integral part of a case study to demonstrate the fundamental concepts in risk management or trading under the market scenarios being discussed. Please read the FULL DISCLAIMER the link to which is provided in our profile description.

10.21 Gold Asian session longs,Gold did not fall back too much after the Asian session opened, and continued to rise steadily. Then the downward correction of gold would not be too large. If the correction was too large, it would mean that the rise of gold had ended. If gold fell slightly in the early trading, you could continue to go long.
The 1-hour moving average of gold continued to diverge upward. Gold fell back to 2713 several times on Friday night and began to stop falling and rise. If gold fell back in the early trading, you could continue to go long first.
Gold bulls continue to be strong, so gold bulls have not ended yet. Without a rapid upward surge, gold bulls will not end. Gold falling means continuing to go long.
