Can gold prices continue to rebound?Market news:
Spot gold rose slightly in early Asian trading on Thursday (June 5), currently trading around $3,382/oz. Supported by a weaker dollar and weaker U.S. data, investors are struggling to cope with growing economic and political uncertainty. Against the backdrop of rising risk aversion demand and weak economic data, gold prices rose slightly. At the same time, tensions between major powers, progress in EU-U.S. trade negotiations, and rising market expectations for a Fed rate cut have further ignited enthusiasm in the gold market, and the possibility of London gold prices rising above the 3,400 mark has increased.
The job market is sluggish, some industries are laying off employees, and wage growth is offset by the cost of living. Inflationary pressures continue, and companies plan to raise prices to pass on tariff costs. The Fed said the economic outlook is unclear and it will continue to monitor data to adjust its policies. As a safe-haven asset in times of political and economic uncertainty, gold tends to perform strongly in a low-interest rate environment.
Investors are closely watching the U.S. non-farm payrolls report to be released on Friday, June 6, for clues to the Fed's next move. In addition, we also need to pay attention to the ECB interest rate decision and the changes in the number of initial jobless claims in the United States on this trading day. The market expects the ECB to cut interest rates by 25 basis points. In the medium and long term, it tends to support the international gold price. In addition, continue to pay attention to the international trade situation and speeches by Fed officials.
Technical Review:
Gold successfully bottomed out yesterday, with the lowest point of the day at 3344, which is not much different from the point of 3345 that we disclosed in the morning. The market point is basically in place. The small non-agricultural positives in the evening helped the gold price to rise further. The high point of gold is gradually approaching the pressure level of 3392. In the short term, the gold price is expected to break through the pressure and continue the upward trend!
The technical side of gold maintains the bullish low-multiple thinking. The daily chart price extends the MA5/10/7-day moving average high point upward, and the RSI indicator is hooked upward above the middle axis. The short-term four-hour chart and hourly chart moving average open upward, the Bollinger band opens upward, and the price is running on the upper and middle track of the Bollinger band. The main idea is to buy at a low price and sell at a high price.
Today's analysis:
Recently, the market, tariff trade policies, and geopolitical tensions have been affecting the strength of the US dollar and gold. Although it seems that gold is fluctuating upward for the time being and has not gone out of the space for a unilateral surge, it can be seen from this week's slow rise that gold is still an absolute buying trend. Therefore, no matter how it adjusts, falls back, or fluctuates, it is an opportunity to buy into the warehouse.
How to plan for the future market? I believe everyone has a clear direction in mind. Buying is very strong, just go with the trend. The important thing is the point. The low point below is moving up, which means that if the gold price drops again, the low point will not fall below 3344. Yesterday, the gold Asian and European sessions were in a volatile adjustment trend. After the release of the US session data, the gold price rose from 3350 to the current price of 3385 and then fell back. In terms of short-term operations, since the high point of the Asian session broke, it is still recommended to buy at a low price and focus on bullish operations.
Operation ideas:
Short-term gold 3350-3360 buy, stop loss 3340, target 3380-3400;
Short-term gold 3397-3400 short, stop loss 3408, target 3360-3340;
Key points:
First support level: 3363, second support level: 3350, third support level: 3333
First resistance level: 3388, second resistance level: 3396, third resistance level: 341
Goldminers

XAU/USD) Technical analysis Read The captionSMC trading point update
Technical analysis of Gold (XAUUSD) on the 1-hour timeframe. Here's a breakdown of the key ideas in the analysis:
---
Chart Elements:
Support Level (Yellow Zone at ~3,340–3,350):
This area has been highlighted as a key support zone where price has bounced previously.
Price is currently hovering just above this level.
Downtrend Line:
A descending trendline is drawn, indicating a short-term bearish trend.
A breakout above this line could trigger bullish momentum.
Two Scenarios Outlined:
Bullish Scenario:
If price breaks the downtrend and holds above support, it may rally towards the upper target point at 3,419.68.
Bearish Scenario:
If price breaks below the support, the next target point is marked lower around 3,300.62, a previous consolidation area and close to the 200 EMA (blue line).
200 EMA (~3,324.72):
Acts as dynamic support. If price moves below it, bearish sentiment may increase.
RSI (Relative Strength Index):
RSI is neutral (~50.54), not showing overbought or oversold signals, leaving room for movement in either direction.
---
Key Takeaways:
Neutral-Biased Setup: The price is consolidating between a clear support level and downtrend resistance.
Confirmation Needed: A breakout from either direction is necessary to confirm the next move.
Bullish Breakout: May lead to a retest of highs at 3,419.68.
Bearish Breakdown: Could push the price toward 3,300.62, aligned with past support and the 200 EMA.
Mr SMC Trading point
---
Trading Ideas (based on this analysis):
Long Entry: On breakout above the downtrend line + confirmation above 3,360.
Short Entry: On breakdown below 3,340 with strong volume.
Stop-Loss: Just outside the consolidation zone depending on trade direction.
Risk Management: Be cautious around economic news (calendar icons shown suggest upcoming events).
Please support boost this analysis )

If the direction is unclear, don’t panic, respond flexibly!Gold has been showing a daily yin-yang alternating pattern since last Wednesday, but the overall rising rhythm has not been broken. The MA5-day moving average and the MA10-day moving average formed a golden cross and continued to extend upward. The arrangement of this moving average system provides a certain support momentum for the gold price. During the day, we need to focus on the support effect of the moving average. The current 5-day moving average is near 3340, and the 10-day moving average is near 3325. These two positions constitute an important support area for the short-term gold price correction. In terms of upper resistance, first pay attention to yesterday's high of 3392. If the gold price can break through this resistance level, it means that the upward momentum is strong, and it is expected to continue to be strong to 3400-3420, further opening up the upward space.
From the 4-hour chart, as long as the short-term gold market is above 3330, then gold is still in a strong bullish trend. On the contrary, if it falls below the closing line near 3330, then it is a broken trend line, and the subsequent market is likely to form a weak shock pattern again, so the current operation is actually very simple. As long as the 3330 position is not broken, you can rely on 3330 to enter the market and do more. Focus on the support near yesterday's low of 3333 below, and focus on the resistance near 3375-3380 above.
Gold operation suggestions: It is recommended to short gold near 3365-3375, with a target of 3350. Go long gold when it falls back to 3335-3345, with a target of 3360-3370.

The secret behind the surge in gold prices
💡Message Strategy
(June 2) Gold prices soared nearly 3% as U.S. President Trump's tariff threats intensified trade tensions, stimulating investors' demand for safe-haven assets, and the U.S. dollar plummeted.
The dollar index fell nearly 0.8% on Monday. The sharp drop in the dollar makes dollar-denominated gold cheaper for holders of other currencies.
US President Trump said last Friday that from June 4, the tariff on US imported steel and aluminum will be raised from the current 25% to 50%. British Reuters said that this has once again disrupted international trade.
A spokesman for the European Commission expressed strong regret over the US announcement that it would increase tariffs and said that the EU is ready to implement countermeasures. The Canadian industry also expressed strong opposition, emphasizing that disrupting the cross-border supply chain of steel and aluminum will cause huge losses to both Canada and the United States.
📊Technical aspects
On the daily chart, gold rebounded from a two-week low and hit a four-week high this week, with a strong short-term trend.
For gold's lower support, focus on the breakout position of $3,350 in the U.S. session on Monday, which is also near the high point of gold last week, and the low point of $3,345 after the gold price rose in the European session on Monday;
For gold's upper pressure, focus on the integer position of $3,400 and the upper track of the daily Bollinger band near $3,410. For further strength, focus on the high of gold in May at $3,438.
The 5-day moving average and the MACD indicator re-formed a golden cross, and the KDJ and RSI indicators formed a golden cross downward. The short-term technical aspect shows that after the adjustment of gold, the bears began to gain an advantage.
💰 Strategy Package
Short Position:3385-3375,3395-3410

Gold's rebound is weak and the bearish trend is dominant.The 1-hour gold chart shows that the Bollinger Bands open downward, and the gold price is running near the lower track, with a weak short-term trend. If it fails to rebound effectively and break through the 3290 line, the support below will focus on the 3240-3230 area. Overall, the gold price fluctuates downward, the moving average system is in a short position, and the downward pressure is further revealed. It is currently recommended to continue to maintain a high-altitude thinking and focus on short-selling opportunities after the rebound.
In the short-term operation of gold during the day, rebound short-selling is the main focus. Pay attention to the pressure level of the 3290-3280 area above, and the support level of the 3240-3230 area below. In terms of operation strategy, it is recommended to arrange short orders when the gold price rebounds to the 3280-3290 range. This is a key pressure area, and it is necessary to pay attention to the market reaction in this range.

The golden range strategy continues to workGold bottomed out and rebounded as expected today. Friends who follow me should be able to clearly feel that I have been insisting on analyzing the trend of "bottoming out and rebounding" recently. Today, gold opened at 3300, and rebounded after the lowest price fell to around 3291. So far, the highest price has reached 3325. Overall, the support below gold is still strong, but the suppression above cannot be ignored. Therefore, the market performance yesterday and today was relatively stable, with small fluctuations as the main trend.
In terms of operation ideas, continue to pay attention to the support level of 3290-3295. If it falls back and does not break, maintain a bullish mindset. At present, the long orders in the 3290-3295 range have been notified to enter the market as planned, and are currently in the profit stage. If you encounter difficulties in the current gold market operation, I hope my analysis can help you. Welcome to communicate at any time.
From the 4-hour cycle chart, the support below gold is around 3290-3295, and the pressure above is concentrated in the 3330-3340 range. In the short term, the watershed between long and short is around 3275-3283. Before the daily level effectively falls below the watershed, it is still in a long-short shock pattern, maintaining the main theme of "high-altitude and low-multiple" cycle participation.
Gold operation strategy: If gold falls back to the 3290-3295 line, you can try to go long. If it further falls back to the 3280-3285 line, you can consider covering long orders, and the target is around 3316-3320.

XAU/USD) 3 top technical analysis Read The ChaptianSMC trading point update
Technical analysis (XAU/USD) on a 4-hour timeframe, with key elements and potential price scenarios illustrated. Here's a breakdown of the idea behind this analysis:
---
1. Key Levels and Zones
Resistance Zone (~3,320–3,330):
Marked with red arrows indicating multiple rejections.
A crucial supply zone that the price failed to break several times.
Support Zone (~3,280–3,290):
Labeled as “nak support level” (likely means "neckline" support in a possible head-and-shoulders structure or just a key level).
Important for bullish structure continuation.
Lower Target Zone (~3,205):
A demand zone if the support fails.
Labeled as another “target point” indicating a bearish projection.
---
2. Trend Context
The price was in an upward channel (highlighted as "up trend"), which has now been broken.
EMA 200 (~3,251) is acting as a dynamic support.
---
3. Potential Scenarios
Bullish Scenario (Red/Blue Arrows Up):
If the price holds the “nak support level” and breaks back above resistance (~3,320):
A bullish move toward 3,367 and even 3,435 is expected.
The blue arrow shows a projected upside target of ~105 points.
Bearish Scenario (Black Arrow Down):
If the price breaks below the neckline/support and EMA 200:
A drop toward the 3,205 area is anticipated.
Target aligns with previous structure lows and a clean demand zone.
---
4. RSI Indicator (Bottom Panel)
RSI is hovering around neutral (~45–50), offering no strong momentum bias.
Could support either a bounce or a breakdown, depending on upcoming moves.
Mr SMC Trading point
---
Conclusion / Idea Summary
This chart presents a conditional trade setup:
Above 3,320: Long toward 3,367–3,435.
Below 3,280–3,250 (and EMA 200): Short toward 3,205.
The market is currently at a decision point, and traders should wait for confirmation (breakout or breakdown) before entering a trade.
Pales support boost 🚀 analysis follow)

Gold fluctuates repeatedly, and the opportunity has come
Gold hit 3325 in the European session, and fell under pressure in the US session. It can be seen that the market still has no continuity, and the recent volatility is narrowing compared to the previous period. The whole month of May was a wide range of roller coaster fluctuations.
The oscillating market is to operate at the point of card. Wait for a one-sided trend and then follow the trend. Short-term US market rebounds to 3315 to short, and use the intraday high as defense. The 1H cycle support below 3280/3290 is long in batches, and other positions are not involved.

How to seize this golden short-term opportunity!Yesterday, gold continued to fall from its highs, and the short-term trend was in line with our expectations. The lowest price of gold yesterday hit around 3285, which was also the long area given in yesterday's analysis. In addition, the secondary layout of long orders in yesterday's analysis brought us good returns.
At present, gold is in a rebound stage as a whole. Although the momentum and amplitude of the rebound have not increased significantly, this trend has shown signs of a gradual recovery in the market. In terms of short-term operations, it is recommended to follow the trend and wait for the price to fall back before choosing an opportunity to go long. Yesterday, the gold price fell again to around the 3285 mark and received effective support. Today, we still need to focus on the support performance of this area.
From the perspective of the 4-hour cycle, today's gold price relies on this area as a short-term strength and weakness dividing line for long and short layout. The lower support focuses on the 3275-3283 range, and the upper pressure is around 3316-3320. The short-term key watershed is around 3275-3280. As long as the daily level does not effectively fall below this area, the overall judgment of the long and short shock range is still maintained. In terms of operation, the "high-altitude and low-multiple" rotation idea will continue to be the main focus. If the market situation or rhythm changes, the strategy will be adjusted in time according to the actual market situation and will be notified separately.
Gold operation strategy reference:
1. If gold falls back to the 3275-3285 area, you can consider placing long orders, with the target at 3316-3320.
2. If gold rebounds to the 3316-3321 area, you can try to short with a light position, with the target at 3288-3290.

Gold is about to reach the shorting zone
The tariff policy against Europe and Apple was temporarily shelved last Friday due to the decline in the credibility of the Trump administration, which failed to push gold prices up this week. Instead, gold prices continue to fluctuate within the downward channel. Currently, the focus is on the resistance level of $3,325-3,335, and shorting can be attempted near this level.
Pay close attention to whether the support level of $3,280 and the resistance level of $3,365 are broken.

3278-3320 key position is mainly high sell low buyAt present, gold rebounded after falling back to 3287, and fluctuated around 3300 in the short term. Pay attention to the support area of 3278-3283 below. If it does not break this area, you can still try to go long in the short term. After all, from a technical point of view, the decline during the day is a correction and adjustment to the previous rise.
From the 4-hour chart, the upper short-term focus is on the suppression of the 3316-3320 area, and the lower focus is on the support of 3278-3283. In terms of operation ideas, continue to maintain the interval strategy of "high-altitude and low-multiple", rely on key positions to sell high and buy low, and wait patiently for effective signals before entering the market. If the structure or rhythm of the market changes, the strategy will be adjusted in time and notified separately.

Jaguar Mining starting to ExplodeA brief pause in the gold run may be a good time to pick up some of these cheap miners I'm coming across. For those less risk tolerant (is that possible in the mining sector?), AEM , GDX, WPM and others are breaking to new highs. I see WPM at 75 within the next year or two and big moves from NEM from current levels. If you have nothing in gold/silver/miners sector, a 5% spec position in your portfolio will add to your 2025 gains!

XAUUSD[GOLD]: 1 Hour View Show Extreme Seller Volume Gold in a shorter time frame shows extreme bearish volume kicking in the market, where bulls are failing to push prices higher. Additionally, if you’re someone who analyses patterns, a HEAD AND SHOULDERS pattern has also formed. There are three targets you can aim for.
We extend our best wishes and good luck in your trading endeavours. Your unwavering support is greatly appreciated.
If you’d like to contribute, here are a few ways you can assist us:
- Like our ideas
- Comment on our ideas
- Share our ideas
Team Setupsfx_🚀❤️

Buying on pullbacks remains the main theme!Tariff turmoil resurfaces, gold price jumps!
The Trump administration once again wields the tariff stick, threatening to impose a 50% tariff on the EU from June 1, and saying that there has been no progress in the negotiations between the US and the EU. Because the timing of this threat is quite subtle. Just earlier this week, the EU just submitted a new framework proposal to the US to restart bilateral trade negotiations. This directly led to a jump in gold price tonight!
Faced with the tough stance of the US, the EU is not sitting still. It is reported that the EU has formulated a contingency plan. If the negotiations fail, it will impose additional tariffs on US exports worth 95 billion euros in response to Trump's "reciprocal" taxation and 25% tariffs on cars and some parts, which will inevitably cause further impact on the market!
The bulls are in control and are unwilling to give the bears too many opportunities to cover their losses. Therefore, the strategy of following the trend needs to be more active - strong markets usually do not experience a deep retracement, and the correction phase will not break the previous low for the second time. After the current gold price surged to 3365, the intraday bull defense position should be set at 3340. The previous low of 3320 has been effectively supported, and the bulls have taken the absolute initiative, and there will be no short-selling opportunities in the short term. Based on the current strong bullish performance, continuing to maintain a bullish mindset is the core of the transaction.
Operation strategy:
1. Gold recommends going long in the 3340-3330 area, with a target of 3350-3360.
2. Gold recommends going short in the 3365-3375 area, with a target of 3350-3340.

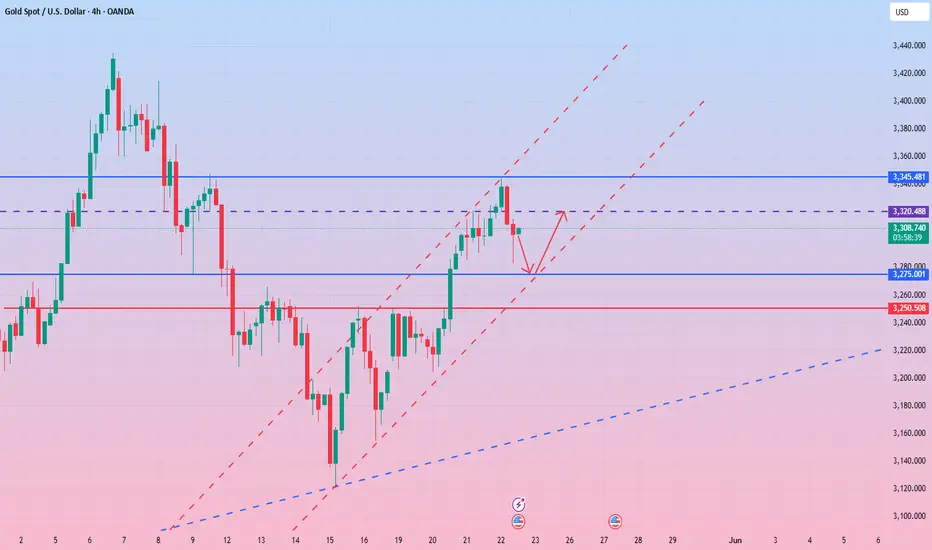
Seize the opportunity in the gold marketGold fell after reaching a high point during the day, reaching a high of 3345 before going out of the big drop space, and the evening star appeared in the 4H cycle. Combined with the correction of the top divergence of the indicator, the short-term will enter the adjustment stage. Pay attention to the middle track support around 3280-75 in the future market. If it does not break, you can consider going long. Pay attention to the upper pressure of 3320 and 3335. Keep the idea of shock in operation!
Operation suggestion: Go long on gold around 3280-3275, and look at 3300 and 3320. Go short if the rebound pressure of 3320 is not broken.
The unilateral offensive is fierce: the bulls have clear goalsGold is performing strongly sideways. We are in the same rhythm as yesterday and continue to maintain bullishness. Gold broke through the key resistance of 3280 on Tuesday and then rose strongly. It is currently above the area near 3330. The technical side shows that the bullish trend continues. The next target may point to the high of 3400. After rising continuously on Monday and Tuesday, it slightly adjusted back to around 3285 on Wednesday and stabilized before rising again. The daily line closed positive and stood firmly on the middle track. The Bollinger band opened upward, and the upper track pressure was at 3400, suggesting that the medium-term upward space is open. The Bollinger band opened significantly, the moving average was arranged in a bullish pattern, and the upward momentum was strong. Short-term support focuses on the moving average at 3315. If the correction does not break this position, the trend long order can follow up. If the key resistance of 3350 is effectively broken, it will further open up the upward space.
Gold operation suggestions: continue to go long after stepping back to 3320-3315, with a target of 3350. If it rises to around 3350 without breaking, you can arrange short-term short orders, with a target of 3330.

Rebound firmly short-sellingThe US dollar index continued to fall yesterday, breaking through the 100 integer mark, but the gold price did not break through the key resistance level. In the short term, we need to be alert to the risk of gold price correction. In addition, the three major US stock indexes have continued to rise recently, but the market risk appetite has decreased. We need to be alert to the market panic and liquidity tightening that may be caused by the stagnation of the US stock market's rise, which will put pressure on the gold market. Technically, the gold price was blocked at the important pressure level of 3250 yesterday, and the support below was at the 3200 mark. In the short term, it is still mainly range-bound. At present, the upper resistance is 3226-3233, and the lower support is 3189-3184. In terms of operation, it is recommended to rebound short and supplemented by callback long.
Operation strategy 1: It is recommended to rebound short at 3228-3235, and the target is 3210-3193.
Operation strategy 2: It is recommended to pull back to 3189-3185 and go long, and the target is 3215-3235.

Gold Trends and Trading StrategiesThe gold market continued to fluctuate yesterday, and the price was repeatedly under pressure at the key position of 3250. At the weekly level, gold prices tried to rebound after bottoming out on Friday, but the upper short-term moving average formed technical suppression, and the daily line closed with a cross star with long upper and lower shadows, and the long-short game was fierce. From a technical perspective, the 4-hour chart shows a descending channel pattern. The price rebounded after testing the lower track of the channel many times, but it has never effectively broken through the 3250 central axis suppression. The hourly chart shows that the market maintains a rhythm of shock correction. The current daily line has two Yins and one Yang, but it has not effectively broken the previous low. It is expected that the bottoming and rebounding mode may continue today. In terms of operation, it is recommended to pay attention to the 3260-3200 range, and rely on the upper and lower edges of the channel to implement a high-altitude low-multiple strategy.
Gold operation suggestions:
1. Short near the rebound of 3247-3252, target 3230-3220.
2. Go long near the retracement of 3206-3215, target 3230-3245.

(XAU/USD) Buy Trade Setup – Entry, Target & Risk Management PlaEntry Point:
3,140.34 USD
This is the suggested level to enter a long (buy) trade.
Stop Loss (SL):
3,121.66 USD
A protective level to limit losses if the trade goes against the setup.
Target Point (Take Profit - TP):
3,251.33 USD
This is the EA target point — where profits are expected to be taken.
---
3. Risk/Reward Ratio:
Risk: From 3,140.34 to 3,121.66 = 18.68 points
Reward: From 3,140.34 to 3,251.33 = 110.99 points
Risk/Reward Ratio ≈ 1:6, which is very favorable.
4. Resistance Point:
Around 3,222.45 - 3,227.27
This area might act as a challenge for price movement, potentially leading to temporary retracements.
5. Indicators:
Moving Averages: Red (shorter period) and Blue (longer period) lines help indicate trends.
The price is moving above the short-term MA but currently under the long-term MA, which might suggest a short-term bullish move within a broader downtrend or sideways range.
Conclusion:
This is a bullish setup, anticipating a reversal or continuation to the upside after a pullback:
Buy Zone: 3,140.34
Stop Loss: 3,121.66
Take Profit: 3,251.33
If the price drops to the entry point zone

The current price of gold is 3230, so go short directly!
Gold began to fluctuate in a large range. Don't chase long positions easily at high levels. Gold opened under pressure and fell back at 2350. Then the double top of gold rebounded in 4 hours and continued to fall, and then fluctuated in a large range. The current price of gold is 3230 and it is directly short!
Gold did not form an upward breakthrough in 4 hours, so it is likely to be a volatile market. Since gold is fluctuating, if gold falls below 3200 again, it may weaken further. Then gold will start to fluctuate in a large range in 4 hours. Gold rebounded under pressure and went short first.
The market is changing rapidly, and gold is now experiencing great ups and downs. In the short term, we still need to pay attention to continued highs and falls. Gold should focus on the gains and losses of the 3200 line. If gold does not break 3200 for a long time, then gold may form support, and then gold bulls will have upward momentum.
European trading operation ideas:
Gold short at 3230, stop loss at 3240, target 3200-3180;

Can a V-shaped reversal continue the bull market?🗞News side:
1. Hamas official: If a permanent ceasefire is achieved, control of the Gaza Strip can be handed over
2. Fed Chairman Powell: The Fed is adjusting its overall policy-making framework. Zero interest rates are no longer a basic situation. The wording of underemployment and average inflation rate needs to be reconsidered. PCE is expected to fall to 2.2% in April.
3. Russia and Ukraine reached a ceasefire at the technical level
📈Technical aspects:
Yesterday, the gold price staged a V-shaped reversal and once rose to close near 3244. Although the technical indicators in the hourly chart show a favorable situation, there has been no correction in the current round of gold price increase, and the rise is slow. In addition, the RSI has entered the overbought area, so we need to be alert to the possibility of gold price correction today. Focus on the 3250-3260 resistance on the top and the 3210-3200 support on the bottom.
SELL 3245-3250 TP 3210-3200
If you agree with this view, or have a better idea, please leave a message in the comment area. I look forward to hearing different voices.
OANDA:XAUUSD FX:XAUUSD TVC:GOLD FXOPEN:XAUUSD FOREXCOM:XAUUSD

XAU/USD) bearish trand analysis Read The ChaptianSMC Trading point update
Technical analysis of XAU/USD (Gold vs. USD) on the 4-hour timeframe suggests a bearish outlook. Here's a breakdown of the key elements:
---
Key Levels:
1. Resistance Zone (Upper Yellow Block):
Around 3,450–3,500.
Price was previously rejected from this level, forming a double-top like structure.
2. Rejection Point (Mid-Level Zone):
Near 3,300–3,310.
Price repeatedly failed to break and hold above this zone, indicating strong selling pressure.
3. Support Zone / Demand Block (Lower Yellow Block):
Around 3,100–3,125.
This is the target area, labeled clearly as TARGET POINT: 3,116.501.
---
Indicators:
200 EMA:
Currently above the price, suggesting downward momentum.
Acting as a dynamic resistance.
RSI (14):
Around 39, slightly above oversold territory (30).
Indicates bearish pressure but not yet oversold — room for further downside.
The chart suggests that if price breaks below the mid-level support, we could expect a move towards the support block around 3,116.
The bearish wave projection drawn in the chart confirms the trader’s expectation of a drop.
The setup appears to be a break-and-retest of the mid-zone, followed by continuation downward.
Mr SMC Trading point
---
Trading Idea Summary:
Bias: Bearish
Entry Trigger: Break below ~3,225–3,230 with confirmation
Target: ~3,116
Invalidation/Stop: Close above 3,300–3,310 (rejection zone)
Pales support boost 🚀 analysis follow)

Decisively start the short-selling layoutThe results of the China-US talks were significant and exceeded market expectations. China and the US issued a joint statement, the core of which was to end the tariff war and reduce the tariffs of both sides to 34%, of which 24% will be temporarily exempted within 90 days.
At present, there is still a demand for a rebound. For the US market, we should first look at the area around 3245-55. If the rebound is in place, continue to play short orders to look at the target position of 3200. If it breaks upward, find a new point layout. This week's data and news will have a further impact on gold.
Operation suggestion: Short gold when it rebounds to around 3245-3255, pay attention to 3220 and 3200
