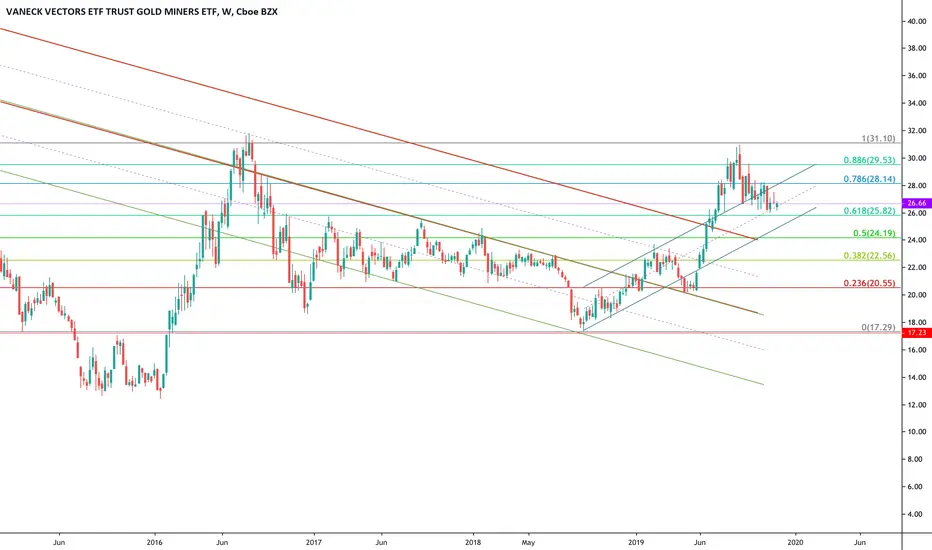
Gold miners - laggards in a rallyGold is rallying very hard, and the GDX Gold miners ETF is lagging behind. It is only a matter of time before it catches up, and is already beginning that catch up journey. This morning, it is up 1.5% and launching off, after a higher low bounce off a support region (grey box). Technicals are supportive, as is correlation to Gold prices. The MACD crossed up after consolidation. By next week, it should be breaking out over the trendline, and upside is >15% to target.
Goldminers

Royal Gold - another miner to buy at supportNASDAQ:RGLD is one of the leading stocks in gold mining industry. It started major rally earlier than majority of other miners last spring. And was one of the first stocks to caution that pullback is likely in AMEX:GDX in January 2020.
Right now it sits right near major support level, and in bullish scenario this is constructive level from which new leg higher should start.

ABX : Buy Setup
There are 3 reasons why I chose ABX stock:
I am looking forward to a downward movement in USDCAD. (More explanation on Related Ideas.)
I also follow up the stocks related to the precious metal sector traded in the S&P 500 Index.
You can follow and let's communicate )
I think that precious metals are discounted according to the World indices.This is the most important reason. (More explanation on Related
Ideas.)
Technically, it is suitable for long position.
Parameters
Risk/Reward Ratio : 1/2.59
Stop-Loss : 21.79
Goal : 25.88

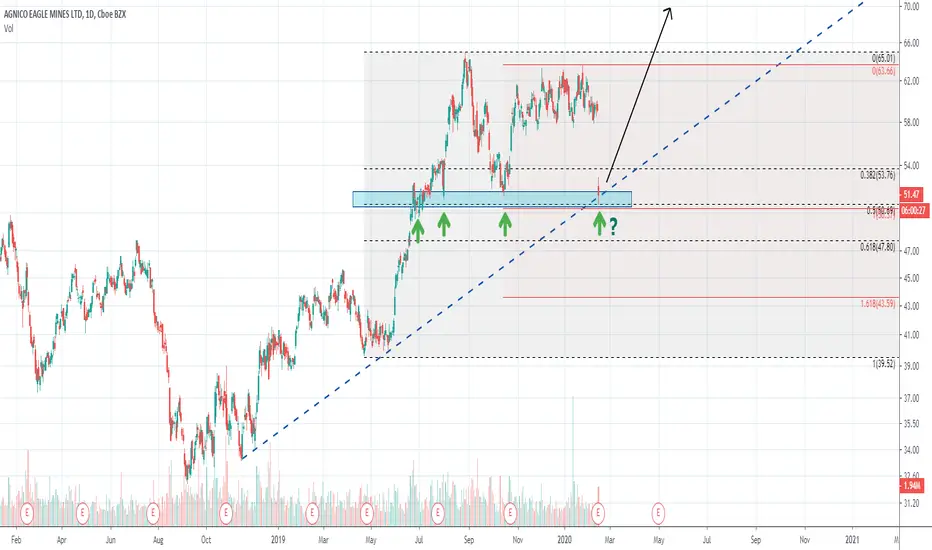
AEM - good low risk entry?NYSE:AEM is punished after earnigns release this morning. However good level to attempt low risk entry as price is at major support zone right now.
AXM.V -- $47M mcap play with a proven $900M+ GOLD depositAXM.V should be on the radar of every #gold investor. $47M mcap company with NI-43-101 compliant resource worth $700M+ USD in the Central African Republic and other promising projects in Africa. Rapidly improving security situation and recently announced strategic partner point to a major opportunity, imo.
Bullish MACD cross on the daily chart, bullish RSI/Stochastic following a gap up on the Strategic Partnership LOI announcement. The line "First Strategic Partner" in the latest news release seems to indicate that more material developments are on the way.

IAG - bottom in place?Few weeks ago I mentioned that NYSE:IAG is in good area to make a bottom, and based on recent price action, good odds that bottom is already in (for bullish case to be valid).
Major potential inverted H&S in the making and should not really go below 2.70$, where I am also placing my stop

IAMGOLD -time for a bottom?Miners have potential to be one of top players this year, and today I am looking at chart of NYSE:IAG . Stock reached perfect targets within wave 2 corrrection based on fibo levels, and price also created bullish engulfing candle yesterday . At the same time, price may also be forming bottom within right shoulder in inverted H&S. Looks promising for low risk entry buy

Silver Junior Miner Value Hunting - SPA / SPAZFSpanish mountain has very little debt and is highly leveraged to the price of silver.
Very little downside here, tons of mid & long-term upside potential. Intrinsically undervalued company & assets. They're sitting on a literal mountain of silver trading well below their 2016 peak.
Conservatively I see SPA / SPAZF increasing 150% in 2020. All this requires is SPA getting back to its 2016 high when silver was at $19.
If we get $21 or $25 silver, which I believe is highly likely in 2020, then a 1.5 bagger in Spanish Mountain is pretty much guaranteed.
It could fall from 9 cents to 6 or 5.5 cents, which is a 30-40% loss, and it could easily rise 150%. That's an extremely favorable risk-reward.
If silver were to rise to $30, SPA could rise 400%. 50$ silver would give us close to 1000% gain in SPA.
And eventually, when we get 3 digit silver. Whether that's $100 silver or $500 silver. Juniors such as Spanish Mountain could become 20-100x baggers.
Think long-term ;)

YRI : Long SetupThere are 3 reasons why I chose YRI Stock :
I am looking forward to a downward movement in USDCAD . (More explanation on Related Ideas.)
I also follow up the stocks related to the precious metal sector traded in the S&P 500 Index .
I think that precious metals are discounted according to the World indices.This is the most important reason. (More explanation on Related
Ideas.)
Technically, this chart is suitable for long position too.
Parameters
Position Size : I recommend a small portfolio weight just in case.
Risk/Reward Ratio : 1/3.49
Stop-Loss : 4.16
Goal : 6.36

Silver Target of $26 as Silver Plays "Catch Up" to GoldSilver had a nice surge earlier in the year as Gold surged to $1550. Overall, Silver has underperformed gold this year and remains undervalued relative to gold. As the metals finish and round out of this consolidation (retest of the breakout) look for gold to move towards $1711 and $1834. Silver and Platinum will both follow gold's move and will outperform. We could see $26/oz Silver and $1200/oz Platinum as soon as the 2020 spring.
Silver needs to hold above key support, which lies around $15.65-$16.10. A break below this would not be good for the metals market.
I will be accumulating shares of junior silver miners throughout this consolidation.
Miners can be volatile. Know your risk tolerance, know what you're trying to achieve.

Gold Mining Sector is a No-Brainer. Cheapest it has ever beenGold miners versus the price of gold itself is the cheapest it has ever been.
The gold mining sector cannot go to zero and it is the closest to zero it has ever been.
How often does one get the opportunity to enter a sector at generational
Value investors should love this sector.
- fundamentally undervalued. basing at all-time lows
- Gold achieved 6-year highs in the dollar this year and all-time highs in all other currencies.
- Tremendous amounts of malinvestment and toxic debt.
- Central banks openly expressing they will provide all the liquidity the market needs. Increasing acceptance of negative interest rates, including in the US Federal Reserve. No signs in sight of money printing slowing, precisely the opposite.

Metals Correction is Almost Over. Onto Higher Targets for SilverGold broke out of a 6-year base this year, leading the other metals and commodities. 6-year base breakouts don't just end in 1-month surges. We have higher gold targets following this correction. $1711 and $1834 gold targets in the next 3-5 months.
To us, this correction is an accumulation opportunity. When silver rallies to $25, silver miners will have a ton of ground to cover.
Some are speculating on a more significant decline in gold prices. We could certainly correct to the low $1400s but it will be a short-lived correction not a new bear trend.
Low 1400s is overly optimistic in my opinion. I don't think we'll see below 1434, but if we do, that's just another chance to buy more for cheaper.

JNUG, in accumulation Area.Hi,
JNUG in speculative accumulation area. The contraction that started in August is close to be finished, the accumulation area is showed in Green color.
Price touched the area and was rejected, seems it is creating a resistance in $53, this could be this end of contraction wave.
Confirmation is above $60
- Target 1 is at $103, this represents +90% of opportunity
- Stop bellow $44.5
- 3.7x Risk/Reward ratio

Barrick gold to start another leg higher?Barrick gold released earnings today, and after two months of very nice consolidation and bullish divergence in MACD, stock might finally be ready for another rally higher.
So good low risk long entry could be attempted from current levels


Gold and Silver Miner Buying Opportunity At Gold current prices, Spanish Mountain and many other junior miners are severely undervalued.
Merely a move back to previous highs would be significant.
In the event that we see a 1970's or early 2000's style gold rally in the coming decade, junior miners such as Spanish Mountain will perform incredibly. I continue to believe that the gold mining sector has enormous potential that is being overlooked.
I am anticipating more of a pullback in gold, which would coincide with a little more downside in SPAZF. Even if we don't see that pullback, I will continue to dollar-cost-average in SPAZF and other miners for long-term investment.
This is not trading or investing advice, merely educational research. DYODD

BUY GOLD - 1600 SHORT TERM - FRACTAL FIB ANALYSISHAVE A LOOK AT CHART FIB LEVELS. TIME TO BUY GOLD . i'LL SEE YOU AT 1600 USD / 1443 EUR. SEE CHART FOR MORE INFO. ZOOM OUT FOR FRACTAL EXAMPLE.
FX_IDC:XAUUSD FX_IDC:XAUUSD OANDA:XAUEUR FX_IDC:XAUEUR
AMEX:GDX AMEX:GDXJ NYSE:GOLD AMEX:NUGT AMEX:JNUG AMEX:GLD
PLEASE REFER TO MY DECEMBER 28,2018 POST FOR FURTHER VALIDATION.
ALWAYS TRADE AT YOUR OWN RISK.
SUPPORTING INFO FROM PAST CHART POSTINGS.

LONG GOLD WITH FLASHING BUY SIGNAL ON REGRESSION TRENDEXPECTING A SHARP MOVE UP IN SPOT GOLD OVER THE SHORT TERM. EXPECT THAT PRICE IS LIKELY TO RISE TO $1600 DOLLAR LEVEL. PLEASE FIND SUPPORTING CHARTS LINKED BELOW.
ALWAYS TRADE AT YOUR OWN RISK! AMEX:BTG NYSE:AUY NYSE:HL NYSE:GOLD NASDAQ:RGLD AMEX:GLD GDX AMEX:GDXJ AMEX:JNUG AMEX:NUGT

Hochschild Mining - Gold miners in demand amid uncertainty.Technical Analysis
Hochschild Mining was a higher yesterday against a backdrop of red in UK markets. The shares appear to have been in the process of bottoming out over the past few months and have now completed an inverse head and shoulders bottom. This is a powerful reversal pattern and suggest there will be more upside over the medium term.
Fundamentals
Hochschild Mining currently ranks above average in our fundamental model with exceptional scores on value and momentum metrics. The shares have significantly outperformed the market over the past 1 to 3 months and we expect this to continue.
Pros
The company recent produced its 2nd best production performance in its history.
RBC Capital Markets reiterated their ‘Outperform’ rating on the 5th July 2019 with a 260p price target.
Global markets are in decline which could prompt even more demand for safe haven assets like gold.
Cons
The overall market is very volatile. This could impact the performance of all assets in the short term.
Berenberg bank issued a sell rating on the 17th July 2019 with a 165p price target.
Recent market declines have been short lived, if this occurs again investors may seek risker assets.
Entry At Market (208p)
Stop: 192.40p
Target: 277p

GDX - Possible breakout downwardsGDX broke out of the recent range to the downside. Could be a potential sustained downtrend in the short term.
Entered half position in $DUST so far, however have stop loss tight and waiting for further confirmation of the breakout strength before entering remaining position.

Wesdome Gold MinesIn the precious metals mining industry a large part of equity prices reflect the price of gold and silver. But in this herd of mismanaged elephants and lottery tickets, there exists a few properly managed nuggets that are hidden in the piles of wasted ore.
Wesdome is one of those companies. When the gold market really takes off investors will eventually realize this (many already have), and as hot money rolls into mining companies, outfits like Wesdome can be easily overlooked against the larger cap majors. But eventually the smart money finds the well managed companies.
This is a long-term hold. Much like Kirkland Lake was a couple of years ago. Watch it shine with Gold and expect a healthy return in the medium term. (assuming banksters don't smash gold).

CDE - move to 4$ in playYesterday NYSE:CDE broke through bearish flag and is now targeting region at around 4$, based on the symmetry and current chart structure. There it should find strong support, for the move higher.
Potrential trade: Sell short @ 4.60-4.70 region
Target: 4-4.15
S top-loss: 4.90
Risk/reward: 2 to 1 or 3 to 1 based on the entries, which is reasonable.
