Gold Shines Bright - Strong Buy Zone XAUUSD Buy Setup – Gold is maintaining strong bullish momentum after holding the 3375 support level. Market sentiment remains positive, with buyers stepping in and pushing price higher. As long as price sustains above 3375, the path of least resistance remains to the upside.
The next bullish targets are set at 3425 and 3450, where we expect potential profit-taking. A break and close above 3425 could accelerate momentum toward 3450. Traders should monitor intraday pullbacks for fresh buying opportunities, keeping stop-losses below the support zone to protect capital.
Goldprediction

xauusd (GOLD): a signal Hi guys!
Key Technical Points:
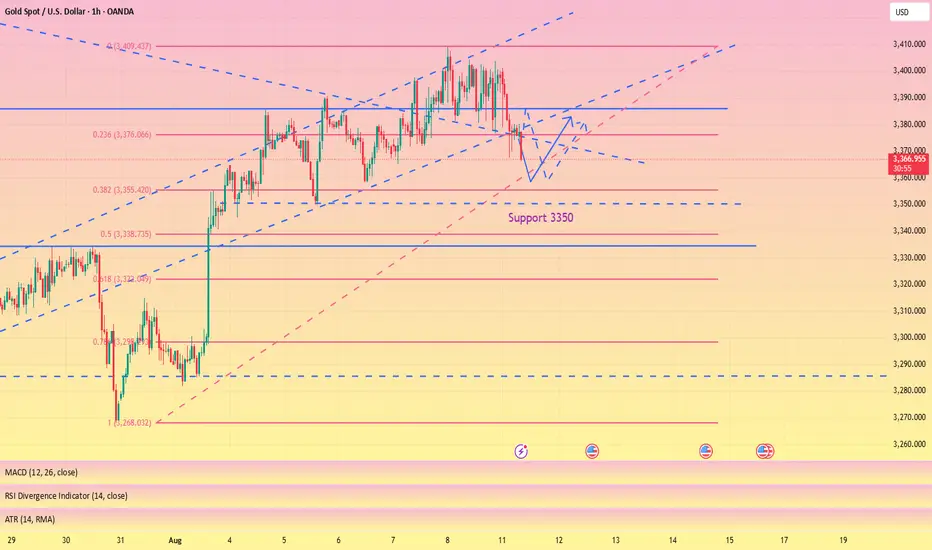
Ascending Channel:
Price action has been moving within a well-defined ascending channel.
Currently, the price has pulled back and is approaching the lower boundary of this channel.
This lower boundary often acts as a support area where buyers might step in.
Support Zone (Red Box):
The red highlighted area, around $ 3,340-$ 3,350 USD, is a key support zone.
This zone aligns w ith the lower boundary of the channel , adding more weight to the support.
Price is currently testing this area, which could act as a springboard for the next upward move.
Resistance Zone (Blue Box):
The upper resistance zone between roughly 3,425 and 3,440 USD is a major target for bulls.
This is a previous high area where sellers might re-enter the market.
-------------------------------------------------------
Trade Idea:
Long Position:
Entry could be considered near the lower boundary of the channel and the red support zone (around 3,340-3,350 USD).
Stop loss placement: Just below the red support zone to limit downside risk.
Target: The upper resistance zone at around 3,425-3,440 USD.

Gold (xauusd): still bullishHello guys!
Price is moving inside an ascending channel.
Recently bounced from mid-channel support (“last kiss”) and heading toward channel resistance.
Potential upside target: $3,435 zone.
As long as the price stays above mid-line support, bullish momentum remains intact.

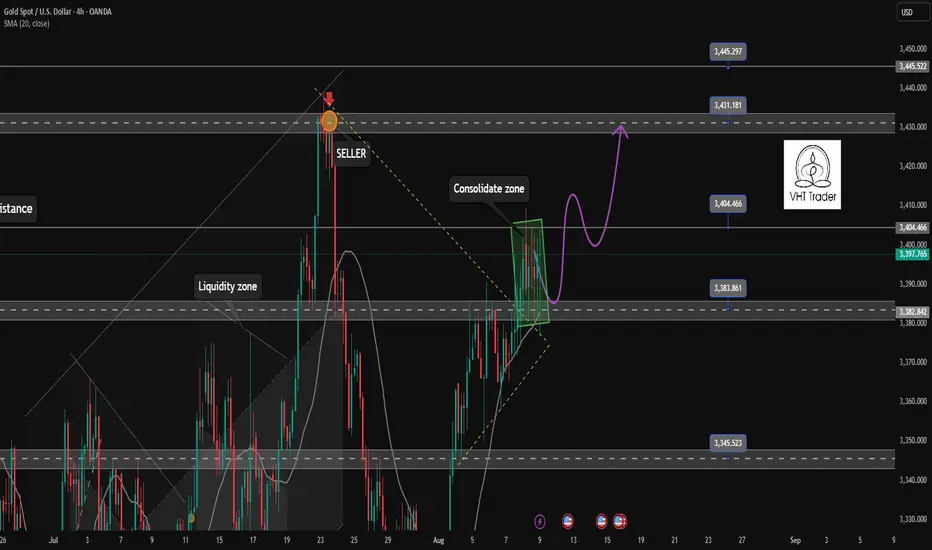
Waiting for new confirmation after 6th day of accumulation✏️Last weekend with a trading day in the accumulation range. Early this week waiting for new momentum to break the accumulation range from 3385 and 3405 to trade on the winning side. When breaking the lower range, a corrective wave will be formed and then create increasing waves to ATH. If breaking the upper range of the accumulation model, buying force can completely push the gold price to approach ATH around 3445 soon.
📉 Key Levels
Support: 3383-3345
Resistance: 3404-3431-3445
BUY Trigger: Price rejection of the candle around support 3383
BUY Trigger: Break resistance 3405
Target 3445
SELL trigger Break and trading bellow 3383
Target 3345
Leave your comments on the idea. I am happy to read your views.
GOLD ROUTE MAP UPDATEHey Everyone,
Once again our chart idea is playing out in true level to level fashion.
We started with our bearish gap hit at 3377, followed with ema5 cross and lock opening 3354, which was also hit perfectly.
We are now seeing price play in the retracement range with 3329 also open for test. We expect reaction on this retracement zone, also keeping in mind the Bullish gap above, inline with our plans to buy dips.
We will keep the above in mind when taking buys from dips. Our updated levels and weighted levels will allow us to track the movement down and then catch bounces up.
We will continue to buy dips using our support levels taking 20 to 40 pips. As stated before each of our level structures give 20 to 40 pip bounces, which is enough for a nice entry and exit. If you back test the levels we shared every week for the past 24 months, you can see how effectively they were used to trade with or against short/mid term swings and trends.
The swing range give bigger bounces then our weighted levels that's the difference between weighted levels and swing ranges.
BULLISH TARGET
3403
EMA5 CROSS AND LOCK ABOVE 3403 WILL OPEN THE FOLLOWING BULLISH TARGETS
3422
EMA5 CROSS AND LOCK ABOVE 3422 WILL OPEN THE FOLLOWING BULLISH TARGET
3439
BEARISH TARGETS
3377 - DONE
EMA5 CROSS AND LOCK BELOW 3377 WILL OPEN THE FOLLOWING BEARISH TARGET
3354 - DONE
EMA5 CROSS AND LOCK BELOW 3354 WILL OPEN THE FOLLOWING BEARISH TARGET
3329
EMA5 CROSS AND LOCK BELOW 3329 WILL OPEN THE SWING RANGE
3304
3281
As always, we will keep you all updated with regular updates throughout the week and how we manage the active ideas and setups. Thank you all for your likes, comments and follows, we really appreciate it!
Mr Gold
GoldViewFX

GOLD 1H CHART ROUTE MAP UPDATE & TRADING PLAN FOR THE WEEKHey Everyone,
Please see our updated 1h chart levels and targets for the coming week.
We are seeing price play between two weighted levels with a gap above at 3403 and a gap below at 3377. We will need to see ema5 cross and lock on either weighted level to determine the next range.
We will see levels tested side by side until one of the weighted levels break and lock to confirm direction for the next range.
We will keep the above in mind when taking buys from dips. Our updated levels and weighted levels will allow us to track the movement down and then catch bounces up.
We will continue to buy dips using our support levels taking 20 to 40 pips. As stated before each of our level structures give 20 to 40 pip bounces, which is enough for a nice entry and exit. If you back test the levels we shared every week for the past 24 months, you can see how effectively they were used to trade with or against short/mid term swings and trends.
The swing range give bigger bounces then our weighted levels that's the difference between weighted levels and swing ranges.
BULLISH TARGET
3403
EMA5 CROSS AND LOCK ABOVE 3403 WILL OPEN THE FOLLOWING BULLISH TARGETS
3422
EMA5 CROSS AND LOCK ABOVE 3422 WILL OPEN THE FOLLOWING BULLISH TARGET
3439
BEARISH TARGETS
3377
EMA5 CROSS AND LOCK BELOW 3377 WILL OPEN THE FOLLOWING BEARISH TARGET
3354
EMA5 CROSS AND LOCK BELOW 3354 WILL OPEN THE FOLLOWING BEARISH TARGET
3329
EMA5 CROSS AND LOCK BELOW 3329 WILL OPEN THE SWING RANGE
3304
3281
As always, we will keep you all updated with regular updates throughout the week and how we manage the active ideas and setups. Thank you all for your likes, comments and follows, we really appreciate it!
Mr Gold
GoldViewFX

GOLD WEEKLY CHART MID/LONG TERM ROUTE MAPHey Everyone,
Weekly Chart Update = Gap Completed, Levels Playing Out Perfectly
Just a quick follow up on the ongoing weekly structure, the precision in level respect continues to be impressive, with price action unfolding exactly as we’ve been mapping.
After the previous bounce from 3281, price moved cleanly back up and completed the gap at 3387 last week, exactly as projected in last weeks post. This time, we now have a candle body close above 3387, which changes the dynamic and leaves 3482 open as a long term upside target. An EMA5 lock from here would further confirm the breakout potential.
Updated Structural Notes:
🔹 3281 Support Holds Again
Textbook reaction. Once again, 3281 provided the perfect launch point, reinforcing its strength as a key weekly pivot.
🔹 Gap at 3387 Completed
Price didn’t just revisit 3387, it closed above it on the weekly candle body. This shifts the bias toward potential breakout continuation rather than another immediate rejection.
🔹 3482 Now on the Radar
With 3387 cleared on a closing basis, the next major upside objective becomes 3482, aligning with the broader channel structure and unfilled weekly target. EMA5 confirmation on the long side could accelerate this move.
Updated Levels to Watch:
📉 Support – 3281
Key long-term pivot and buy zone. As long as this holds, dips remain constructive.
📈 Resistance Turned Support – 3387
Now potentially acting as a base. Watching retests here for hold confirmation.
📈 Upside Target – 3482
Primary long-term resistance now in focus if 3387 support holds and momentum sustains.
Plan:
The breakout above 3387 opens a new chapter for this range. We now watch for confirmation that 3387 has flipped to support. Holding here keeps 3482 firmly in play, while any decisive break back below could send us rotating toward 3281 again. Structure still leads, but bias shifts bullish with this weekly close.
Thanks as always for your continued support.
Mr Gold
GoldViewFX

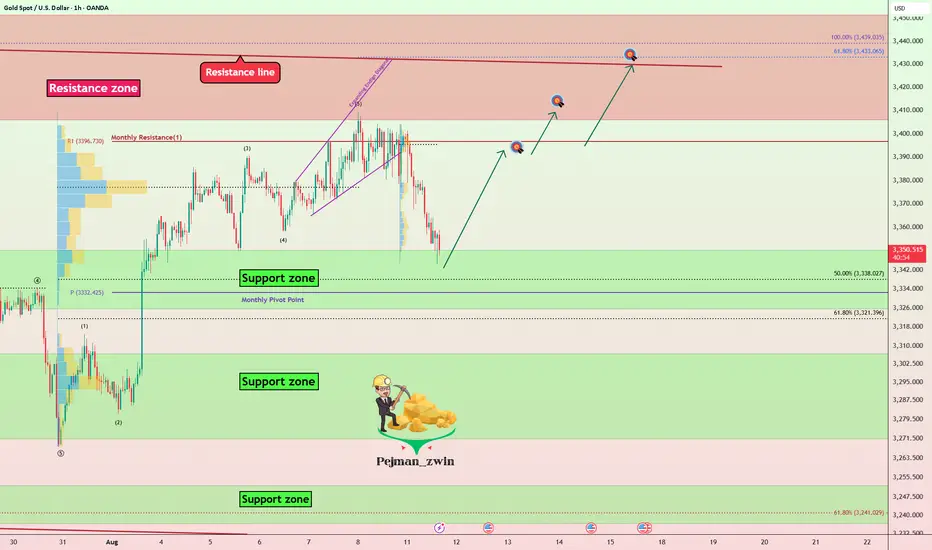
Gold Correction Ending — Time for the Next Rally?Gold ( OANDA:XAUUSD ) is currently moving near the Support zone($3,350-$3,326) and the Monthly Pivot Point .
In terms of Elliott Wave theory , it seems that Gold is completing a corrective wave, and we should wait for the next impulse wave .
I expect Gold to start rising from the Support zone($3,350-$3,326) and rise to at least $3,393 .
Second Target: $3,407
Third Target: $3,427
Note: Stop Loss (SL) = $3,317
Gold Analyze (XAUUSD), 1-hour time frame.
Be sure to follow the updated ideas.
Do not forget to put a Stop loss for your positions (For every position you want to open).
Please follow your strategy; this is just my idea, and I will gladly see your ideas in this post.
Please do not forget the ✅ ' like ' ✅ button 🙏😊 & Share it with your friends; thanks, and Trade safe.
XAUUSD swing readyH1-H4 TIMEFRAME SETUP
Currently XAUUSD is following the implusive down Trend as we mentioned once 3370 breaks 3345 is on mark I expecting market will renounce from 3335-3342 zone.
What possible scenarios we have ?
• Market has to gives closing of H4 above 3335-3340 for the implusive bounce for HH on D1 & H4 candles ,also I'm ready for buying at & my Targets are 3358 then 3370
• secondly If gold breaks to 3332-3330 and candle closes below then our buying will be invalid and market will retest 3310
#XAUUSD

Minor dip to 3330~3320, then skyrocketing to the Moon!Hello Traders,
The first wave of the uptrend is complete.
The second wave will dip to 3330~3320, followed by the third wave uptrend. Check the reference signal for take-profit levels.
Upcoming Macro Events :
- U.S. CPI (August 12): The main catalyst for volatility, likely to impact USD and real yields. A higher-than-expected CPI could strengthen gold, while a soft print might pressure the bull case.
- RBA Rate Decision (August 12): A dovish outcome could weaken the USD, indirectly supporting gold.
- Global Data (GDP, PPI): China’s economic data and UK GDP could influence risk sentiment and USD strength.
Gold is in a critical phase with bullish technical setup and positive sentiment, but volatility is expected due to key macro events. Traders should focus on support levels, monitor the CPI data, and remain cautious of bearish reversals if the consolidation fails.

Price broke below lower trendline. Price finally broke below lower trendline thus signaling more downsides for this week . It should be notedworthy that 3340s is our next target then 3280s support zones . A break below 3280s - 3270s brings us down to 3180s . Signal service available . Its free , PM for more details .

GOLD 4H CHART ROUTE MAP UPDATE & TRADING PLAN FOR THE WEEKHey Everyone,
Please see our updated 4h chart levels and targets for the coming week.
We are seeing price play between two weighted levels with a gap above at 3424 and a gap below at 3371. We will need to see ema5 cross and lock on either weighted level to determine the next range.
We will see levels tested side by side until one of the weighted levels break and lock to confirm direction for the next range.
We will keep the above in mind when taking buys from dips. Our updated levels and weighted levels will allow us to track the movement down and then catch bounces up.
We will continue to buy dips using our support levels taking 20 to 40 pips. As stated before each of our level structures give 20 to 40 pip bounces, which is enough for a nice entry and exit. If you back test the levels we shared every week for the past 24 months, you can see how effectively they were used to trade with or against short/mid term swings and trends.
The swing range give bigger bounces then our weighted levels that's the difference between weighted levels and swing ranges.
BULLISH TARGET
3424
EMA5 CROSS AND LOCK ABOVE 3424 WILL OPEN THE FOLLOWING BULLISH TARGETS
3499
EMA5 CROSS AND LOCK ABOVE 3499 WILL OPEN THE FOLLOWING BULLISH TARGET
3561
BEARISH TARGETS
3371
EMA5 CROSS AND LOCK BELOW 3371 WILL OPEN THE FOLLOWING BEARISH TARGET
3293
EMA5 CROSS AND LOCK BELOW 3293 WILL OPEN THE SWING RANGE
3236
3171
EMA5 CROSS AND LOCK BELOW 3171 WILL OPEN THE SECONDARY SWING RANGE
3089
3001
As always, we will keep you all updated with regular updates throughout the week and how we manage the active ideas and setups. Thank you all for your likes, comments and follows, we really appreciate it!
Mr Gold
GoldViewFX

GOLD DAILY CHART ROUTE MAPHey Everyone,
Daily Chart Update
Another Clean Rejection: Structure Still Dominates
Following up on the recent price action last week, the 3372 support level continued to provide support aligned perfectly with the channel half-line, giving us the bounce that continued all the way up to 3409, just short of the 3433 resistance, which once again remains open for a potential test.
We remain in the same structured range, with price still rotating between 3272 and 3433, a 170+ pip zone that continues to deliver high-probability trade setups.
Here’s where we are now:
🔹 Range Still Active
Price is respecting the 3272–3433 boundaries with precision. Until we get a decisive break and hold outside this range, range bound strategies remain in play.
🔹 No Breakout = Clean Rejection
The failure to sustain above 3433 confirms resistance is still valid. We're watching EMA5 for potential breakout confirmation, until then, the bias stays neutral within the range.
🔹 Channel Half-line Bounce
That rejection into 3272 also matched the channel half line, and the bounce there further cements this area as critical support. The latest rally to 3397 reinforces the strength of this pivot.
Updated Key Levels
📉 Support – 3272
Still the major pivot. Buy zones remain valid here unless we see a confirmed breakdown.
📈 Resistance – 3433
Now clearly tested and rejected more than once. Any clean break and hold above could change the dynamic, but until then, it’s solid resistance with 3397 as support.
Thanks as always for your support.
Mr Gold
GoldViewFX

Bearish trend dominates, gold awaits direction decisionGold's 1-hour moving average has begun to turn around from a high point. For gold bulls, this may mean that if they want to reverse their decline in the short term, they may need major news to stimulate the market. Otherwise, in the short term, gold bulls may find it difficult to make any significant progress. Gold's 1-hour moving average has fallen at this rate, and there has been basically no major rebound. This rebound also provides a second opportunity for shorting. The key level of gold is still in the 3365-3380 area. If the US market is under pressure at the 3365-3380 area, then gold will continue to be shorted on highs. The market is changing rapidly. We never become rigid longs or shorts. Trading is about following the wind. We go where the wind blows, otherwise we will eventually fail against the wind. Gold bears are now clearly becoming stronger, so we should continue to ride on the tailwind of the gold bears.

How to correctly grasp the gold trading opportunities?At present, the suppression of 3410 is still quite strong. After testing the resistance, a short-term long-short reversal was formed, and it retreated and broke the 3380 low support. It is expected to test the 3360 and 3345 moving average supports below today. After falling below the 3380 bullish starting point, the short-term trend will temporarily be mainly downward. Only when it is close to the low support can a new layout be made. Therefore, wait patiently for the low point to be retreated and stabilized before considering going long on gold.

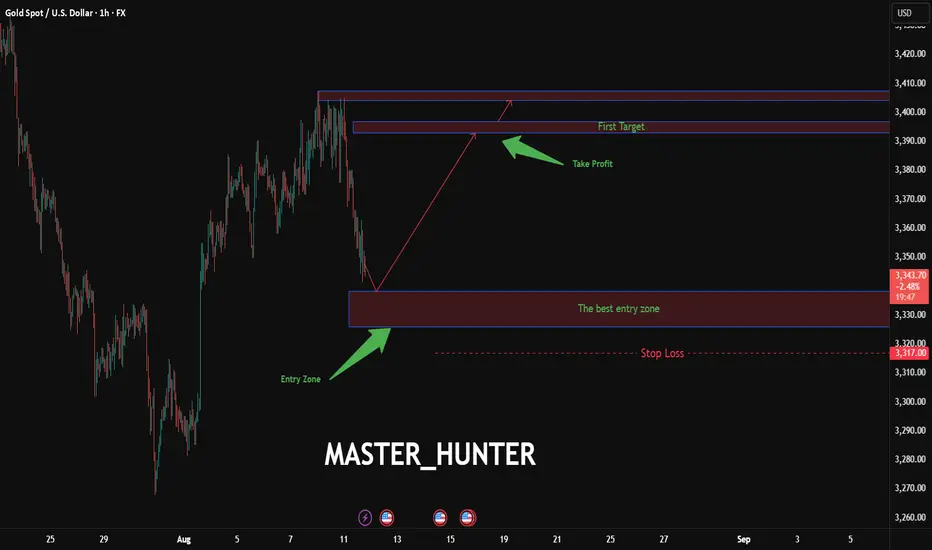
XAU/USD: Gold Rocket to 3407 Unleashed?FX:XAUUSD is primed for a explosive breakout on the 1-hou r chart, with an entry zone at 3326-3338 near a bullish pivot.
First target at 3393 , with a second target at 3407 smashing through resistance.
Set a tight stop at 3317 to lock in risk. A surge past 3340 with volume could ignite this gold rocket. Watch USD weakness and global risk appetite. Get ready to soar!
I will gladly see your comments
#XAUUSD #GoldTrading #ForexSignals #TechnicalAnalysis #TradingView #DayTrading #MarketAnalysis
London Gold Early Trading StrategyGold prices saw a slight rise early in the session before retreating due to a brief easing of safe-haven demand. Gold prices have resumed a broad range-bound pattern, with recent price action showing both up and down swings but lacking strong follow-through support. For now, it's best to avoid chasing the rally. As gold prices retreat to support, we recommend initiating a new position. The current price is 3,374 – enter now!
On the hourly chart, gold prices remain in a broad consolidation range. Key support at 3,365 (the previous low) remains holding, and the short-term trend remains tilted to the upside. After a sharp drop to 3,367 this morning, the rebound was strong, confirming solid support near 3,365. Therefore, we continue to buy on dips.
Markets move fast—keep an eye on resistance at 3,410. The big question is whether this consolidation is forming a top or just building momentum for another push higher. If gold keeps failing at 3,410, bears might finally step in. Either way, patience is key—don’t rush into trades just because it’s moving up or down.

Gold Breaks Rising Wedge – Bearish Targets AheadGold recently broke down from a rising wedge pattern near the $3,385–$3,390 area, signaling potential bearish momentum. Price is currently trading around $3,360, staying below the broken wedge support and also below the main trendline. This breakdown aligns with a shift from short-term bullish to corrective/bearish movement. The trend has shifted bearish unless it reclaims $3,375–$3,388. Short-term bias favors more downside toward $3,350 and $3,342
Key Levels to Watch
- Immediate Resistance: $3,370 – $3,375 (wedge breakdown retest zone)
- Major Resistance: $3,388 – $3,395 (trendline and previous supply zone)
- Immediate Support: $3,350 – $3,352 (short-term Fib and horizontal support)
- Major Support: $3,335 – $3,340 (next demand area)
- Extended Downside Target: $3,322 (Fib 0.22 level)
Note
Please risk management in trading is a Key so use your money accordingly. If you like the idea then please like and boost. Thank you and Good Luck!

Huang cannot break through 3400, and the bearish trend begins
💡Message Strategy
The gold market has been volatile recently, with price fluctuations weighing on the nerves of global investors. Gold prices saw a significant decline on Monday (August 11th), with market attention focused on the US-Russia talks regarding the Ukraine conflict and the upcoming release of US Consumer Price Index (CPI) data.
These two major events not only have implications for the direction of geopolitical developments but may also provide important clues to the Federal Reserve's interest rate policy, thereby influencing the future trend of gold prices.
📊Technical aspects
Gold bulls rebounded under pressure, retreating to the 3400 level before ultimately breaking down. Gold bulls have lost their initiative, the rebound is weak, and the price continues to fall, breaking new lows. Gold has now reached scenario 2, which we discussed yesterday, at 3350, and is poised for further declines.
Gold's 1-hour high trading volume zone finally broke below, breaking the oscillation pattern. This means the high-level box has formed a short-term top structure, and the resistance at the high level has become very heavy.
At this point, it's no longer advisable to blindly chase gold prices; a bearish outlook on a pullback is the prevailing trend.
💰Strategy Package
Short Position:3360-3365,SL:3380,Target: 3330

Analysis for the next weekHello Trader,
I hope you are doing well and you enjoyed your weekend.
As you know the market is running in uptrend, it’s creating break of structure (BOS) again and again. The market can fall a bit and then it will continue the uptrend.
It can make another All Time High (ATH) next week. Avoid to take much risk. Follow the trend.
The market is going to open tonight, Get ready your accounts for the next week. Best wishes for all of you guys.

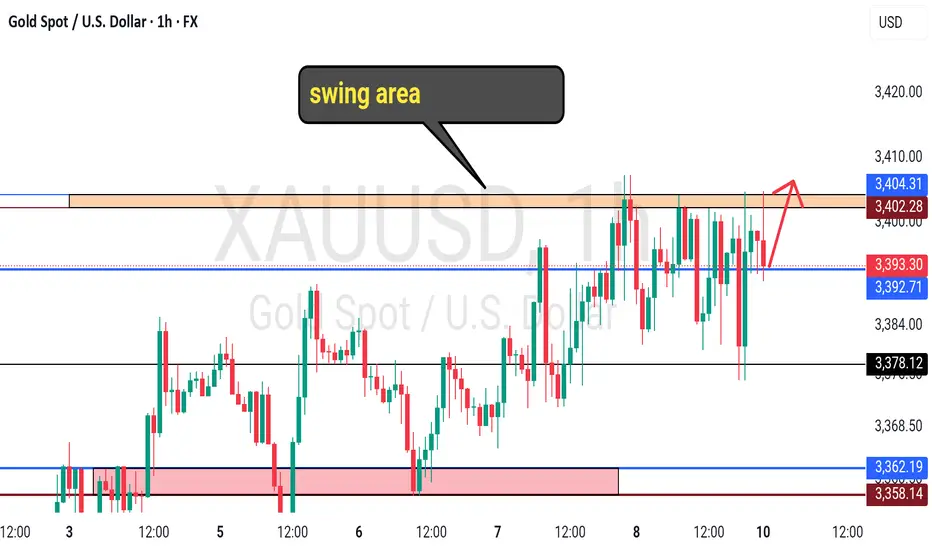
GOLD - at support ? What's next??#GOLD... Perfect move as per our video analysis and now market just at his current immediate supporting level.
That is 3392-93
Keep close and if market hold it in that case we can expect bounce otherwise not..
NOTE: we will go for cut n reverse below 3392-93 on confirmation.
Good luck
Trade wisely
The daily trend has not changed, go long on pullback#XAUUSD
Good morning, and a wonderful day. Last night we expected that if the 3390-3380 level below is effective, then gold will still have room to rise. After the morning opening, gold began to fall and adjust, reaching a low of around 3367, and the overall trend fell into a wide range of fluctuations. From a technical perspective, the daily moving average tends to converge upward, with the middle track located near 3357. Before it effectively falls below, the daily bullish trend remains unchanged. Paying attention to the 4H technical indicators, we find that the MACD indicator death cross with large volume tends to fluctuate and fall. In the short term, we should focus on 3380-3390 above. At present, we should focus on the support at 3350. If it fails to break through effectively, gold will rebound again. On the whole, it is recommended to go long when the price retreats to around 3360-3350 during the day, with the target at 3375-3385.
🚀 BUY 3360-3350
🚀 TP 3375-3385
A ceasefire between Russia and Ukraine? A shift in gold's trend?Information Summary:
US President Trump stated that he would meet with Russian President Vladimir Putin in Alaska on August 15th to discuss ending the Russia-Ukraine conflict. However, Trump added that any peace agreement would involve the controversial prospect of a "lord swap." Following this news over the weekend, gold prices plummeted from around $3,400 to $3,367 in early Asian trading.
Market Analysis:
A small pullback occurred in early Asian trading, confirming last Friday's support at $3,370. The market has been fluctuating between $3,370 and $3,400, with both bulls and bears fluctuating. This volatility doesn't discriminate between bulls and bears; it all depends on the entry point. A good entry point offers profit opportunities for both bulls and bears.
Currently, the 1-hour chart shows gold fluctuating at high levels. Although it challenged above $3,400 last week, it hasn't held steady. Furthermore, it retreated during Monday's Asian session. At this point, caution is advised when bullish. The early Asian session decline isn't a concern; the continued decline during the European session is. Quaid recommends choosing a trading opportunity at the US market open.
Gold's current trend remains downward in the short term. A series of resistance levels have formed around 3,400, making a rebound unlikely on Monday. Focus on support at 3,360. If this level breaks, gold could continue its downward trend towards 3,330.
Trading Strategy:
Short around 3,400, stop loss at 3,410, profit range 3,380-3,365
Long around 3,360, stop loss at 3,350, profit range 3,380-3,400
