Gold XAUUSD Sell in trendline completion stageGold XAUUSD Sell in trendline completion stage - short term trade. now in 4th touch. bounce back to test previous level testing and return back to support again and it will break to test the sellers.
Goldprediction

Gold fell below support. What will be the subsequent trend?The 1-hour moving average of gold continues to show a downward short position, indicating that the downward momentum is still sufficient; the wave pattern of gold's current decline remains intact, but the rebound strength is very weak, showing an obvious short trend of gold. Moreover, when gold rebounded in the short term, obvious resistance began to form above 3320, and the upward momentum was slightly insufficient.
From the daily chart, before 3300 fails to fall, it is likely to fluctuate around 3300-3350. On the contrary, if it falls below 3300, it is likely to reach the bottom of the 3385-3375 range.
This week is a super data week. The data of each day may affect the trend of gold on that day, but it will not form a unilateral strong trend. Therefore, the volatility before and after the data is released is likely to be large, so traders should focus on the following data:
1. US ADP employment report, US second quarter GDP preliminary value;
2. Federal Reserve interest rate decision;
3. US PCE annual rate, monthly rate;
4. The last trading day of this week will usher in non-agricultural data.
GOLD Continuation and ReversalIt still needs one more fall
Sell from 3348 to 3312
Buy from 3312 to 3392
GG
How to plan for the evening, pay attention to the 3300 markAfter the shorts took profits, gold consolidated in the 3310-3300 area. Judging from the daily chart, the decline in gold seems to have just begun, with the middle track of the Bollinger Band at around 3345 and the lower track at 3285. The possibility of falling below the 3300 mark cannot be ruled out in the evening. If gold falls below the 3300 mark, it may first hit 3295. If the decline continues, it may even hit the low of 3285-3275 below. However, if the 3300 mark can be effectively defended, then the possibility of maintaining the consolidation of 3300-3345 in the evening may be maintained. Therefore, it is not recommended to easily participate in transactions at the current position in the evening. It is mainly advisable to wait and see and pay attention to the breakthrough of the 3300 mark.
My premium privileges are about to expire, and subsequent trading strategies and analysis will be published in the group.
Secured The Dump on GOLDIn this video, I quickly go through how I managed to secure the dump on GOLD during the New York Session. It's not easy but it's simple.

Monday market forecast and analysis ideas#XAUUSD
There will be a lot of data next week, such as the 8.1 tariff deadline that I have repeatedly emphasized, the Federal Reserve decision, NFP data, etc. It can be said that it is relatively difficult to analyze purely from a technical perspective, because there is uncertainty in many data, the data results are often non-linearly correlated with market reactions (good news does not necessarily lead to a rise, and bad news does not necessarily lead to a fall), and large fluctuations can easily form oscillating K-lines with long upper and lower shadows. Therefore, the first arrangement for next week is to participate in trading with a light position and avoid letting emotions control your thinking.
The closing price on Friday was near 3337, proving that the short-term judgment on the rebound momentum of gold is correct, so there are two possible situations on Monday.
1. The first thing we need to pay attention to is 3345-3350 to determine whether it constitutes a short-term pressure level. The weekly line closed with a negative cross star. Combined with the monthly line trend, in terms of support, focus on the trend line support near this week's low of 3325. If this position is not broken, the market is expected to usher in a wave of rebound; if it falls below 3325, the bottom may look to 3310 or even 3295 for support.
2. The rebound momentum of Friday continued on Monday, breaking through 3350 first, and then it is possible to reach the previous high resistance area of 3370-3380. If it encounters resistance here, gold will continue to fall and fluctuate, and the target may even be 3310. If the price remains strong and issues such as interest rate cuts and tariffs are imminent, it means that the short-term downward trend has ended and may even set a new high.
The above content is only a forecast for Monday’s market. It will be greatly affected by data and news, and may be adjusted in real time next week based on intraday trends. You can refer to this, but remember not to be swayed by emotions. We will participate with a light position, and the specific trading strategy can wait for my trading signal.

Gold Recovery Setup = Divergence + Support ClusterGold ( OANDA:XAUUSD ) fell to the lower line of the ascending channel and the Support zone($3,350-$3,326) , as I expected in my previous idea .
Gold is currently near a set of Supports .
Supports:
Support zone: $3,350-$3,326
Monthly Pivot Point: $3,333
Potential Reversal Zone(PRZ): $3,339-$3,329
Lower line of the ascending Channel
50_EMA(Daily)
Support lines
In terms of Elliott Wave theory , Gold appears to be completing a bearish wave 5 .
Also, we can see the Regular Divergence(RD+) between Consecutive Valleys .
I expect Gold to rise to at least $3,359 .
Second target: $3,367
Note: Stop Loss (SL) = $3,319
Do you think Gold can break the Support cluster by the end of trading hours?
Gold Analyze (XAUUSD), 1-hour time frame.
Be sure to follow the updated ideas.
Do not forget to put a Stop loss for your positions (For every position you want to open).
Please follow your strategy; this is just my idea, and I will gladly see your ideas in this post.
Please do not forget the ✅ ' like ' ✅ button 🙏😊 & Share it with your friends; thanks, and Trade safe.

Gold (XAUUSD) - Liquidity Sweep Setup and Long Bias PlanPrice is currently respecting my projected structure and moving in line with expectations. I'm anticipating a deeper liquidity sweep into the marked demand zones below, where multiple liquidity pools are likely to be taken out. These areas have historically provided strong reactions.
🟦 Key Zones:
Three stacked liquidity sweep levels are highlighted, where previous lows and stop clusters are expected to be swept.
Watch closely for bullish reaction after liquidity grab in these zones.
🟢 Plan:
Looking for potential Entry Long after confirmation from the sweep and market structure shift.
Expecting price to accumulate, fake out with a final sweep (as sketched), and then launch upwards.
If the sweep completes and the structure confirms, targeting a strong bullish continuation move.
📈 Context:
Higher timeframe bullish structure still intact.
Setup aligns with ICT Smart Money Concepts – targeting liquidity and institutional order flow behavior.
💡 This idea will be updated as the setup develops. Trade safe and wait for confirmation.

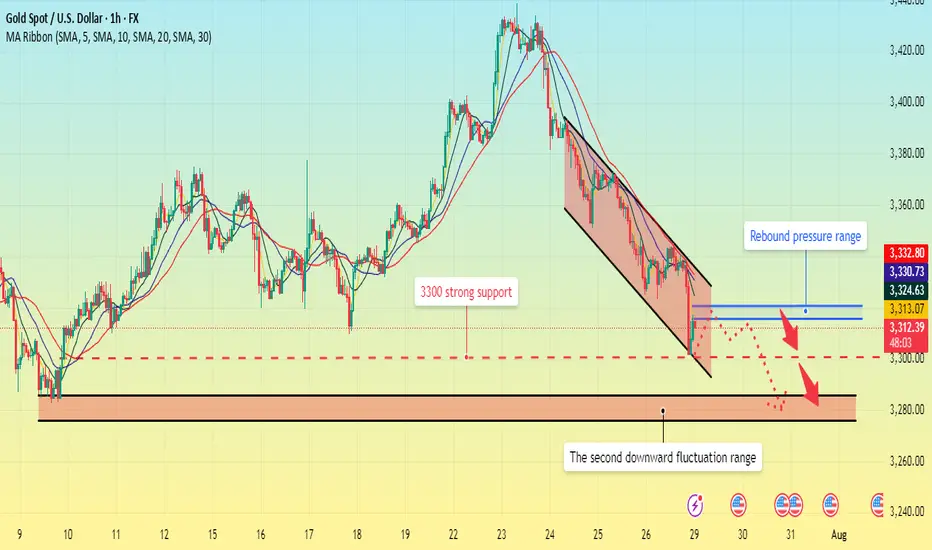
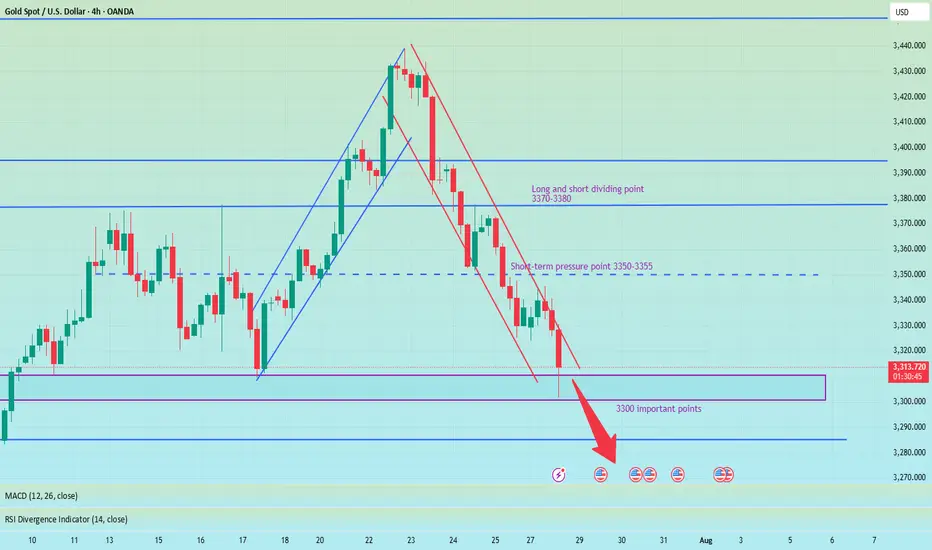
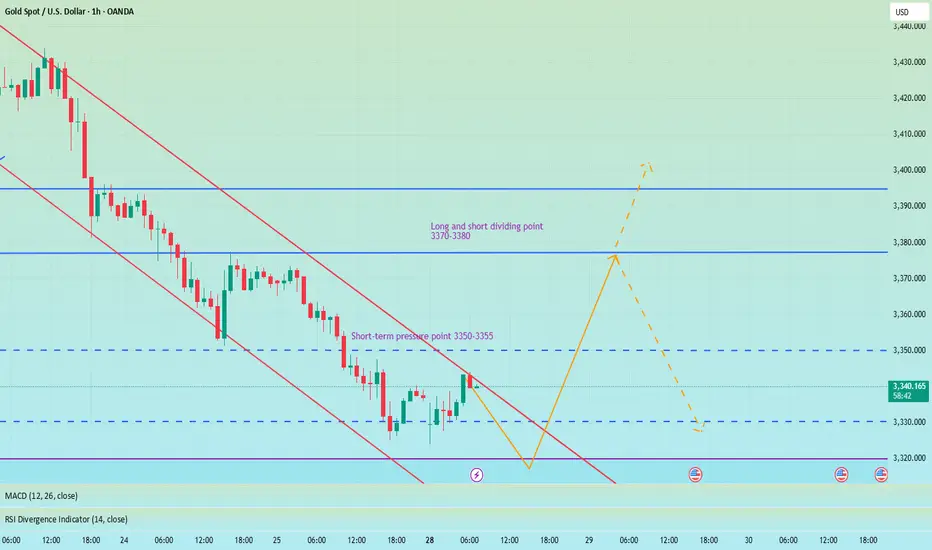
Pay attention to 3350 gains and lossesGood morning, bros. This morning gold again tested last week's low near 3325. From the chart, gold may continue to rise this week, with tariffs approaching, the Fed's interest rate cut, and NFP data imminent. The current strength and weakness are at 3350-3355. If it can effectively break through and stand above, it is expected to continue to test the previous high point, which is also the long-short dividing point of 3370-3380.
From the daily chart, there is not much change in the operational range of gold in the short term, and the change in the 4H chart is more obvious. After the decline in the early trading, it is now rebounding. There is a possibility of closing positive at the low. If it is directly positive on Monday, then it will bottom out directly at the beginning of the week. If it refreshes the low on Monday, the low point of 3285 will be seen below. Therefore, today's market focuses on the continuity of long and short. Of course, according to the current changes, the biggest possibility is to continue to rebound at the low point, pay attention to the support of 3310-3300 below, and pay attention to the gains and losses of the high point of 3355 above.
Excellent profits is closed 300 pips tp Hit I mentioned throughout Today's commentary session:
My strategy is still the same – sell from 3338-3340
Gold around my key level at 3345-3340, which the market respects well and as our first target was 3318 then 3305
Very happy with the profits so far.
My medium-term targets remain 3290 which is pending but 300 pips achieved alhumdullilah. I sold gold from every local high.
Also I mentioned 3340 turns retest and I opened my sell trades and 300 pips TP HIT PROFITS
All I say thanks to those who followed us and made profits.
The correction is quite surprise. What direction for GOLD price?✏️Quite surprised with the adjustment of gold at the end of the previous trading week. The rising price channel is still holding around the lower border of the price channel around 3316. A liquidity sweep and candle wick removal in this area is considered a good buying opportunity.
If h1 closes below this border, limit trading BUY signals until the bottom support of 3286. When the price can close the candle below 3316, gold will trade in a wide range and there is no main trend dominating the market.
📉 Key Levels
Support: 3316-3286
Resistance: 3372-3400-3418
Buy trigger: Reject and Trading above 3316
BUY DCA Break 3372
Target: 3400
SELL Trigger: Break bellow and Retest 3416
Leave your comments on the idea. I am happy to read your views.
Market forecasts are completely accurate, trading signals#XAUUSD
After opening today, gold tested the lowest point near 3324 and then rebounded, which is in line with my prediction of gold trend last night. Next, we need to pay attention to whether the upper 3345-3350 constitutes a short-term pressure level. If you are aggressive, you can consider shorting at 3345-3350, with the target at 3330-3325. Continue to hold if it falls below 3325, and stop loss if it breaks above 3350. After it breaks above, you can consider following up with a long order to close the position at 3360-3370. Short once at 3370-3380 for the first time, and stop loss if it breaks above 3380.
🚀 SELL 3345-3350
🚀 TP 3330-3325
🚀 BUY 3352-3355
🚀 TP 3360-3370
🚀 SELL 3370-3380
🚀 TP 3345-3325-3310
Be sure to study my trading strategy carefully. If you only look at the price points, you will definitely suffer certain losses. Participate in the transaction at the right time based on your own account funds and set stop losses.

XAUUSD on critical rangeGold is currently below rising channel also completion on Head& Shoulder on H4 time frame. DXY is recovering on weekly charts.
What's possible scanarios we have?
▪️today's not mych volume had been seen, still my stance are same H4 candle closed above 3345 ,I will be on bullish side till 3370-3380.
▪️Secondly H4 candle closing below 3330 this Parallel moves upside will be invalid and we have targets at 3310 then 3290 on mark.
XAU/USD 1H – Range Consolidation Below Ichimoku Cloud. Chart Review & Technical Insight
1. Ichimoku Cloud & Overall Structure
Price is below the Ichimoku Cloud, with the cloud ahead sloping downward—indicative of bearish short‑term momentum and resistance overhead as long as the cloud holds above price.
The Kijun-sen (blue) line is above the Tenkan-sen (red), reinforcing the bearish bias on this timeframe.
2. Price Action & Key Zones
A support zone around 3,327–3,330 USD/oz is visible, underpinned by multiple rejection taps and price consolidation (“$$$” zone). A clean break below could open the path toward the 3,320’s or lower imbalance region.
On the upside, resistance lies near 3,339–3,340, backed by the cloud’s lower boundary and the Kijun-sen level.
The highlighted green rectangle appears to signal a potential bullish breakout target zone toward 3,365–3,392, contingent on recovery above the cloud.
3. Momentum & Trade Considerations
Momentum is weak, with price moving sideways inside a low‑volatility rectangle on diminishing volume and few directional impulses.
Possible ABC corrective structure is forming as marked, suggesting price may oscillate sideways or continue correcting within established bounds.
A bullish scenario would require clearing the Ichimoku Cloud and resistance at 3,340–3,360 USD.
Conversely, a bearish breakdown below ~3,327 could confirm continuation deeper into the 3,320s or toward the next significant demand zone near 3,300 USD.
.
✅ Summary
Bias: Slightly bearish to neutral until price can clear the Ichimoku Cloud.
Key Levels to Watch:
Support: 3,327–3,330 (immediate), then 3,320–3,300.
Resistance: 3,339–3,365, cloud top near 3,365, further target zone 3,392.
Scenarios:
Bullish breakout: Close above cloud → potential rally toward 3,365–3,392.
Bearish breakdown: Close below 3,327 → deeper correction toward 3,320 and lower imbalance areas.

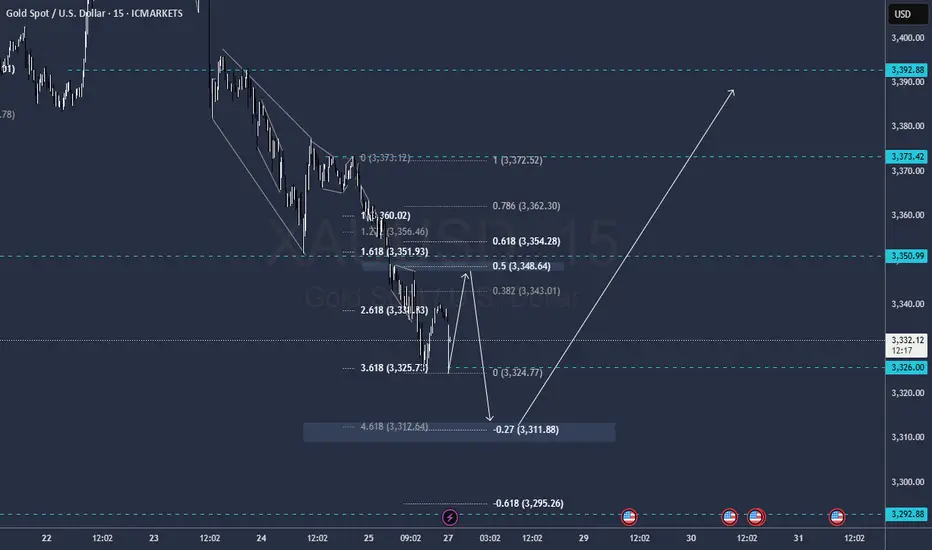
[XAUUSD] Gold Price Analysis July 28Symmetrical Channel Structure and High-Probability Trading Strategies
In today’s trading session (July 28), the XAUUSD 15-minute chart reveals a clear symmetrical channel pattern, indicating a technical correction after a previous strong uptrend.
1. Trend Structure
Phase 1 (July 18–23): Price moved within an ascending channel, forming higher highs and higher lows — a clear bullish structure.
Phase 2 (July 23–26): After peaking, price reversed into a descending channel, establishing a bearish sequence of lower highs and lower lows.
Currently, price is consolidating near the lower boundary of the descending channel, testing short-term support.
2. Key Support and Resistance Levels
Price Level
Technical Significance 3,360 – 3,365
Key resistance zone – top of descending channel 3,345
Dynamic resistance – EMA21 on M15 3,320 – 3,315
Crucial support zone – lower boundary of channel 3,300
Psychological support & prior swing low (July 10)
3. Price Action and Indicators
Volume has gradually decreased, signaling potential weakening of selling momentum.
RSI on M15 has rebounded from the oversold zone, currently moving above 40, suggesting a short-term technical bounce.
EMA21 & EMA50 are still sloping downward, confirming short-term bearish pressure.
4. Intraday Trade Scenarios
✅ Scenario 1: Rebound Play from Channel Support
Entry: 3,320 – 3,325 (after bullish confirmation candle)
Stop Loss: Below 3,312
Take Profit: 3,345 – 3,355 (resistance zone & mid-channel)
⚠️ Scenario 2: Trend-Following Short from Resistance
Entry: 3,345 – 3,350 (if price rejects at EMA21 or channel resistance)
Stop Loss: Above 3,360
Take Profit: 3,320 – 3,310
5. Strategy Outlook
XAUUSD remains in a corrective bearish phase after a strong rally. As long as the 3,312 level holds, there’s potential for a technical rebound during the London–New York session. However, sellers remain in control unless price breaks and closes above 3,360.
Follow for more real-time gold strategies. Save this post if you found it helpful!

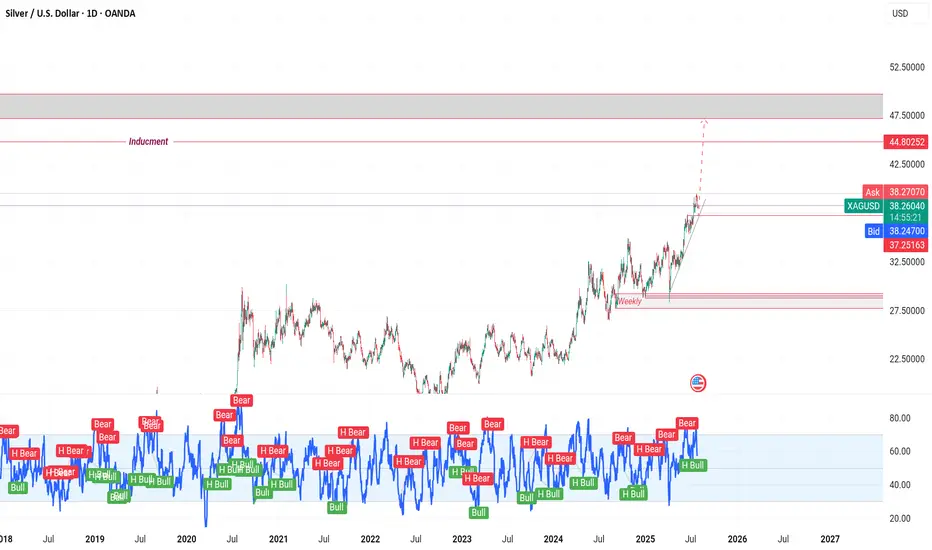
XAG/USD on high time frame
"Hello, for investors in XAG/USD, the $37 zone appears to be a low-risk area for buying. Both technical and fundamental analyses suggest that the price is likely to move higher towards $48."
If you require further insights or have additional information to discuss, feel free to share!
Gold-----sell near 3350, target 3320-3300Gold market analysis:
The gold weekly candlestick pattern is a tombstone. The previous strong trend has turned into a weak trend after the high and low. Has the weekly selling come out? In fact, the historical weekly line has hit the top and fallen back three times, and there has been no big drop or deep drop. The long-term trend is still buying. The short-term adjustment has not changed the long-term buying trend. The international situation is not very clear, and it is difficult for gold to fall deeply. We are just a short-term trader. We need to follow. This week's operation idea is to follow the selling, or rebound selling. In addition, this week is a super data week, and buying and selling games will be inevitable. This week there are non-agricultural employment data and the Federal Reserve's interest rate meeting resolution, each of which can make the market magnificent. The daily K has entered its bottom support. Selling near 3300 needs to be avoided. These positions are all buying counterattack positions. In the rebound of the Asian session, we first focus on the suppression near 3350. This position is the K-intensive area of the bears, the K-line pattern suppression, and the daily moving average suppression position. Consider selling when the multi-layer suppression is close. I estimate that it will enter the repair at the beginning of this week, and wait for the data to bring direction later. Those who like to swipe back and forth can also find a good rhythm to sell long-term and buy short-term.
Support 3320, strong support 3306-3300, pressure 3350 and 3357, the watershed of strength and weakness of the market is 3350.
Fundamental analysis:
The latest news is that the United States and the European Union have reached a 15% tariff agreement, which overall supports the US dollar and suppresses gold. In addition, this week, pay attention to ADP employment data, non-agricultural employment data, and the Federal Reserve's interest rate decision and speech.
Operational suggestions:
Gold-----sell near 3350, target 3320-3300

Analysis of technical prospects for gold prices!Market news:
In the early Asian session on Monday (July 28), spot gold bottomed out and rebounded. At the beginning of the session, it continued the decline of last Friday to around 3320. As the United States and Europe reached a trade agreement, the international demand for gold hedging further declined. However, the price of gold was supported by bargain hunting and quickly recovered most of the decline. It is currently trading around 3337 US dollars per ounce. As the global reserve currency, the trend of the US dollar is crucial to the price of gold. Last week, the US dollar index rebounded from a low of more than two weeks, significantly pushing up the cost of gold for overseas buyers. The progress of US-EU trade negotiations has become another major driver of the recent decline in London gold prices. Although the demand for hedging has been suppressed in the short term, geopolitical uncertainty still provides long-term support for gold. At the same time, the trend of global central banks buying gold provides a solid bottom support for gold.Looking ahead to this week, the economic calendar will provide several high-impact data releases. The Federal Reserve will announce its monetary policy decision after the policy meeting on July 29-30. On Friday, the US Bureau of Labor Statistics will release the July employment report. If the number of non-farm payrolls (NFP) increases by more than 100,000, it may indicate that the labor market is in good enough condition that the Fed can prioritize controlling inflation and supporting the dollar when making policies. If the new non-farm payrolls data reaches or falls below 70,000, the dollar may find it difficult to find demand before the end of next week and help gold gain bullish momentum.
Technical analysis:
Technically, the gold daily chart forms a continuous negative structure, and the New York closing price re-loses the key support of the MA10-day moving average at 3360 and the middle track of the Bollinger Band. The RSI indicator breaks through the middle axis and runs in a short-term ... Pay attention to the rebound repair after selling low opening at the beginning of the gold week. The main idea is to sell at a high price and buy at a low price as an auxiliary.
Today's analysis:
Gold rebounded after opening low in the Asian session. Gold continued to refresh the low point. Then gold was obviously still in a selling trend. Since gold is still in a selling trend, it will continue to sell to the end. Gold rebounded in the Asian session and continued to sell. Gold continued to sell under pressure in the Asian session. Gold waited patiently for 3350 to continue selling in the Asian session. Gold's 1-hour moving average continued to cross downward and arranged for selling. There was basically no obvious rebound in this round of gold's decline. Then gold was likely to continue the short selling trend after the rebound correction. The wave structure of gold's current decline remained intact. Gold continued to sell under pressure near the last low of 3350.
Operation ideas:
Buy short-term gold at 3309-3312, stop loss at 3300, target at 3340-3360;
Sell short-term gold at 3350-3353, stop loss at 3362, target at 3320-3300;
Key points:
First support level: 3320, second support level: 3306, third support level: 3292
First resistance level: 3346, second resistance level: 3358, third resistance level: 3467

The US and Europe reached an agreement. Gold rebounded.At the current node, the EU and the US reached a tariff cooperation, 15% tariff + 600 billion US dollars for investment in the United States. The additional tariffs are considered a big deal, and the US has become the winner again this time.
Of course, this is a small negative for the current gold market.
From a multi-period analysis, the monthly chart price is still in a reverse K state. For the current situation, we need to pay attention to the gains and losses of the monthly highs and lows. The weekly chart shows that the price has continued to fluctuate at a high level recently. As time goes by, the weekly watershed is temporarily at 3320. After last week's high and fall, there is currently a further downward performance.
The four-hour chart shows that the price has continued to be suppressed after breaking through the four-hour support last Wednesday. The four-hour level resistance is currently around 3355, and the resistance level has moved up compared with the early Asian market. Therefore, we will pay attention to the pressure at this position in the future. If it fails to break through for a long time, it is likely to fall directly under pressure; pay attention to the support range of 3320-3310 below.
Gold remains unchanged. Still weak.Last Friday, gold rebounded around 3373, but the bullish momentum was insufficient, and then it bottomed out and fell sharply. The price fell below the short-term rising trend line support. At present, the MA5-10 daily moving average is in a high dead cross short arrangement. On this basis, Quaid believes that gold can still be bearish now. At present, the Asian market continues to fluctuate downward in the early trading. Today, we will focus on the support of 3310-3300.
The short-term price is currently maintained at around 3335, which can be regarded as the watershed between long and short today. If the European session stabilizes above the MA50 moving average, the trend will change to a certain extent. Now we still look at the bottom near 3300.
Operation strategy:
Short near 3340, stop loss 3350, profit range 3310-3300.

XAU/USD(20250728) Today's AnalysisMarket news:
Trump announced that the US and Europe reached a trade agreement: 15% tariffs on the EU, $600 billion in investment in the US, zero tariffs on the US by EU countries, the EU will purchase US military equipment, and will purchase US energy products worth $750 billion. However, the US and Europe have different statements on whether the 15% tariff agreement covers medicines and steel and aluminum. Von der Leyen: The 15% tariff rate is the best result that the European Commission can achieve.
US Secretary of Commerce: The deadline for tariff increases on August 1 will not be extended. The United States will determine the tariff policy on chips within two weeks.
Technical analysis:
Today's buying and selling boundaries:
3345
Support and resistance levels:
3393
3375
3363
3326
3315
3297
Trading strategy:
If the price breaks through 3345, consider buying in, the first target price is 3363
If the price breaks through 3326, consider selling in, the first target price is 3315

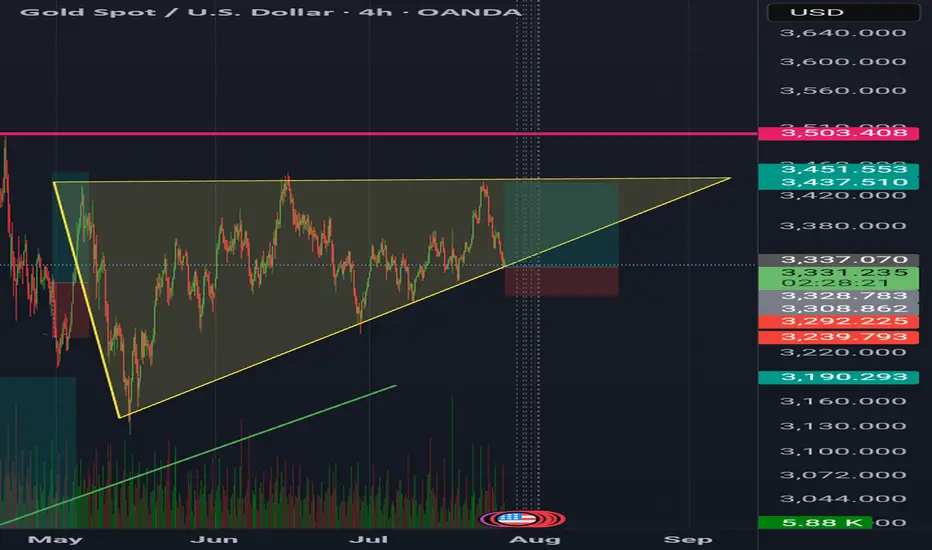
GoldXau usd daily analysis
Time frame 4 hours
Gold is moving up and down in the yellow triangle, you can see on the chart
I think Gold move up to 3450 $ and if we have no positive news, it will drop to the down side. This analysis has good benefit and Risk rewards ratio is 3
On the other hand if Gold break the 3320 $ my analysis is faild and must listen to the economic news
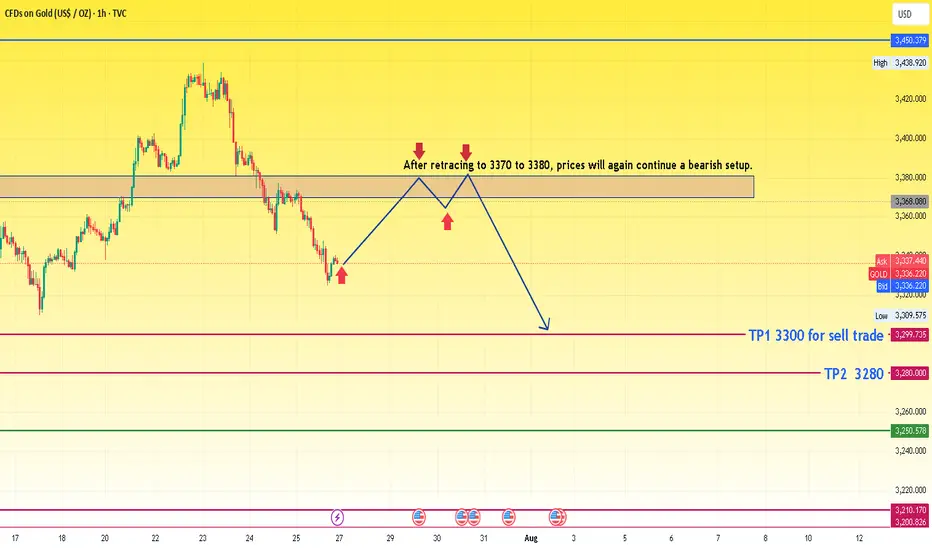
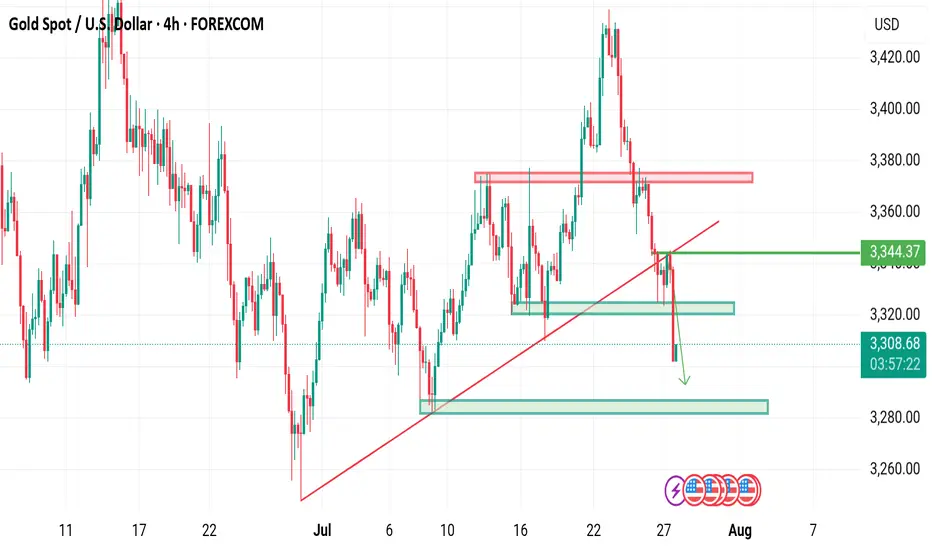
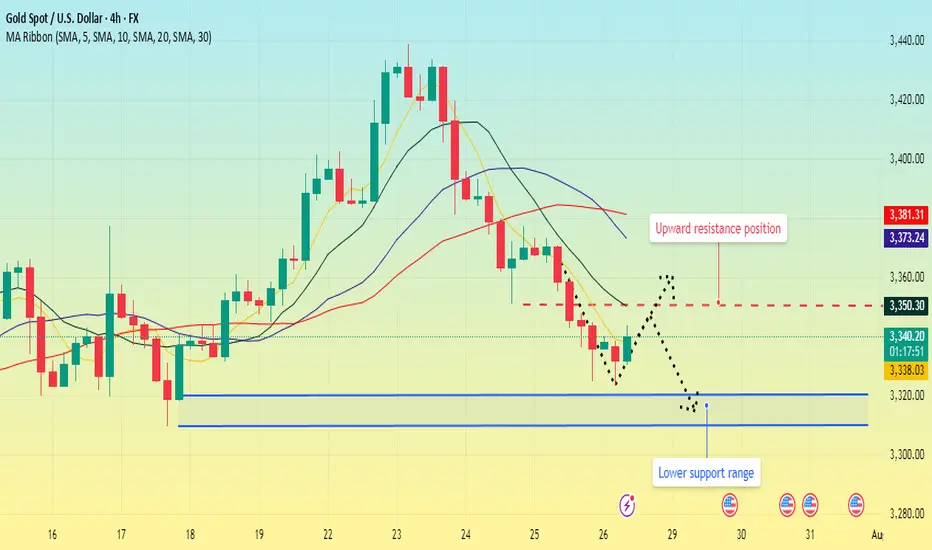
XAUUSD idea for upcoming weekThe chart presents a bearish outlook for gold based on a retracement and continuation pattern. Here's a detailed analysis:
🔍 Chart Summary:
Current Price: Around 3336
Bias: Bearish (after retracement)
Resistance Zone: 3370 – 3380
Sell Confirmation Area: Upon rejection from the 3370–3380 resistance zone
Target 1 (TP1): 3300
Target 2 (TP2): 3280
📈 Technical Structure:
Recent Trend:
The price has dropped sharply from its recent peak.
Now it's attempting a pullback to previous support, which has turned into a resistance zone (3370–3380).
Price Action Expectation:
A retracement is expected toward 3370–3380.
If the price gets rejected from this resistance block, the chart suggests the formation of a lower high.
After rejection, a bearish continuation is expected.
Projected Move:
Short entry around the resistance zone.
Targets:
TP1: 3300 (intermediate support)
TP2: 3280 (major support)
🧠 Trade Idea Logic:
The chart follows a classic bearish price action setup: impulse → retracement → continuation.
The consolidation and break area has flipped from support to resistance.
The retracement zone is clearly defined, making it a high-probability area for reversal if bearish signals (e.g., rejection candles) form.
⚠️ Key Considerations:
Wait for confirmation: Do not enter blindly at 3370–3380. Look for rejection patterns (like a bearish engulfing or pin bar).
Volume and fundamentals: Watch for economic data or geopolitical news that might invalidate the technical setup.
SL Suggestion: Above 3385 or 3390 to allow some room for wick spikes.