Gold prices plunge in the short term!Market news:
In the early Asian session on Thursday (July 24), spot gold fluctuated in a narrow range and is currently trading around $3,388 per ounce. International gold suffered a fierce sell-off after a sharp rise in the previous two trading days. Media reports said that the United States and the European Union were getting closer to reaching a tariff agreement, and the news hit safe-haven demand. The decline in London gold prices was mainly due to the dual pressure of easing macro-geopolitical tensions and the recovery of risk appetite.Although the Federal Reserve is expected to keep interest rates unchanged, the controversy surrounding the independence of the Federal Reserve is heating up. According to a recent Reuters survey, most economists believe that the Federal Reserve is currently facing unprecedented political pressure, which provides potential medium- and long-term support for gold. However, in the short term, as the resilience of US economic data emerges and market risk sentiment improves, investors are cautious about the Federal Reserve's expectations of a sharp interest rate cut this year, and gold has lost the momentum to further attack.The current market focuses on the progress of trade negotiations between major economies in the world and the upcoming Federal Reserve interest rate meeting. Against the backdrop of the implementation of the US-EU and US-Japan agreements, the short-term safe-haven properties of gold may continue to weaken. In addition, this trading day will usher in the July PMI data of European and American countries, the change in the number of initial jobless claims in the United States, the annualized total number of new home sales in the United States in June, and the interest rate decision of the European Central Bank!
Technical Review:
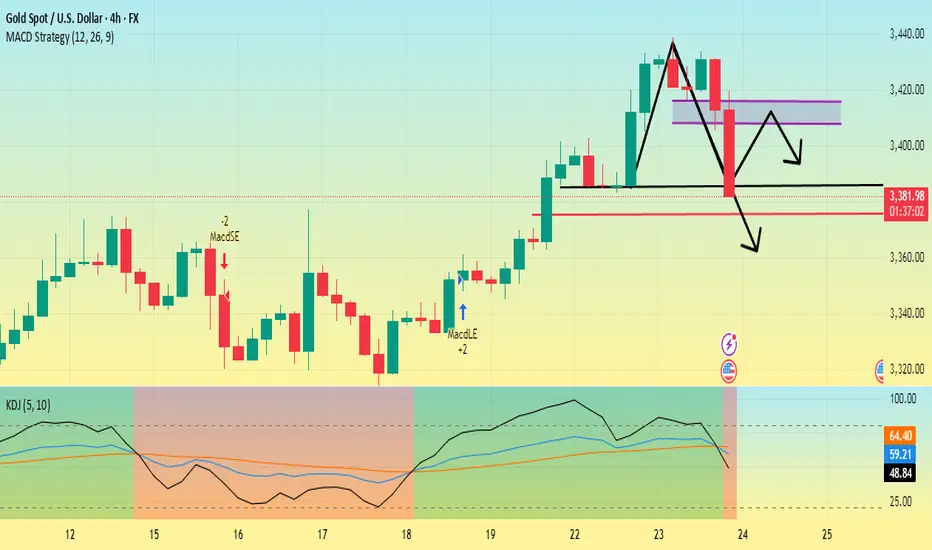
Affected by Trump's speech, the United States reached an agreement with more trading partners, and the market risk aversion cooled down. Gold plunged sharply to a new low of 3381 in the late trading. The technical daily structure closed with a single negative line, ending the strong form of the continuous positive structure. However, the daily MA10/7-day moving average still maintained a golden cross opening upward, moving up to 3378/67. The price is currently adjusted at the 5-day moving average of 3390, and the RSI indicator is running above the middle axis. The price is in the upper and middle track of the Bollinger band.
The short-term four-hour chart retreated to the middle track of the Bollinger band at 3380 and stopped falling, and the RSI indicator adjusted its middle axis. The moving average high at 3410 opened downward in a dead cross, and the short-term gold price fell into a wide range of shocks. Today's trading strategy is to sell at high prices and buy at low prices. The strategy layout is based on fluctuations. Let's look at the 3366/3416 range first.
Today's analysis:
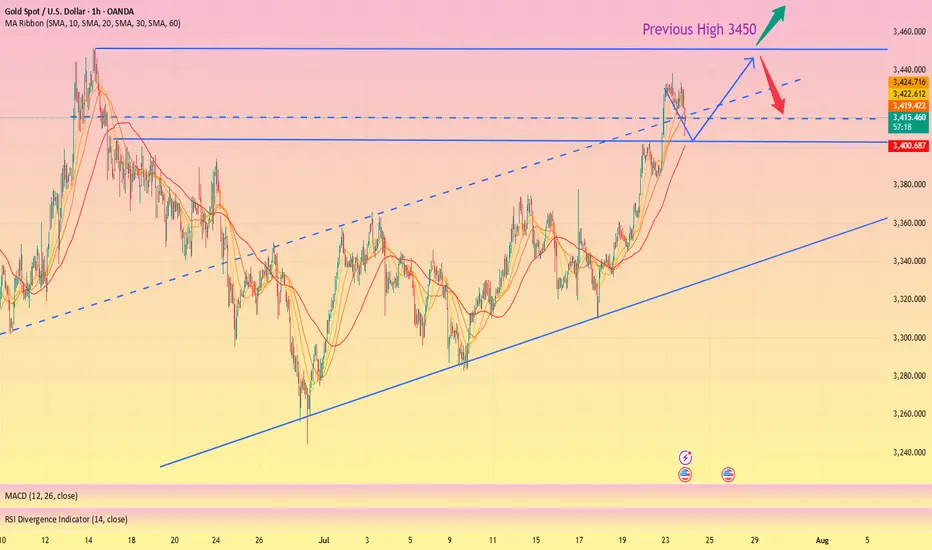
Yesterday, gold fell straight in the European and American trading hours, with a drop of more than 50 US dollars. The main reason is the impact of European and American tariffs. Last night, the European and American trade negotiations determined a 15% tariff. The market's risk aversion sentiment subsided, causing the gold price to fall. The gold daily line finally closed with a big negative line, and the gold daily line was covered with dark clouds! The rebound during the day is mainly sold at high prices!The high level of the gold 1-hour moving average has begun to turn around. The buying power of gold has obviously suffered a heavy blow under the influence of the news. The short-term high level of gold 1 has also formed a head and shoulders top structure. As long as the gold rebound does not break through 3400, the right shoulder of gold will be completed. Then gold will complete the short-term top structure of the head and shoulders top in the short term, and gold selling will begin to work.
Operation ideas:
Short-term gold 3366-3369 buy, stop loss 3358, target 3390-3410;
Short-term gold 3400-3403 sell, stop loss 3412, target 3380-3360;
Key points:
First support level: 3380, second support level: 3367, third support level: 3353
First resistance level: 3403, second resistance level: 3410, third resistance level: 3420
Goldprediction

Gold peaked in the short term. Welcome a new trend?The previous rising structure of gold was broken, especially yesterday's rapid decline broke through the previous support of 3385. Although it rebounded slightly, it was difficult to change the adjustment. Yesterday's high point of the US market was at 3396-98 US dollars. Today, the adjustment trend continued. The dividing point between long and short is 3395 US dollars today. Before the price reaches here, do not consider long.
Many traders are confused. Why are there longs one day and shorts the next day? In fact, this is the characteristic of the volatile market. Breaking the key position cannot last. No matter what you think about the market, you must pay attention to the current shape changes. In the volatile market, you should consider the market of the day more, not the long-term direction.
From the 1-hour chart, the gold price rebounded near 3390 and shorted, and the profit range is 3370-3350.
The backup strategy is to break through 3400 and go long, and pay attention to 3415-3425 on the upside.
In other words, look for opportunities to short on a rebound below 3400 today, and adjust your thinking after breaking through the key resistance.
The bearish wave recovery ends and a new bullish wave begins✏️ OANDA:GBPUSD After a long downtrend that touched the important support zone of 1.138 GBPUSD has recovered to the upside. The h4 candle has just closed above the accumulation zone of 1.345 to continue the upward momentum towards the peak of 1.367. The price line also created a trendline supporting the main uptrend of the pair, and the price line can follow the uptrend to the Target.
📉 Key Levels
Support: 1.345 - 1.338
Resistance: 1.360-1.367
Buy Trigger: Rejects above 1.345
Buy zone: 1.348-1.345
Target 1.367
Leave your comments on the idea. I am happy to read your views.

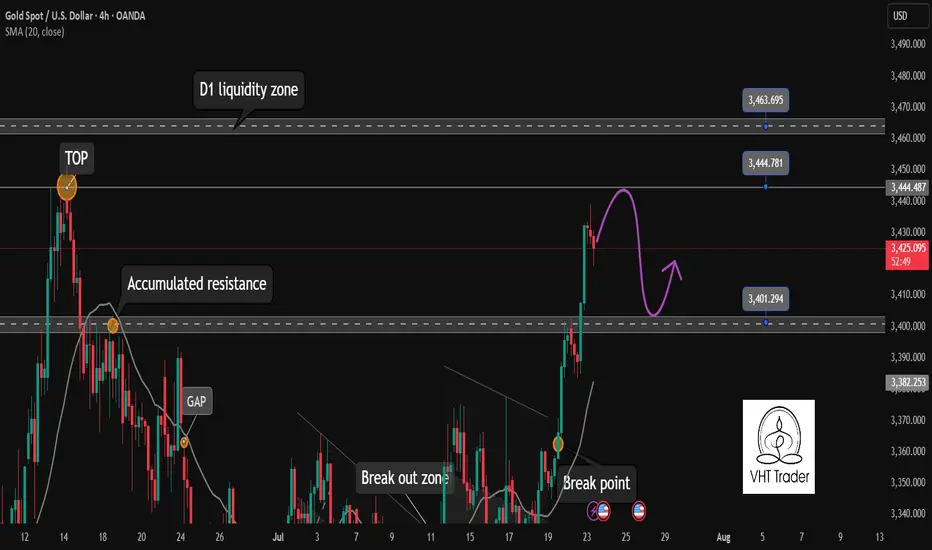
Gold will pause its rally today. Be cautious✏️ OANDA:XAUUSD continues to hit new highs this week. As the daily candle closes above the 3430 area, gold is creating a wide trading range of about 50 prices today. The uptrend may face a slight slowdown due to profit-taking psychology of some investors.
📉 Key Levels
Sell trigger: Rejection from 3445
Sell zone: 3463
Target: 3405
BUY trigger: 3402 (Price retests breakout zone and buyers react)
Leave your comments on the idea. I am happy to read your views.
Gold is weak. Will it continue to fall?Yesterday, the price of gold did not continue to rise as strong as in the previous two days. After reaching the previous top position, it began to retreat under pressure.
The market is too bullish, and under this pattern, the market is likely to have an unexpected reversal. Yesterday, it fell below the 3400 integer mark, so it is likely to maintain a volatile downward trend in the future.
The current main support level is around 3370, which is also the primary point for the bears to continue to break down in the future. Once it falls below this position, the target may be around 3345-3355. It cannot be said that it has completely turned to a bearish position at the moment. It is just a bearish oscillation pattern within a large range, and the upper pressure is maintained near 3405, which is also the support point for the first downward step of the bears on Wednesday.
Today, we still need to operate around the short position first. The price rebounds to 3405 and shorts, and the profit range is around 3390-3380, and the stop loss is 3415.
After a new low appears in the European session, wait for the US session to rebound and continue shorting.

GOLD - One n Single Support, holding or not??#GOLD.. market just reached at his current ultimate supporting area and that is 3385
Keep close it and if market hold it in that case we can see again bounce otherwise not..
Note: we will go for cut n reverse below 3385 on confirmation.
Good luck
Trade wisely
Gold Next Move According To My Analysis (READ DESCRIPTION).Hellow Traders, I'm here with new idea.
The Previous Major Highs and Lows
price (3125) Major Low
Price (3449) Major High
Price (3253) Major Low
Price (3432) Major High
The market rejects four times at the price (3436) according to D1 TF. when the market touches the area (3436) then falling again and again so it couldn't break.
Now the price respects the demand zone M30, It will give you few pips, after a little pump gold will drop if price respects the bearish engulfing H1 at 3420-3432. Now the trend is bullish it will change if price breaks the Trendline and 3253 area then our target will be 3129.
If price breaks the area 3432 then we will change our gear into buy because when the price breaks the supply zone it will be {BOS} and RBS.
STAY TUNE FOR UPDATE
KINDLY SHARE YOUR IDEAS HERE AND LEAVE POSSITIVE COMMENTS, THANKS EVERYBODY.

Perfect profit on short position, long TP 3450#XAUUSD
Gold is in an upward trend from the daily chart. From the technical indicators, the SMA5-SMA10 moving averages are golden crosses, BOLL opens upward, the K line runs on the upper track of the daily Bollinger Band, and the MACD continues to increase, indicating that the bullish trend remains unchanged📈.
The approaching August 1st tariff deadline, coupled with uncertainties such as the Federal Reserve, provide short-term support for gold🔍.
📊The current lower support is at 3410-3400. If it falls back to this level during the day, you can consider going long. Gradually check 3430 and 3440 on the upside, and pay close attention to the breakthrough of the 3450 level🏅. If it effectively breaks through 3450, gold is expected to break through the historical high. If it encounters resistance near 3450 as in the previous trend, you can consider shorting📉.
🚀BUY 3410-3400
🚀TP 3430-3440
GOLD ROUTE MAP UPDATEHey Everyone,
Another PIPTASTIC day on the charts with our analysis once again hitting gold!!!
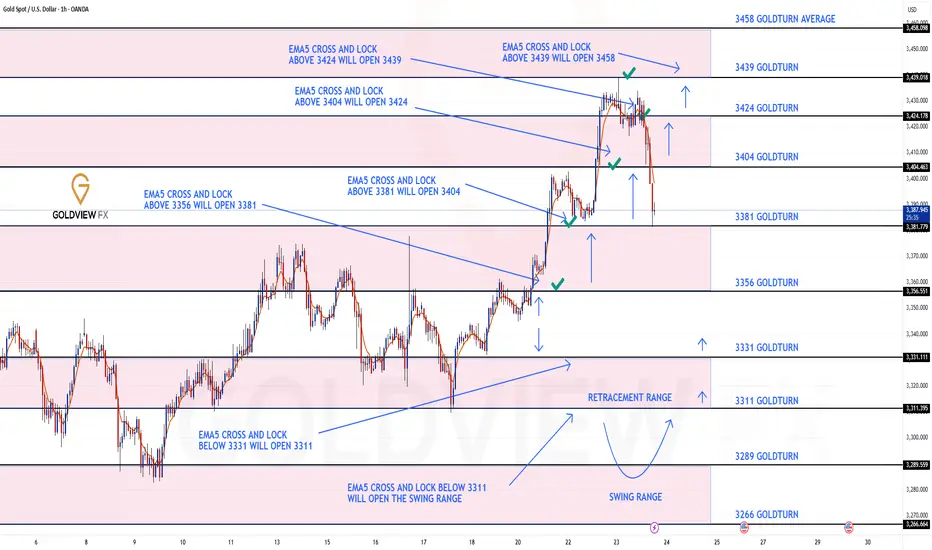
After completing all our bullish targets yesterday we stated that we will now look for EMA5 lock above 3424 to open the next bullish level at 3439.
- This played out perfectly completing 3439 to perfection!!
We are now seeing no further lock above 3439 confirming the rejection, which we are seeing now. We will now look for lower Goldturns to be tested for support and bounce inline with our plans to buy dips.
We will keep the above in mind when taking buys from dips. Our updated levels and weighted levels will allow us to track the movement down and then catch bounces up.
We will continue to buy dips using our support levels, taking 20 to 40 pips. As stated before, each of our level structures gives 20 to 40 pip bounces, which is enough for a nice entry and exit. If you backtest the levels we’ve shared every week for the past 24 months, you’ll see how effectively they were used to trade with or against short/mid-term swings and trends.
The swing ranges give bigger bounces than our weighted levels, that’s the difference between the two.
BULLISH TARGET
3356 - DONE
EMA5 CROSS AND LOCK ABOVE 3356 WILL OPEN THE FOLLOWING BULLISH TARGETS
3381 - DONE
EMA5 CROSS AND LOCK ABOVE 3381 WILL OPEN THE FOLLOWING BULLISH TARGET
3404 - DONE
EMA5 CROSS AND LOCK ABOVE 3404 WILL OPEN THE FOLLOWING BULLISH TARGET
3424 - DONE
EMA5 CROSS AND LOCK ABOVE 3424 WILL OPEN THE FOLLOWING BULLISH TARGET
3439 - DONE
EMA5 CROSS AND LOCK ABOVE 3439 WILL OPEN THE FOLLOWING BULLISH TARGET
3458
BEARISH TARGETS
3331
EMA5 CROSS AND LOCK BELOW 3331 WILL OPEN THE FOLLOWING BEARISH TARGET
3311
EMA5 CROSS AND LOCK BELOW 3311 WILL OPEN THE SWING RANGE
3289
3266
As always, we will keep you all updated with regular updates throughout the week and how we manage the active ideas and setups. Thank you all for your likes, comments and follows, we really appreciate it!
Mr Gold
GoldViewFX
The callback continuity is poor, and the bulls are still strong📰 News information:
1. Geopolitical situation
2. Tariff retaliation
📈 Technical Analysis:
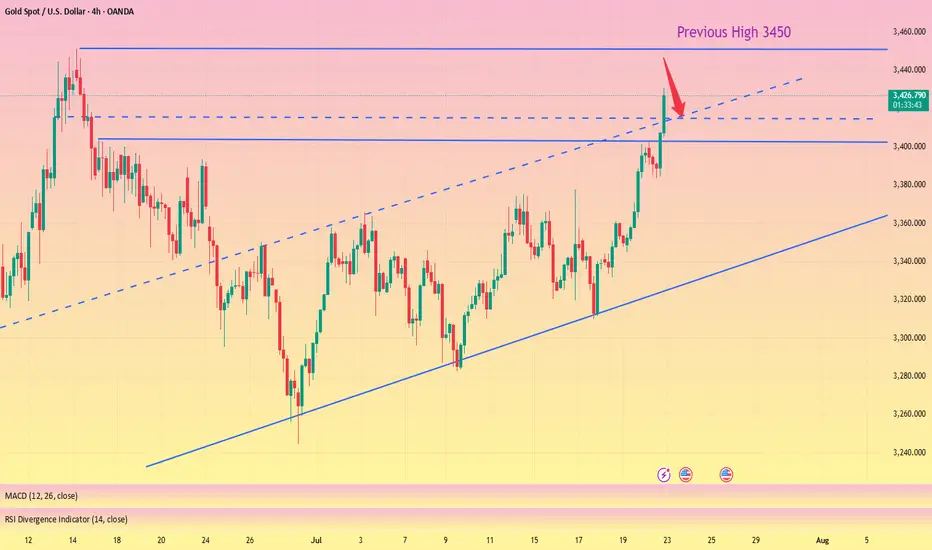
Trump continued to lash out at the Fed, but seemed to have backed off on whether to remove Fed Chairman Powell. The continuous rise of the gold index, once close to 3440, also ushered in a new high in more than a month. Next, we need to pay attention to whether gold can reach the 3450 mark.
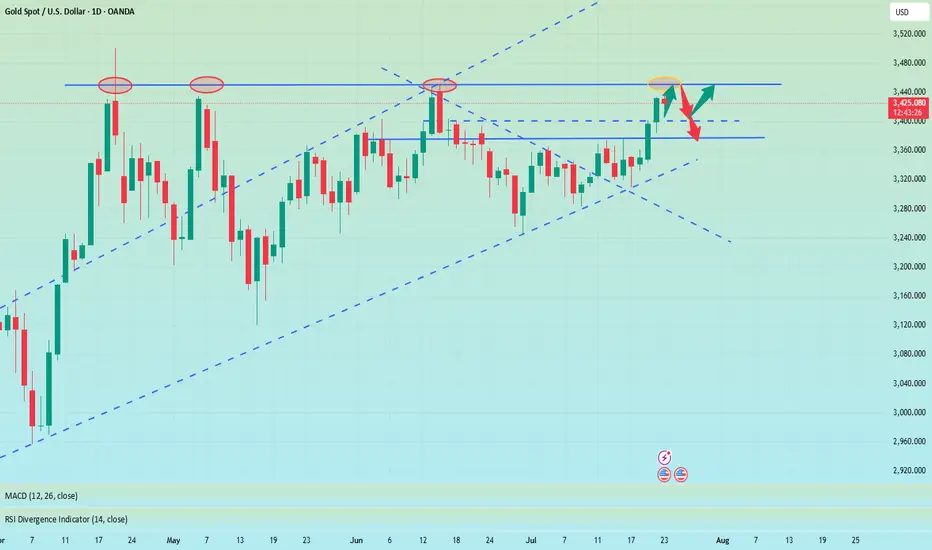
Judging from the daily chart, there were three times when it touched around 3450 and then fell back. If it breaks through and stabilizes above 3450 this time, the historical high of 3500 may be refreshed. If it cannot effectively break through 3450, the probability of subsequent retracement is still very high.
From the hourly chart, the bottom support is almost at 3405-3400. However, the recent rhythm belongs to the consolidation of the Asian and European sessions, the US session has begun to rise, and the risk of serious overbought data indicators is still there. This is why I told everyone in the morning that we need to be vigilant about the current rise. Waiting for a pullback to go long is relatively more stable. I also explained in the morning that if it falls below 3405-3400, the decline may continue to around 3385. After all, the fundamental purpose of our trading is to make a profit, so we must minimize the foreseeable risks to the greatest extent possible.
On the whole, if there is an obvious stop-loss signal at 3405-3400, you can consider going long and looking at 3450. Once it falls below 3400, don't chase it easily, and pay attention to the possibility of a retracement below 3385.
🎯 Trading Points:
BUY 3405-3400
TP 3440-3450
In addition to investment, life also includes poetry, distant places, and Allen. Facing the market is actually facing yourself, correcting your shortcomings, facing your mistakes, and exercising strict self-discipline. I share free trading strategies and analysis ideas every day for reference by brothers. I hope my analysis can help you.
FXOPEN:XAUUSD OANDA:XAUUSD FX:XAUUSD FOREXCOM:XAUUSD PEPPERSTONE:XAUUSD TVC:GOLD
Excellent profits booked [500 pips SECURED ]As I mentioned throughout yesterday’s and Today's commentary session:
My strategy is still the same – sell from 3430-3435.
Gold around my key level yesterday at 3432-3435, which the market respects well and as our first target was 3405 then 3495
Very happy with the profits so far.
My medium-term targets remain 3390 & 3380 which is achieved alhumdulliah .I sold gold from every local high.
Also I mentioned 3420 turns retest and i opend my another sell trades on down side
All I say thanks to those who followed us and made profits.
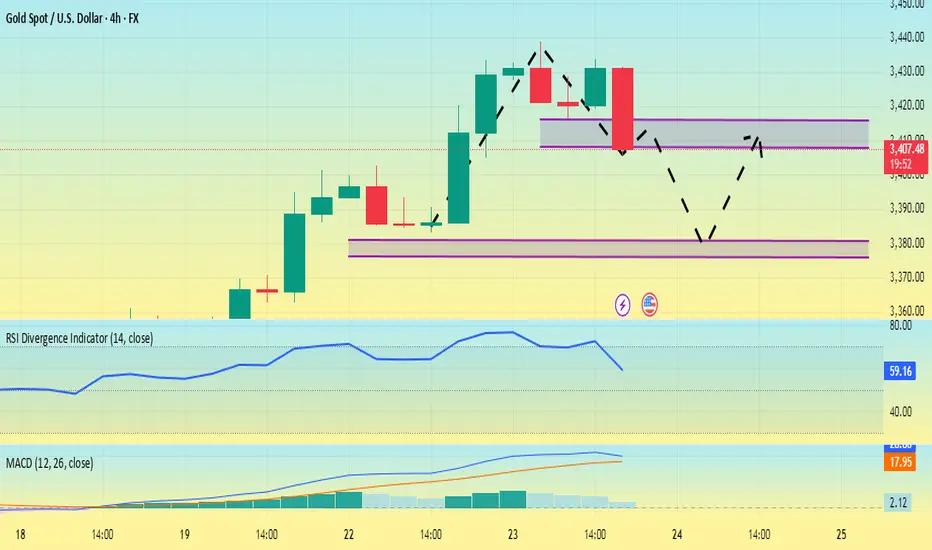
Gold is going down. Can it break through?First, we can look at the daily chart,Currently, the support below the gold daily chart is around 3385, which is also the low point on Tuesday. The current price drop has already touched the support near 3385.
Secondly, from the 4-hour chart, the low point of yesterday's US market retracement was around 3405, and the high point on Monday was 3400. So the first pressure point of this price correction is 3400-3410, followed by the suppression position near 3420.
The 4-hour chart shows that the gold price fluctuated in the 3410-3440 range in the early stage, the MACD red column shortened, and the KDJ dead cross began to appear, facing the pressure of correction in the short term.
At present, the main focus is on whether the 3385 support line can be broken. If it falls below this support level, it will most likely touch around 3375. Then gold will most likely start a downward trend and the rebound will be weak.
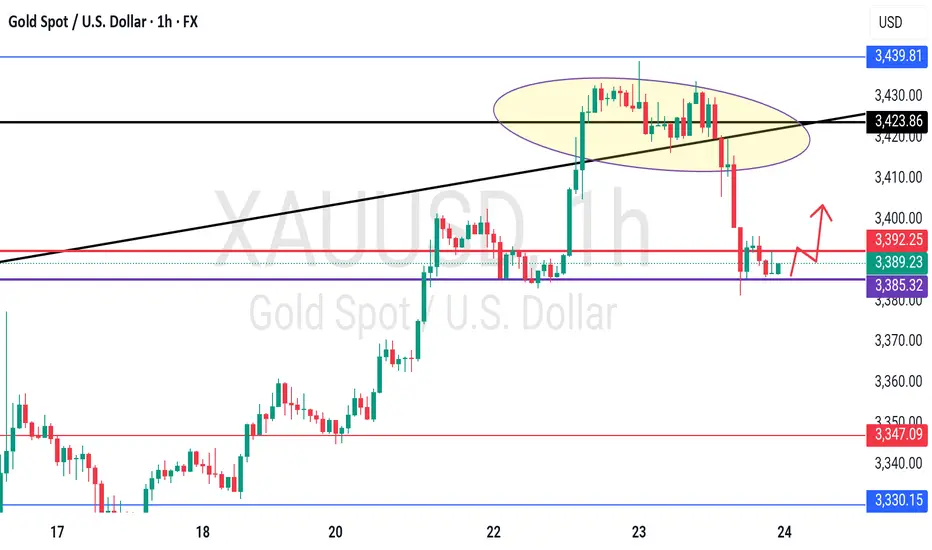
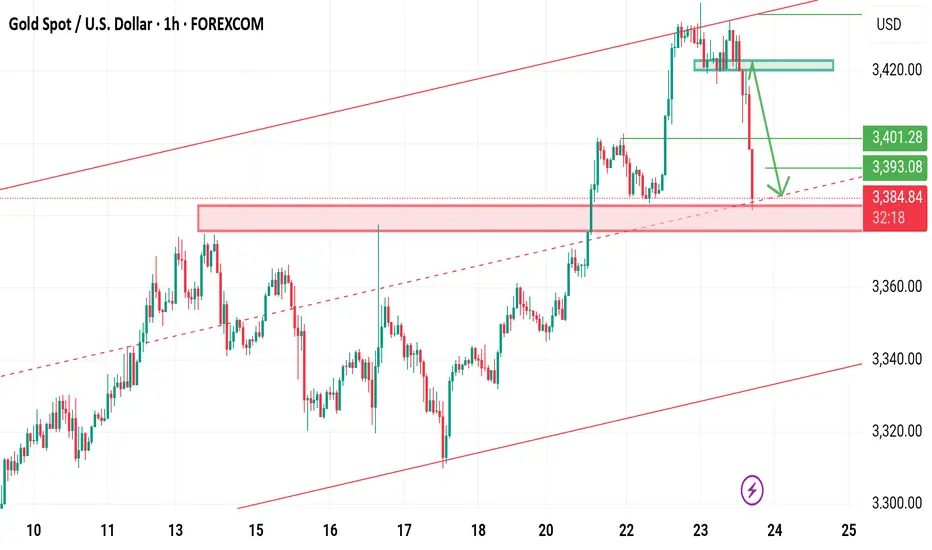
Gold Takes Flight, But Will Support Hold? Watch This Zone!Gold has broken its key resistance level in the New York session and, at the same time, has taken support from the trend line, which is pushing it upward. Currently, however, gold has also broken through another minor support level, and we can now observe that it is pulling back and moving downward.
It is advisable to remain patient at this stage. Wait for the market to come down to the zone where the previous resistance has now turned into support. If the price reacts positively at that level and shows signs of holding, we could potentially see a good buying opportunity from there.
As always, please conduct your own research (DYOR) before making any trading decisions. This is not financial advice.

Gold-----Buy around 3400-3410, target 3430-3450Gold market analysis:
The current highest gold buying has reached around 3438, which is the daily pressure level. This position is the high ground position that has touched the top many times before. The time to buy at these positions will not be long. There have been many dives before. However, as far as the current trend is concerned, the general trend is still buying, and short-term operations still have to buy. The daily buying is still not enough and closed positive again. The daily moving average began to diverge. Today's idea is to follow the buying first. I estimate that gold will enter a large game structure repair below 3451. In theory, short-term buying can be done, but the difficulty of intercepting on both sides will be more. You can keep buying at a low price in the short term. If it breaks 3400, it will turn weak.
Our idea is to find buying opportunities above 3400-3410. The previous pattern was near 3405, and the daily moving average position was near 3390. The time and space for repair will be very large. If it breaks 3400, we need to think about whether it will enter a large technical adjustment.
Support 3400-3405, small support 3409, suppression 3438, 3445, 3451, the strength and weakness dividing line 3402.
Fundamental analysis:
Recently, it is all regular data, there is no big fundamentals and new news that can affect the market.
Operation suggestion:
Gold-----Buy around 3400-3410, target 3430-3450

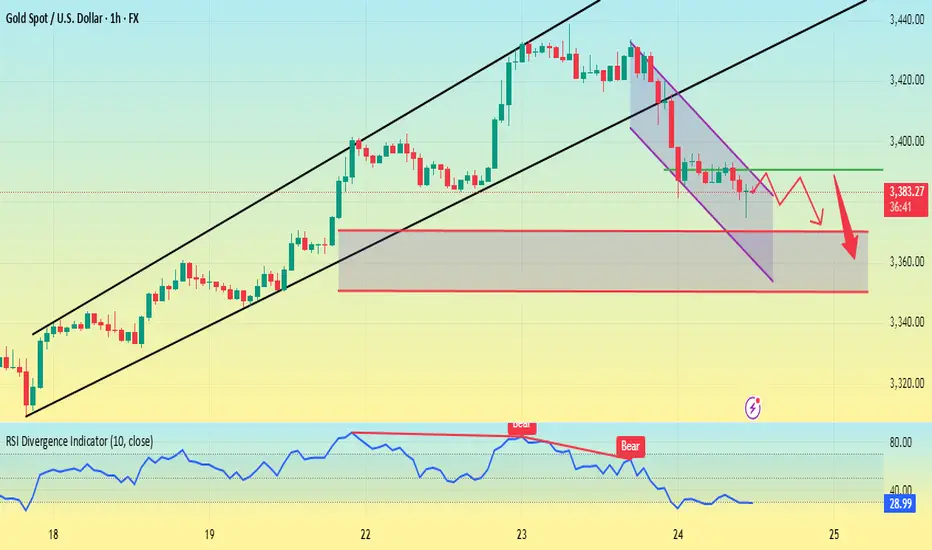
XAUUSD on bearish retest sellGold is currently still holding rising channel along with the swing moves we were on sell throughout from yesterday and my 1st Attempt on sell achieved with 200 PIPs Tp now I'm expecting the again reversal retest move!!
What's possible scanarios we have?
▪️I opened again sell opportunity from 3420-3425 area by following our structural retest strategy, my Selling trade target will be 3405 then 3395 in extension.
▪️if H4 candle closing above 3435 this Parallel moves will be invalid.
#XAUUSD

XAUUSD I Potential Pullback and More GrowthWelcome back! Let me know your thoughts in the comments!
** XAUUSD Analysis - Listen to video!
We recommend that you keep this on your watchlist and enter when the entry criteria of your strategy is met.
Please support this idea with a LIKE and COMMENT if you find it useful and Click "Follow" on our profile if you'd like these trade ideas delivered straight to your email in the future.
Thanks for your continued support!

Gold surges! Gold prices soar!Market news:
In the early Asian session on Wednesday (July 23), spot gold fell slightly and is currently trading around $3,422/oz. Supported by the increasing uncertainty in global trade, the downward trend in U.S. Treasury yields and the weakening of the U.S. dollar, spot gold rose strongly, hitting a five-week high. The market's tension over the August 1 deadline for the implementation of U.S. President Trump's tariffs has intensified, driving safe-haven funds to continue to flow into the international gold market. Investors are focusing on the progress of the U.S. multilateral trade negotiations and the new round of tariffs that the Trump administration is about to launch: while the demand for safe-haven assets has increased, the U.S. 10-year Treasury yield has fallen to a two-week low, further enhancing the attractiveness of non-interest-bearing gold. The global economic slowdown, expectations of loose monetary policy and geopolitical risks will continue to support gold's status as a safe-haven asset. Looking ahead to the market this week, the market focuses on: the Fed's FOMC policy meeting will be held next week. Although the meeting is expected to keep interest rates unchanged, investors have begun to bet on the possibility of a rate cut in October; Fed Vice Chairman Bowman reiterated on Tuesday that the central bank should maintain policy independence, and Powell's upcoming policy meeting may release further signals; in terms of inflation, as signs of tariff costs being transmitted to consumer goods emerge, Powell has previously warned that inflation may accelerate again in the summer.
Technical Review:
Gold maintained its expected bulls and hit a new high yesterday. The daily line maintained a long-term structure of consecutive positive bulls. The MA10/7-day moving average opened upward, and the RSI indicator ran above the central axis. The Bollinger Bands of the hourly and four-hour charts opened upward, the price maintained the middle and upper track channel, and the moving average system opened upward. The idea of gold trading remains unchanged, and the layout is mainly based on buying at a low price and selling at a high price. After a sharp rise last night, gold began to fluctuate at a high level in the second half of the night, and the adjustment was very small, which means that the market is still the strong market. The recent pattern of gold price fluctuations and rises remains. Since it is fluctuating upward, the overall trend of gold today is still biased towards buying, but we need to be alert to the risk of short-term corrections. It is recommended to arrange buy orders based on technical support levels, and pay attention to trade policies and the Fed's trends!
Today's analysis:
Gold buying has been as strong as a rainbow in the past two days, and it is also a buying carnival. Gold is now buying strongly and the momentum is winning. Once the trend is formed, it is necessary to follow the trend. Now the trend of gold buying is very obvious, constantly refreshing the recent highs, so continue to buy gold to the end, and continue to buy if it rises. Continue to buy if it falls during the day!
The gold 1-hour moving average continues to form a golden cross upward buying arrangement. The gold buying power is still there, and gold continues to exert its strength. Gold has risen step by step in the past two days. As long as there is no sharp decline, it is accumulating momentum to attack. The gold support continues to move up. Now it has broken through and stabilized at the 3400 line. If gold falls back to 3400, it can still be bought at low prices.
Operation ideas:
Short-term gold 3400-3403 buy, stop loss 3392, target 3420-3440;
Short-term gold 3438-3441 sell, stop loss 3450, target 3400-3380;
Key points:
First support level: 3412, second support level: 3403, third support level: 3390
First resistance level: 3438, second resistance level: 3450, third resistance level: 3468

XAU/USD(20250723) Today's AnalysisMarket news:
White House officials plan to visit the Federal Reserve headquarters on Thursday local time.
Technical analysis:
Today's buying and selling boundaries:
3416.02
Support and resistance levels:
3465.76
3447.17
3435.12
3396.94
3384.89
3360.33
Trading strategy:
If the price breaks through 3435.12, consider buying, the first target price is 3447.17
If the price breaks through 3416.02, consider selling, the first target price is 3396.94

Gold is bullish and bearish. Will it continue?From the daily chart:
The moving average is bullish, and the MA5-day, 10-day, and 30-day moving average supports move up. The 3380 dollar has turned from resistance to strong support. If this position is maintained, the upward channel will continue. The support position is 3380-3375, which is the top and bottom conversion position, and is also near the middle track of the Bollinger Band.
From the four-hour chart, the MACD red column shrinks and the RSI is near 60, and the bulls are still dominant. If the price falls back to the 3375-3380 area and stabilizes, it is expected to attack the 3400 mark again.
Operation strategy:
Long operation:
Steady type: When the gold price falls back to the 3375-3380 area, long orders are arranged in batches, with a stop loss of 3365 and a profit range of 3400-3410.
Aggressive: If the price breaks through 3400 quickly and falls back to around 3395, you can chase long with a light position, stop loss at 3388, and the profit range is 3420 strong resistance area.
Short operation:
Resistance area test short: 3408-3415 area, light position short order, stop loss at 3422, profit range 3390-3380.
Break short: If it falls below the 3375 support and the rebound is weak, follow up with short short, profit range 3360, stop loss 3385.
The real target of gold is more than 3400
💡Message Strategy
The United States has recently made frequent moves in global tariff policies. Treasury Secretary Bensont has clearly set August 1 as a hard deadline for tariff negotiations among countries. At present, EU trade negotiations have been decoupled from the issue of sanctions against Russia and Ukraine, while Japan's negotiations are progressing smoothly.
These dynamics reflect that the United States is reshaping the global trade pattern through differentiated strategies, and countries are forced to adjust their economic and trade policies under the pressure of tariffs. As the deadline approaches, gold is facing a test of long and short positions.
The White House's pressure on the Federal Reserve is still fermenting. The US Treasury Secretary said that the Federal Reserve should cut interest rates now, but at the same time said that there is no sign that Powell should resign now. If he wants to leave early, he should do so. Powell gave a public speech yesterday, but to the disappointment of the market, he did not mention monetary policy and the possibility of resignation. However, Trump's pressure on the Federal Reserve has taken effect, and the market has turned its attention to interest rate cuts.
📊Technical aspects
Yesterday, Tuesday, we believed that the trade negotiations between Europe and the United States were on the verge of breaking down, which led to a rise in risk aversion in the market, boosted gold safe-haven buying, and supported the price of gold to a one-month high.
Therefore, we suggest that you take a bullish approach in terms of operation. Pay attention to the support below at $3,380, and pay attention to the breakthrough of $3,402 above. As expected, it broke through to $3,440, reaching our expected profit target.
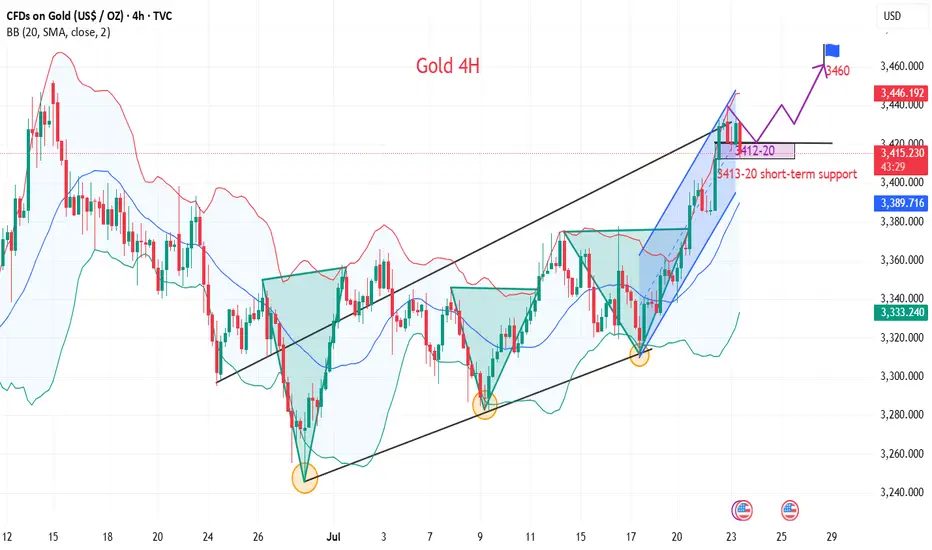
From the 4H trend structure, gold has been climbing rapidly along the upward channel recently. It broke through yesterday and took the 3400 mark in one fell swoop, reaching our expected target of 3440. At present, gold is blocked and falls back on the channel boundary support.
At the same time, the 1-hour RSI broke through the upward trend line support and tested the resistance again, releasing a callback signal in the short term. It is necessary to pay attention to the possibility of short-term adjustments. Today, we can focus on the key resistance around 3415 and try long opportunities.
💰Strategy Package
Long Position:3410-3420,SL:3390,Target: 3440,3460
Gold breaks new high, expect a pullback in the evening#XAUUSD
After the rapid rise of the previous day, the gold market has fallen into an overbought state, but yesterday's increase of nearly $60 still provided solid support for the bulls. It is expected that the market will show repeated fluctuations in the future⚖️.
In terms of operation, it is recommended to pay close attention to the gains and losses of the 3,400 mark. If it is successfully broken through, it is expected to further test the 3,420-3,425 and 3,450 lines; on the downside, pay attention to the top and bottom conversion support of 3,403📈.
📊At present, you can consider shorting near 3430, defending 3440, and aiming at 3410💡
🚀SELL 3430-3440
🚀TP 3415-3405
XAU/USD) Bullish trend analysis Read The captionSMC Trading point update
Technical analysis of Gold (XAU/USD) on the 1-hour timeframe. Here's a breakdown of the key trading
---
Technical Overview
Price: $3,428.71 (currently near the upper consolidation)
EMA 200: Around $3,367.38 (well below price, indicating strong uptrend)
Target Point: $3,468.52
Indicators:
RSI (14): 60.19–62.55 → shows moderate bullish momentum, not yet overbought.
---
Key Technical Elements
1. Bullish Breakout Structure:
Price has broken out of a previous range, and is forming a bullish flag or rectangle, which typically leads to continuation higher.
Measured move projection from previous leg (approx. $51.57 gain) targets the $3,468.52 level.
2. Strong Support Zones:
Two yellow zones highlighted:
Upper support level (around $3,415): acting as immediate structure support.
Lower key support (around $3,380): crucial structure level from where the trend initiated.
3. Trend Line Support:
A clearly marked ascending trend line supporting higher lows—indicating bulls are in control.
Expect price to stay above this trend line to maintain bullish bias.
4. Volume & RSI Confirmation:
RSI remains in a bullish zone but isn’t overbought → leaves room for upside.
Volume remains steady, confirming healthy consolidation.
Mr SMC Trading point
---
Conclusion & Trade Idea
Bias: Bullish
Entry Zone: On breakout or retest of minor support ($3,415–$3,420)
Stop Loss: Below trendline or below $3,415
Target: $3,468.52
Confirmation: Hold above trendline + RSI staying above 50
This is a classic bullish continuation setup supported by structure, RSI, and trend momentum. Traders could look for buying opportunities on minor dips or trendline retests.
---
Please support boost 🚀 this analysis)

XAU/USD) breakout analysis Read The captionSMC Trading point update
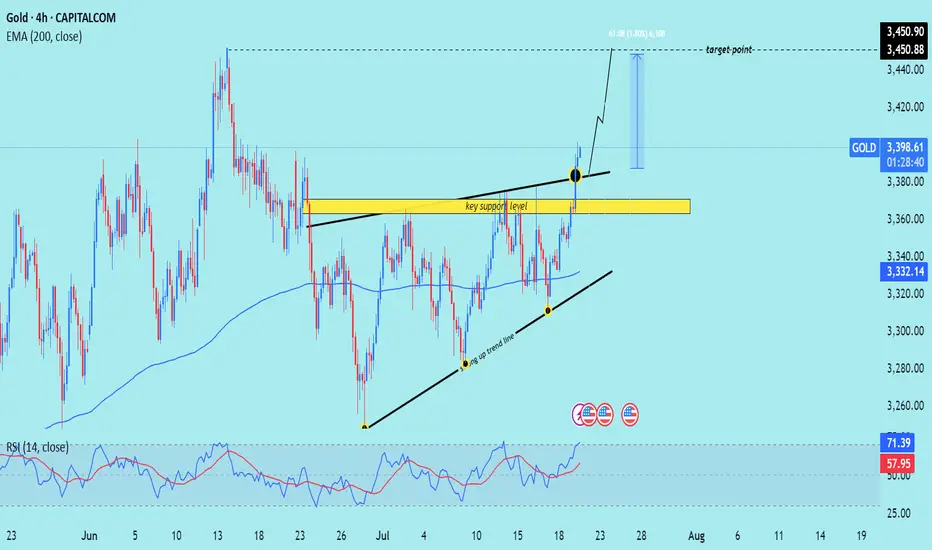
Technical analysis of (XAU/USD) on the 4-hour timeframe, highlighting a move toward the $3,450 target. Here's the full technical breakdown
---
Technical Analysis – Gold (4H)
1. Breakout from Resistance Zone
Price has broken above a key horizontal resistance level (now turned support, marked in yellow).
The breakout is confirmed by a strong bullish candle with momentum, suggesting buyers are in control.
2. Ascending Triangle Formation
Price formed an ascending triangle, a classic bullish continuation pattern.
The breakout above the upper boundary confirms the pattern, projecting a potential measured move.
3. Trendline Support & Higher Lows
The structure shows a rising trendline (black), where price bounced multiple times — confirming a higher low sequence.
The confluence of trendline support + breakout level adds strength to the bullish case.
4. 200 EMA Confluence
The 200-period EMA (3,332.13) has been acting as a dynamic support throughout.
Price retested it earlier in the move, then surged upward — validating trend continuation.
5. RSI Indicator
RSI is at 71.13, entering overbought territory.
This implies strong bullish momentum, but a short-term pullback to retest the breakout level is possible.
6. Target Projection
Target Point: $3,450.90, calculated from the height of the triangle (~61 pts or 1.80%) added above the breakout zone.
A retest of the breakout area (yellow zone) around $3,370–$3,380 could offer a better entry before continuation.
Mr SMC Trading point
---
Summary
Bias: Bullish
Current Price: $3,397.62
Support: $3,370–$3,380 zone (previous resistance turned support)
Trend: Higher lows + breakout above resistance
EMA Support: 200 EMA at $3,332.13
Target: $3,450.90
RSI: 71.13 – bullish but near overbought
Please support boost 🚀 this analysis)