GOLD to the MoonHiper Clear Structure and the beginning of a new impulse towards 3.600 and 3.700
Hope everybody had a chance to got in
gg
Goldprediction

3400 is no longer the target for gold. The answer is: higher
After gold touched 3,400, most people expected gold to fall back. This kind of rigid thinking is often out of touch with reality. During the rise, do you think it is better to short at highs or to go long on pullbacks?
💡Message Strategy
This round of gold's upward movement is not accidental. Behind it are significant changes in macro fundamentals. First, the overall weakening of the US dollar. The recent decline of the US dollar index to below the 98 mark reflects the market's concerns about the outlook for the Fed's policy. At the same time, the 10-year US Treasury yield also fell below 2%, and the actual yield fell, strengthening the relative attractiveness of gold.
More worthy of vigilance are the political rumors surrounding the re-election of Fed Chairman Powell. According to the Wall Street Journal, US Treasury Secretary Bessent once advised the president to avoid removing Powell from office to maintain the reputation of the Fed. However, speculation about Powell's possible dismissal remains, although Trump himself publicly denied the relevant plan.
In addition, Europe's actions have also disturbed the market. According to Bloomberg, citing EU diplomatic sources, if no agreement is reached before August 1, the EU will impose retaliatory tariffs on US products worth US$72 billion, covering areas such as automobiles, aircraft, alcohol and digital services. These messages have formed a risk resonance environment of "political uncertainty + economic friction", providing a natural long hotbed for gold.
Although the US economic data is slightly mixed - consumer confidence has rebounded, but inflationary pressure continues, with CPI approaching 3% in June - this has made the market full of doubts about the Fed's monetary policy path. Especially in the case of sparse economic data this week (only new housing data, initial claims and durable goods orders), the market focus is on the impact of political and policy conflicts on market confidence.
📊Technical aspects
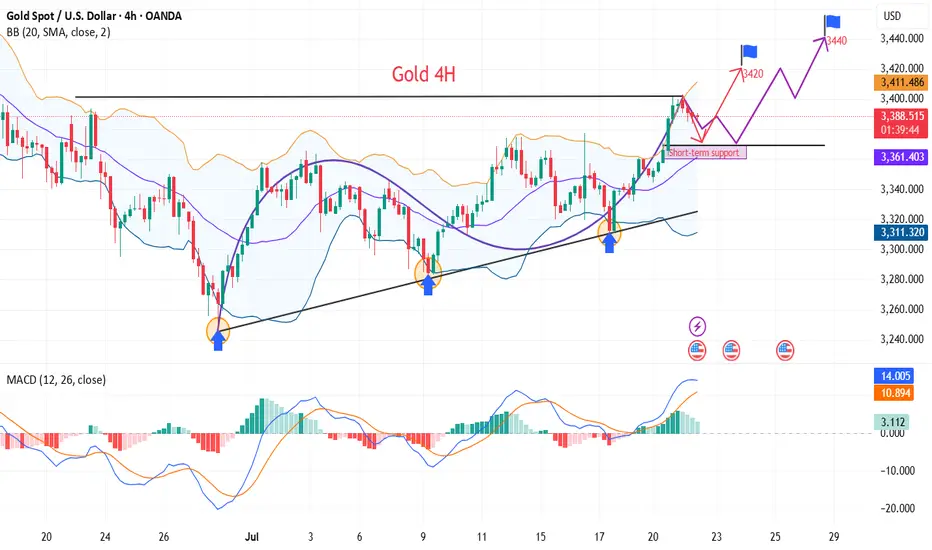
From the daily candlestick chart, gold has recently shown signs of breaking upward after five weeks of sideways fluctuations. In terms of MACD indicators, the MACD histogram has turned from green to red, and the fast and slow lines have formed a "golden cross", strengthening the expectation of a short-term technical rebound.
For gold's lower support, pay attention to last week's high of $3,380, which is also the current 4-hour MA10 moving average position. Secondly, pay attention to the multiple declines in gold prices in the European session on Monday to test the stabilization position of $3,370. For gold's upper pressure, pay attention to the intraday high of $3,402, which is also the high point of gold's rise on Monday. After the decline in June, gold prices rebounded several times to test resistance here and further strengthened. The upper space can pay attention to the high point of the past three months at $3,440.
The previous five weeks of consolidation showed that the market was waiting for directional signals, and this breakthrough of the 3,400 mark was achieved against the dual backdrop of a falling US dollar and rising political uncertainty in the United States, with the typical characteristics of "news trigger + technical confirmation".
If gold successfully stabilizes above 3400, the market will turn its attention to the two key resistance areas of 3451 and 3499, the year's high. Breaking through the former will open up space to test new historical highs upwards; combined with the current MACD golden cross pattern, if the capital side and fundamentals continue to cooperate, short-term accelerated rise cannot be ruled out.
💰Strategy Package
Long Position:3370-3380,SL:3350,Target: 3420,3440
Gold prices soared! Gold hit a five-week high!Market news:
On Tuesday (July 22) in the early Asian session, spot gold rose and fell, and is currently trading around $3,390/ounce. Driven by the weakening of the US dollar, the decline in US bond yields and the increasing uncertainty in trade policies, the gold market broke out again, breaking through the $3,400/ounce mark, hitting a five-week high. As the deadline for the United States to impose new tariffs on global trading partners on August 1 approaches, market uncertainty provides strong support for international gold.In addition to the trade situation, the Federal Reserve's monetary policy trends have also added momentum to the rise in gold prices. The market expects that the probability of the Federal Reserve cutting interest rates in September has risen to 59%. The Federal Reserve's July meeting is expected to keep interest rates unchanged, but the market's expectations for an October rate cut have been fully digested. These policy uncertainties have further enhanced the attractiveness of gold as a safe-haven asset.This week, the London gold price ushered in a "critical node" market. Trade policy, US dollar fluctuations, central bank trends and safe-haven fund flows will become the core driving force of the long-short game in the gold market. On this trading day, Federal Reserve Chairman Powell delivered a welcome speech at a regulatory meeting. Pay attention to whether Powell involves remarks related to monetary policy. In addition, continue to pay attention to news related to the international trade situation and geopolitical situation.
Technical Review:
The gold daily chart is strong and oscillating upward. The MA10/7-day moving average maintains a golden cross and opens upward. The hourly chart and the four-hour chart Bollinger band open upward, the moving average system maintains an upward opening, and the price fluctuates upward along the MA10-day moving average. Yesterday, the Asian session fell slightly to 3346 and stabilized. The bottoming out and pulling up again broke through and stood on the hourly line middle track, which means short-term stabilization!
So yesterday's Asian session rose, the European session continued to break high, and the US session still had a second pull-up; but because it is in a period of oscillation, wait patiently for a wave of stabilization before taking action. The reference point selected should pay attention to the 382 split support, that is, 3370, which happens to be the top and bottom conversion support point, followed by the 3356-3358 split support and the middle track.
Today's analysis:
Gold rose strongly yesterday, breaking the highest level in the past month. After the price of gold rose yesterday, it did not rise and fall like before. Instead, it broke through multiple resistances and came to the 3400 mark. From the one-hour market, the direction of the market is very clear, but it is still not recommended to buy directly. Waiting for a fall before getting on the train is the safest strategy!The Asian session gold price was blocked near 3400, and the one-hour market showed a small double top structure, which means that the market will still adjust in a short time. Therefore, do not buy in the Asian session, wait for the adjustment to continue to buy, and the support below is the top and bottom conversion position of 3370. After the Asian session gold price adjusted to 3370 and walked out of the bottom structure, continue to buy. The general direction of this round is to look at the 3450 line!
Operation ideas:
Buy short-term gold at 3375-3378, stop loss at 3366, target at 3400-3420;
Sell short-term gold at 3425-3428, stop loss at 3436, target at 3390-3370;
Key points:
First support level: 3383, second support level: 3370, third support level: 3358
First resistance level: 3403, second resistance level: 3416, third resistance level: 3428

Gold----Buy near 3374, target 3399-3420Gold market analysis:
Yesterday, Monday, gold rose strongly, reaching a high of around 3402. This range is still relatively rare at the beginning of the week. Let's not worry about whether it is caused by fundamentals. Judging from the market's morphological indicators, we can be very sure that it is a buying trend. Yesterday's buying has broken the 3377 position. The breaking position of this position has determined the new buying position. In addition, the daily moving average has also begun to diverge. The morphological support is around 3370 and 3374. Today, relying on this position, the moving average is bullish. Yesterday, it rose too much. I estimate that there will be a need for repair today. The retracement during the repair is our opportunity to get on the train again. On the weekly line, 3400 is a hurdle. The previous multiple stops were only short-lived, so we need to be cautious when buying above 3400.
There is a signal of closing negative in 4H. The Asian session needs to be adjusted and repaired. It is better to buy at a low price. 3402 is a small pressure. We cannot estimate where it will be repaired. We can determine the support below and buy near the support. There can also be short-term selling opportunities above 3400 in the Asian session. It is only in the Asian session, and the buy order is the main target.
Fundamental analysis:
There is no major news in the recent fundamentals. The situation in the Middle East is still relatively stable. There is no new rest in tariffs, and the impact on the market is limited.
Operation suggestion:
Gold----Buy near 3374, target 3399-3420

GOLD - Cut n Reverse Area? What's next??#GOLD... Perfect holdings upside as we discussed in our video and last idea.
Now 3390-91 is major key level because only above that you can see again bounce otherwise not.
NOTE: we will cut n reverse above 3390-91 on confirmation.
Good luck
Trade wisely
GOLD - at cit n reverse area? What's next??#GOLD... market perfectly moved as per our video analysis and now market just reached at his current ultimate swing area
That is around 3402
So if market holds 3402 in that case selling expected otherwise not.
NOTE: we will go for cut n reverse above 3402 on confirmation.
Good luck
Trade wisely
Gold is under pressure. There is hope for another rise.Today's important news:
At 8:30, Fed Chairman Powell delivered a welcome speech at a regulatory meeting; at 13:00, Fed Governor Bowman hosted a fireside chat session at the large bank capital framework meeting hosted by the Fed.
Market conditions:
The current daily trend is mainly "strong rise" (Monday closed positive and broke through the shock, and the moving average turned upward). The core logic is that short-term bullish momentum is dominant, and it is necessary to focus on the effectiveness of support and the rhythm of breaking through resistance.
Today, we need to focus on the support belt 3365-3360 area (this position is the 5-day moving average position and the low point of yesterday's European session). As a short-term moving average support, this area is the first line of defense for bulls today. If it can stabilize here, it can be regarded as a signal of short-term strong continuation.
The key pressure level is still around 3420. As a trend line resistance that has been under pressure many times in the early stage, if it can break through, it means that the bulls will break the shock suppression and open up more room for growth.
In terms of operation, it is still mainly low-long. The current gold is still strong. Operation strategy:
Short around 3420, stop loss 3430, profit range 3400-3380
Long around 3360, stop loss 3350, profit range 3380-3400

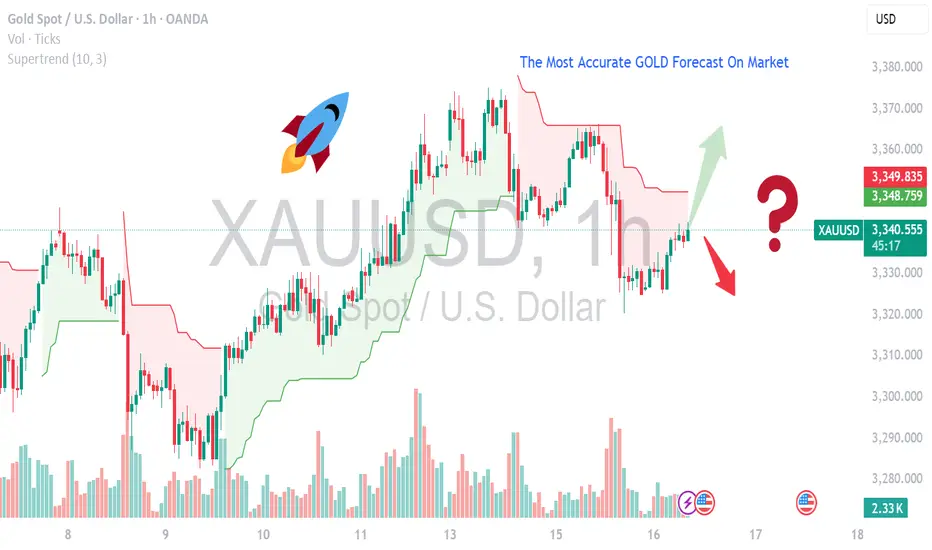
MOST ACCURATE XAUUSD GOLD FORECAST ANALYSIS MARKETCurrent Setup & Technical Outlook
Consolidation & Pennant Formation: Gold is building a bullish pennant and trading above its 50‑day MA — a classic continuation pattern suggesting a breakout toward new highs if momentum resumes .
Key Levels:
Support: $3,330–3,340 — confirmed by multiple technical sources .
Resistance/Breakout Zone: $3,360–3,375 — clearing this could trigger a rally toward $3,400+ .
Upside Targets: $3,390, then possibly $3,500–$3,535 per weekly forecast .
Alternate Bearish Scenario: A failure around the 0.618 Fibonacci resistance (~$3,374) and overbought RSI could spark a pullback to $3,356 or lower .
---
🧠 Fundamental Drivers
Inflation & U.S. Macro Data: Market awaits June CPI/PPI and Fed commentary — cooler inflation could boost gold via dovish expectations, while hotter data may strengthen the USD and weigh on bullion .
Geopolitical & Safe-Haven Demand: Trade tensions (e.g., tariffs) are keeping gold elevated near $3,350–$3,360 .
Central Bank & Real Yields Watch: Continued gold purchases and lower real rates are supportive, although mid-term easing in risks (like global trade) could curb momentum .
Gold Rejection & Retest Zones AnalysisGold has recently broken out of the 1H ascending trendline with a strong bullish push 🚀. After this breakout, we are now watching key supply and demand zones for the next move.
🔴 Bearish OB (3398-3404):
Price is currently hovering around the bearish order block, which could trigger some short-term rejection or pullback from this zone.
🟢 Bullish OB Zones (3350 & 3330):
If gold decides to correct lower, we have two important bullish OBs below, perfectly lining up with the previous trendline retest ✅. These zones can offer high-probability buy setups if price respects them.
🎯 Focus is on watching for possible rejections from the top OB, or waiting for a deeper retracement towards the bullish zones for buy confirmations

Gold (XAU/USD) Bullish Outlook Based on Price ActionGold (XAU/USD)**, showing a bullish outlook based on price action and support zones.
**Chart Analysis:**
* **Current Price:** \$3,359
* **EMA Signals:**
* EMA 7: \$3,353
* EMA 21: \$3,345
* EMA 50: \$3,341
**Bullish EMA alignment** (short EMAs above long) signals upward momentum.
* **Support Zones:**
* **S1**: \~\$3,345 (strong short-term demand area)
* **S2**: \~\$3,325 (deeper support zone)
* **Volume:** Spikes in green bars signal strong buyer interest near support, especially during the bounce.
* **Projected Move (Green Arrow):**
* A potential retest of the breakout zone (\~\$3,350) could happen before gold targets the **next key resistance** near **\$3,410**.
**Summary:**
Gold broke above a consolidation range supported by EMA alignment and strong volume. As long as the price stays above S1 (\$3,345), the trend remains bullish with upside potential toward \$3,400–\$3,410. A pullback may occur first, offering re-entry opportunities.

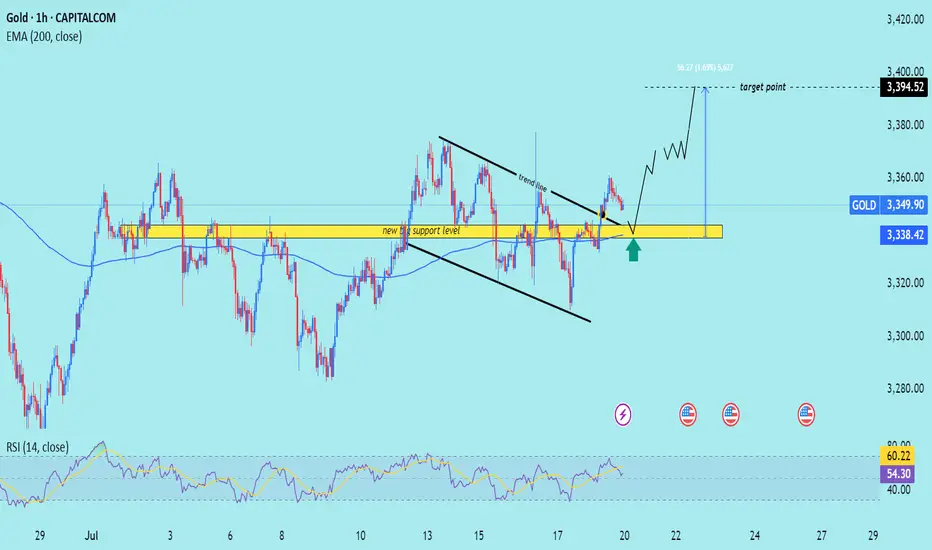
XAU/USD) Bullish trend analysis Read The captionSMC Trading point update
Technical analysis of XAU/USD (Gold) on the 1-hour timeframe. Here’s a breakdown
---
Technical Analysis Summary
Descending Channel Breakout
Price action previously formed a descending wedge/channel, shown by the two black trendlines.
A bullish breakout occurred above the trendline, signaling a shift in momentum from bearish to bullish.
Key Support Zone
The yellow highlighted zone (around $3,338–$3,340) is marked as the “new key support level”.
Price is expected to retest this area (confluence with 200 EMA), which aligns with standard bullish breakout behavior.
The green arrow indicates potential bounce confirmation.
Bullish Projection
After the retest, price is projected to climb steadily toward the target point at $3,394.52.
The setup anticipates around 56.27 points upside, or roughly +1.69% gain from the support zone.
---
Target
$3,394.52 – defined using the previous range breakout height and horizontal resistance.
---
Trade Idea
Entry: On bullish confirmation near $3,338 support zone.
Stop Loss: Just below the yellow zone (e.g., under $3,330).
Take Profit: Near $3,394.
Mr SMC Trading point
---
Conclusion
This is a classic breakout-retest-play, supported by trendline structure, a key horizontal support zone, and RSI strength. As long as price respects the highlighted support, the bullish outlook remains valid.
Please support boost 🚀 this analysis)
Accurate prediction, continue to buy after retracement to 3353📰 News information:
1. The Trump administration puts pressure on the Federal Reserve to cut interest rates
2. The continued impact of tariffs and the responses of various countries
📈 Technical Analysis:
Gold is currently rising rapidly, reaching a high near 3368, and the overall bullish trend has not changed yet. It is not recommended to continue chasing the highs at present. Those who are long at 3345 can consider exiting the market with profits. The technical indicators are close to the overbought area and there is a certain risk of a correction. Be patient and wait for the pullback to provide an opportunity. At the same time, 3353 has become the position with relatively large trading volume at present, and the top and bottom conversion in the short term provides certain support for gold longs. If it retreats to 3355-3345, you can consider going long again, with the target at 3375-3385. If it falls below 3345, look to 3333, a second trading opportunity within the day. If it falls below again, it means that the market has changed, and you can no longer easily chase long positions.
🎯 Trading Points:
BUY 3355-3345
TP 3375-3385
In addition to investment, life also includes poetry, distant places, and Allen. Facing the market is actually facing yourself, correcting your shortcomings, facing your mistakes, and exercising strict self-discipline. I share free trading strategies and analysis ideas every day for reference by brothers. I hope my analysis can help you.
FXOPEN:XAUUSD OANDA:XAUUSD FX:XAUUSD FOREXCOM:XAUUSD PEPPERSTONE:XAUUSD TVC:GOLD
NordKern - XAUUSD InsightNordKern | Simplified Insight OANDA:XAUUSD possible scenarios
Gold saw some upside today, primarily driven by softer TVC:DXY and trade deadlines ahead. To be specific:
1. Softer U.S. Dollar (DXY)
The U.S. Dollar Index fell ~0.1–0.2% today, making gold more attractive for international buyers
Kitco confirms the decline in USDX, paired with weaker Treasury yields, is fueling bullion demand.
2. Cautious Market Ahead of Trade Deadlines
Markets are bracing for the August 1 U.S. tariff deadline, especially involving the EU. Investors are positioning defensively, increasing safe-haven interest in gold.
Heightened trade tensions and uncertainty including possible Trump-Xi talks boost demand for safe assets.
3. Falling Treasury Yields & Fed Policy Expectations
The U.S. 10‑year Treasury yield has slipped (~4.37%), reducing gold’s opportunity cost and supporting its attractiveness.
Market pricing shows increasing odds of a Fed rate cut at next week’s FOMC meeting, something analysts like Christopher Waller suggested.
4. Geopolitical & Trade Risk Premiums
Escalating trade risk (tariffs looming) and geopolitical uncertainty are prompting safe-haven inflows into gold.
India’s MCX mirror those sentiments: gold rose ~0.5% on local contracts amid global trade nerviness.
To sum it up:
Gold is rallying today primarily because of the softer dollar, lower yields, and elevated trade risks ahead of the August 1 tariff deadline all of which reinforce its safe-haven allure.
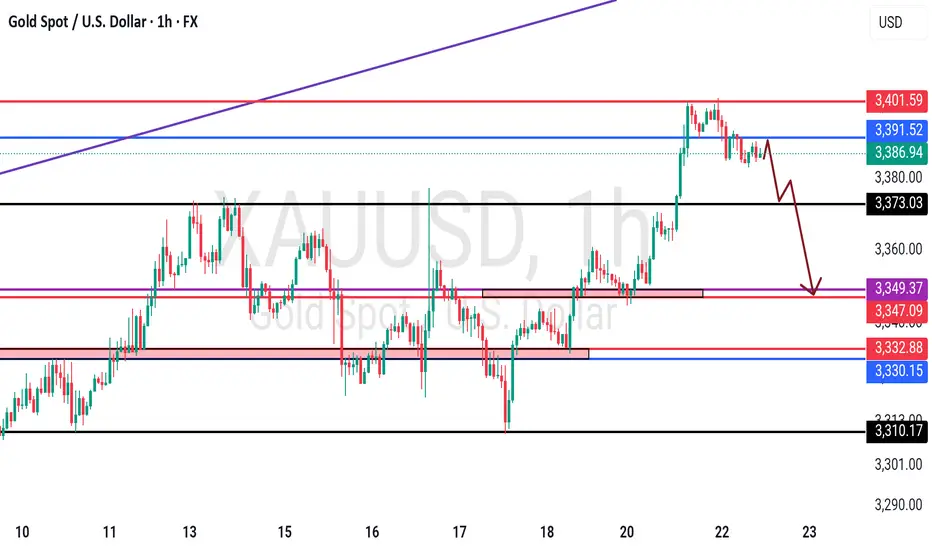
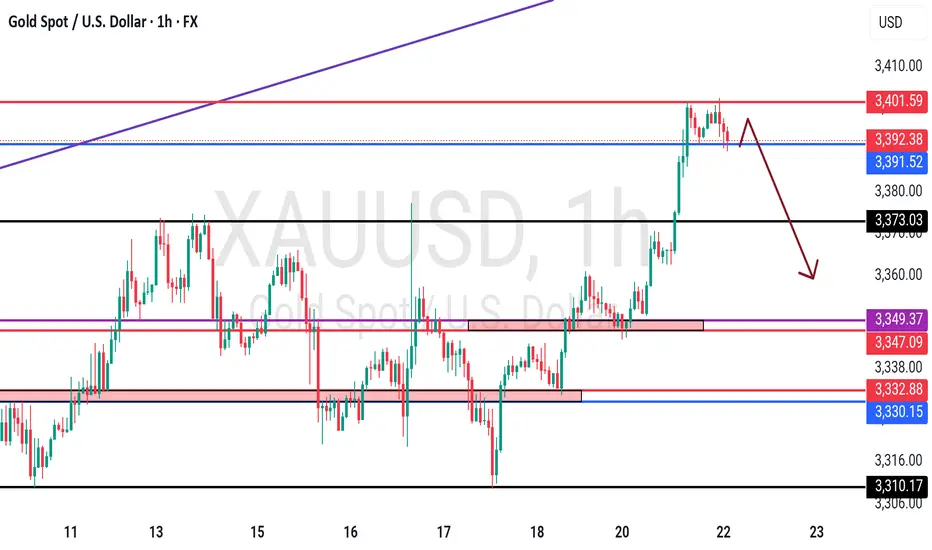
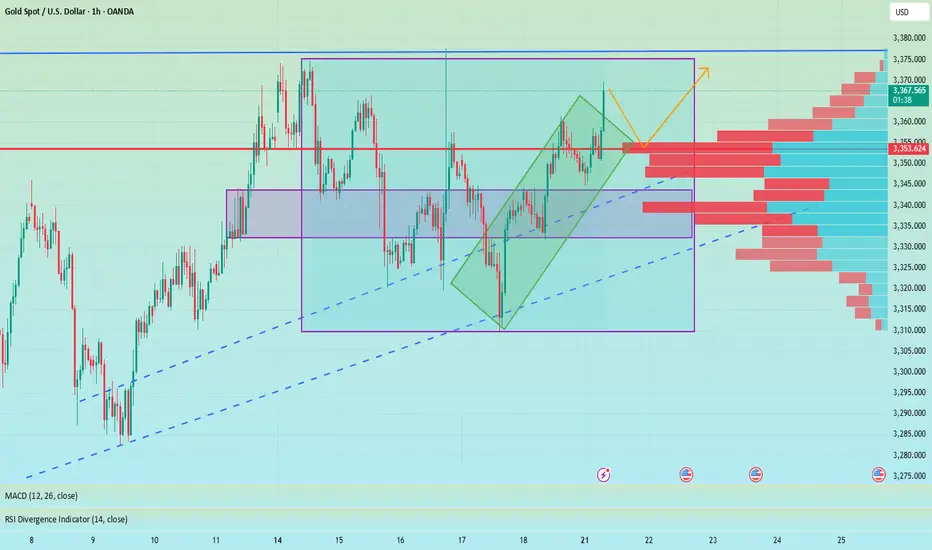
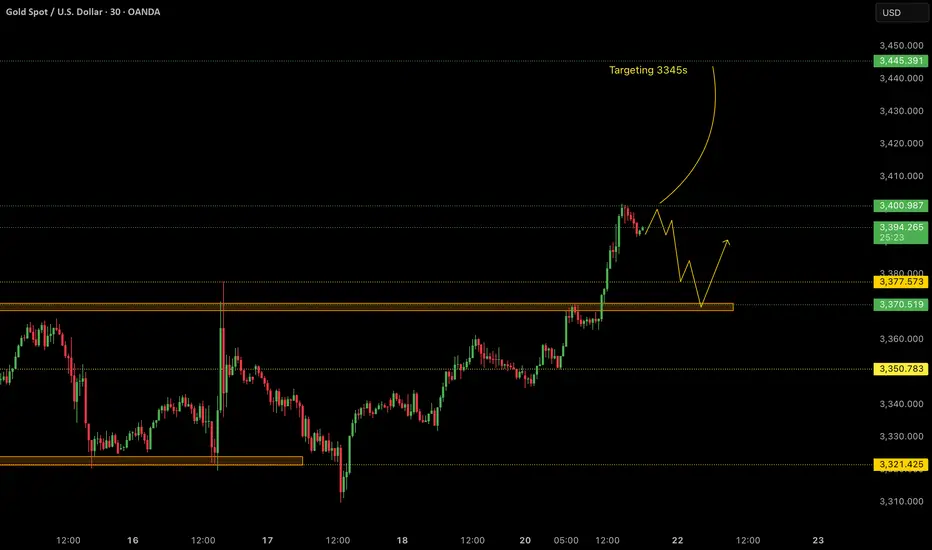
Trade Setup - Shorts; if we retest 3370s
- We would primarily look to enter into lower risk buys on gold at more preferable levels such as 3370. After breaking to the upside from the consolidation area, a pullback and a retest to that area would not be out of the ordinary.
Trade Setup - Buys; if we break above 3400
- In case of the dollar remaining soft, we can expect gold to continue its upside rally without any major pullbacks. In this case, we would be looking for the breaks of 3400 and continue to hold until around 3345s.
Key Notes:
- Softer Dollar
- Possible retest of 3370s
- Watch for potential breaks of 3400
This remains a tactically driven setup. Manage risk appropriately and stay alert for any renewed political developments.
Gold----Buy near 3344, target 3360-3377Gold market analysis:
Recently, the daily gold line has been switching back and forth. If you look at the daily line from around June 25 to around July 21, it is a large range of fluctuations, and there is no big change in structure. The weekly line has not run too far in the past three weeks, and it is also a small range of fluctuations. We need to adjust our thinking in time in operation. For example, the market from Thursday to Friday last week was a market with rapid conversion of buying and selling. We adjusted our thinking in time on Friday to make a profit from the bullish 3337 layout. Moreover, our analysis chart also clearly shows that gold has fallen back at 3357, and gold began to fall back at 3361. Today, we must buy at a low price to be bullish. 3377 is a hurdle on the daily line, and it is also a barrier that is difficult to cross for buying. If the highest position can be reached this week, it can be confirmed that it is a real buy. Otherwise, it is a daily line structure of fluctuations. The support of the weekly line this week is around 3308 and 3000. Only when this position is broken on the weekly line can the weekly selling position be confirmed. Otherwise, it depends on the daily line structural fluctuations of 3300-3377.
In the Asian session, we will first arrange long orders at the small support of 3344. The larger support is the 1-hour pattern support near 3331. In the Asian session, we must first look for opportunities to buy at low prices. If 3331 is broken directly, we have to think whether it is a volatile market again. The volatile market is repeated. Don't get on the bus in the middle position. We should grasp the rhythm more, so that we can get both buying and selling profits.
Support 3344 and 3331, pressure 3361 and 3377, the watershed of strength and weakness in the market is 3344.
Fundamental analysis:
Today is a holiday in Tokyo, Japan. In addition, there is no major data this week. We focus on the fundamentals. Trump's tariffs are still a focus.
Operation suggestions:
Gold----Buy near 3344, target 3360-3377

In-depth analysis of gold price trends this week!Market news:
During the Asian morning session on Monday (July 21), the London gold price rose slightly to above $3,350 and is currently trading around $3,356/ounce. The weakening dollar and continued geopolitical and economic uncertainties have boosted demand for safe-haven spot gold, supporting international gold prices, but the rebound in the University of Michigan survey index may limit gold's gains.Although gold prices may face correction pressure in the short term, international gold has limited room to fall. Factors such as economic slowdown, lower interest rates and rising inflation will attract more buyers to enter the market. The continued purchases by central banks over the past two and a half years have also provided solid support for gold prices. The tension between Trump and Powell is the main reason why gold prices remain high.Looking ahead, the market focus will shift to this week's ECB monetary policy meeting. Economists generally expect the ECB to keep interest rates unchanged, and preliminary manufacturing data released this week may also trigger some market fluctuations. This week's economic data and Fed dynamics will be key variables in the trend of gold prices. No matter how the market fluctuates, the long-term value of gold cannot be ignored, and investors need to pay close attention to macroeconomic changes and political events.
Technical Review:
Technically, the daily chart of gold still maintains the adjustment of the middle track of the Bollinger Band, forming a yin-yang alternating shock consolidation. However, on Friday, the gold price closed with a small positive K, and the price MA10/7-day moving average closed above 33/42. From the indicator point of view, the MACD indicator momentum column shortened, and the RSI indicator ran around 50, indicating that the market buying and selling forces were balanced.The 4-hour chart shows that the gold price fluctuated and tended to buy and consolidate at 3330-3360. At present, the moving average system opened upward. As long as gold does not lose 3320, it is expected to continue to sprint upward to 3375/3400. On the contrary, if it loses the support of 3320/10 again, it is regarded as a short-term weak shock downward. On the whole, the current trend of gold is oscillating and tending to buy and consolidate. Today's trading idea is mainly to buy at a low price and sell at a high price.
Today's analysis:
Since there is no major economic data this week, in the absence of geopolitical risks and emergencies, it is expected that gold will still see a small range of shocks and consolidation this week, and the range can be focused on 3400-3300. The daily Bollinger Bands continue to close, with the upper track at 3375 and the lower track at 3288. The short-term moving averages are intertwined near the middle track, suggesting that gold will still be dominated by fluctuations in the short term. In terms of operation, keep the idea of selling at high prices and buying at low prices. Do not chase the rise and sell at the fall. Wait for the breakthrough signal to be confirmed before following the trend. Today’s support is at 3340. You can use this as a key point to arrange buy orders during the day. The key point above is 3361, which is the high point of last Friday. 3361 is a short-term pressure point. If there is no correction today and it directly breaks 3361, we can follow the trend directly. If there is a correction, pay attention to the bottom structure above 3340 and buy at the bottom!
Operation ideas:
Buy short-term gold at 3340-3343, stop loss at 3332, target at 3370-3390;
Sell short-term gold at 3377-3380, stop loss at 3388, target at 3340-3320;
Key points:
First support level: 3340, second support level: 3332, third support level: 3320
First resistance level: 3375, second resistance level: 3388, third resistance level: 3410

GOLD - Lovers Elliott wave - looking strong Short/Medium termGOLD-----Daily counts indicate Excellent bullish wave structure.
Both appear to be optimistic and this stock invalidation number (S L) wave 2 low
target short / long term are already shared as per charts
correction wave leg seems completed (C)
Investing in declines is a smart move for short/ long-term players.
Buy in DIPS recommended
Long-term investors prepare for strong returns over the next two to five years.
one of best counter
Every graphic used to comprehend & LEARN & understand the theory of Elliot waves, Harmonic waves, Gann Theory, and Time theory
Every chart is for educational purposes.
We have no accountability for your profit or loss.

XAU/USD Start July 20251. i start after XAU/USD break previous High and correction (fibbo 32.0) respected. based on elliot wave strategy we can targeting end of wave 3 at 3353 area and than correction wave 4 (target at fibbo 32.0 - 50.0). after target correction, continue wave 5 at target 3403 area.
2. fundamentally speaking, new months new quarter. there ins't new catalist and sentiment. Macro Economic this week focus on labour market at US and FED projection to cut rate.
3. War at Iran and Israel, Russia and Ukraine, India and Pakistan, Trade War case, etc,.
4. Will be update

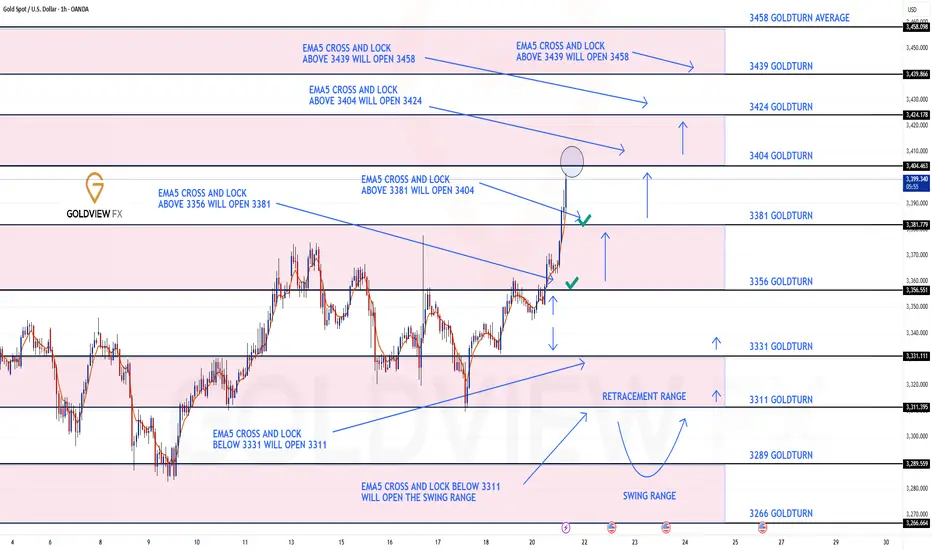
GOLD ROUTE MAP UPDATEHey Everyone,
Great start to the week with our chart idea playing out, as analysed.
We started with our Bullish target 3356 hit, followed with ema5 cross and lock above 3356 opening 3381. This was also hit perfectly completing this target. We now have a further ema5 cross and lock above 3381 leaving 3404 open with already a nice push up, just short of the full gap.
We will keep the above in mind when taking buys from dips. Our updated levels and weighted levels will allow us to track the movement down and then catch bounces up.
We will continue to buy dips using our support levels taking 20 to 40 pips. As stated before each of our level structures give 20 to 40 pip bounces, which is enough for a nice entry and exit. If you back test the levels we shared every week for the past 24 months, you can see how effectively they were used to trade with or against short/mid term swings and trends.
The swing range give bigger bounces then our weighted levels that's the difference between weighted levels and swing ranges.
BULLISH TARGET
3356 - DONE
EMA5 CROSS AND LOCK ABOVE 3356 WILL OPEN THE FOLLOWING BULLISH TARGETS
3381 - DONE
EMA5 CROSS AND LOCK ABOVE 3381 WILL OPEN THE FOLLOWING BULLISH TARGET
3404
EMA5 CROSS AND LOCK ABOVE 3404 WILL OPEN THE FOLLOWING BULLISH TARGET
3424
EMA5 CROSS AND LOCK ABOVE 3424 WILL OPEN THE FOLLOWING BULLISH TARGET
3458
BEARISH TARGETS
3331
EMA5 CROSS AND LOCK BELOW 3331 WILL OPEN THE FOLLOWING BEARISH TARGET
3311
EMA5 CROSS AND LOCK BELOW 3311 WILL OPEN THE SWING RANGE
3289
3266
As always, we will keep you all updated with regular updates throughout the week and how we manage the active ideas and setups. Thank you all for your likes, comments and follows, we really appreciate it!
Mr Gold
GoldViewFX
Ultra-short-term trading. Profit of $10/ounceThe order to buy XAUUSD successfully made a profit. The current gold price is 3367. Stimulated by the weekend news, the expected trend was achieved smoothly, and the short-term bulls were strong. Buying can continue to be the main focus. Relying on the half-hour and one-hour trends, trading can be carried out in the London market for the purpose of buying and profit. The increase is about $10/ounce.
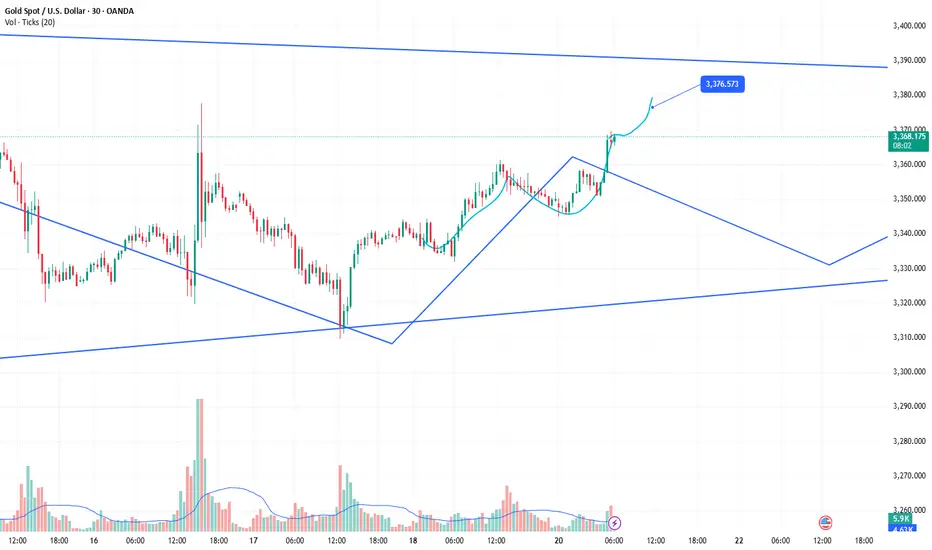
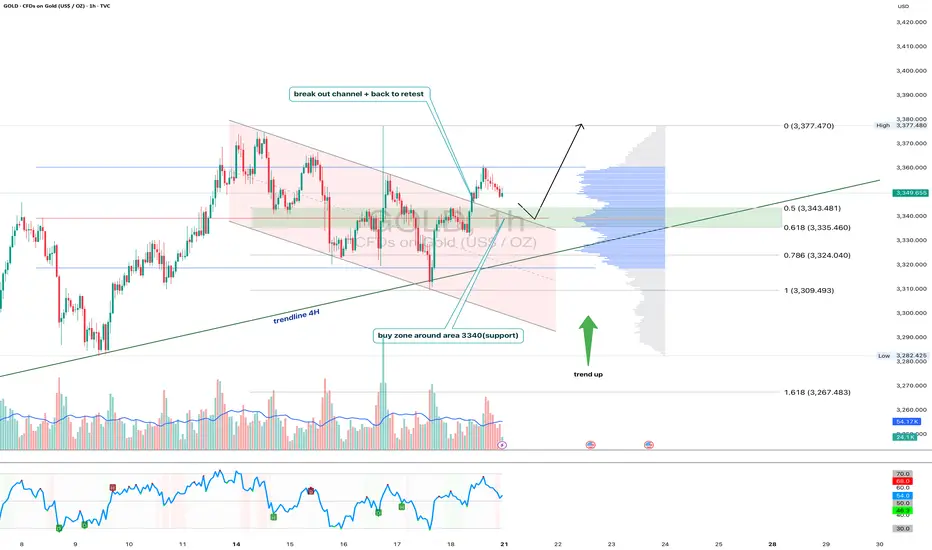
Gold 1H - Retest of channel & support zone at 3340After breaking out of the falling channel, gold is currently retesting its upper boundary — now acting as support. The 3340 zone is particularly important as it aligns with the 0.618 Fibonacci level and high volume node on the visible range volume profile. The price action suggests a potential bullish rejection from this area. With both the 50 and 200 EMA below price on the 1H, the short-term trend remains bullish. The 4H trendline further supports this setup. RSI is cooling off near the neutral zone, leaving room for another leg higher toward the 3377 resistance zone. If 3340 fails, 3324 (0.786 Fibo) becomes the next line of defense. Until then, the structure remains bullish following the successful breakout and retest of the channel.
Gold momentum is about to explode, is 3400 still far away?
💡Message Strategy
Gold prices rose as expected on Friday as a weaker dollar and continued geopolitical and economic uncertainty boosted demand for safe-haven gold. Spot gold rose 0.4% to $3,353.25 an ounce, down 1.1% in the previous session. U.S. gold futures also rose 0.4% to $3,359.70. Gold prices remained largely stable around $3,350 an ounce this week.
The trend of gold prices is currently mainly affected by the following three factors:
1. US economic data supports the US dollar
The latest US real estate data is generally positive, and building permits and new housing starts data are both above expectations. The recovery of the real estate market has reduced market concerns about economic recession, which has provided some support to the US dollar, thereby constituting a certain suppression on gold.
2. Fed policy differences trigger market games
Fed officials have obvious differences in their statements on monetary policy. Christopher Waller, a Fed governor, prefers to directly cut interest rates by 25 basis points in July, worried about economic slowdown and weak job market. San Francisco Fed President Daly believes that two interest rate cuts in 2025 are "reasonable", but is wary of the impact of excessive tightening policies on the job market.
On the contrary, Fed Governor Kugler is more hawkish, believing that recent tariffs have been transmitted to consumer prices, and high interest rates should continue to be maintained, and it is not appropriate to cut interest rates for the time being. The existence of differences has caused market expectations to waver, and gold has fallen into consolidation.
3. Inflation expectations determine the medium-term direction of gold prices
The June CPI data from the United States showed signs of rising inflation, which may cause the Federal Reserve to postpone the pace of interest rate cuts.
📊Technical aspects
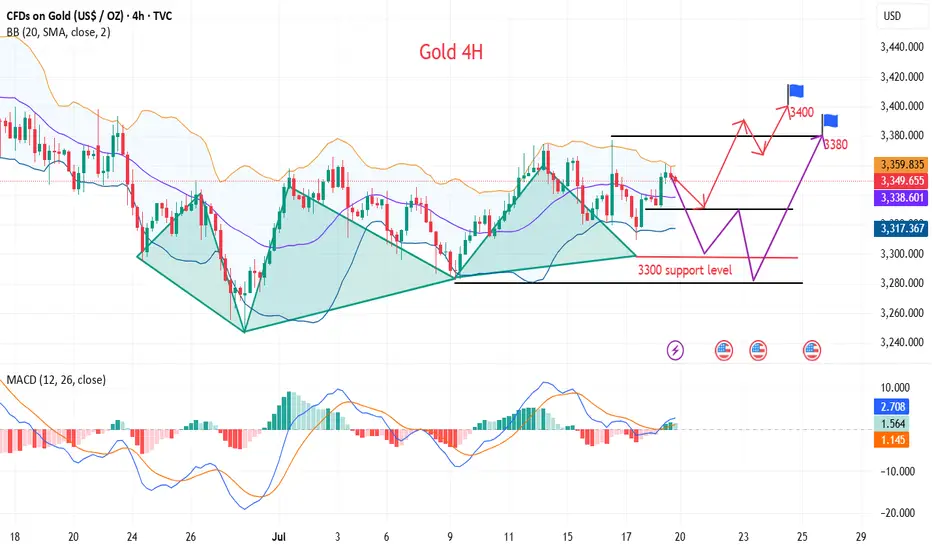
From the 4H chart, gold is currently oscillating in an obvious symmetrical triangle, forming a consolidation pattern in the short term.
Bollinger Band indicator: The middle track of the Bollinger Band is at $3345, the upper track is at $3405, and the lower track is at $3280. The current price is running near the middle track, indicating that volatility is converging and there is an expectation that a direction will be chosen soon.
Support and resistance: The current key support level is $3,280; short-term support is 3,300, and the upper resistance is $3,380. After breaking through, it is expected to test the previous highs of $3,451 and $3,499.
MACD indicator: The MACD histogram is gradually converging, and the DIFF line (3.19) and the DEA line (1.91) are in a sticky state, indicating that the momentum is exhausted and the probability of short-term shocks is high, but once the volume breaks through, the trend may form quickly.
RSI indicator: The RSI indicator is currently at 53.64, which is in the neutral area and has not entered the overbought or oversold area, indicating that the market is still waiting for new direction signals.
Overall, the analysis believes that gold is at the end of a symmetrical triangle, and the technical side shows that it is about to face a breakthrough. The direction choice may appear tonight or early next week, and the idea is still mainly low-level bulls.
💰Strategy Package
Long Position:3320-3330,SL:3300,Target: 3370-80,3400
Gold is waiting for a pullback to break through 3400In the short term, gold is stuck in a sideways trend near 3365. It is not recommended to enter this point regardless of long or short positions. It is expected that there will be certain variables in the NY period. If gold retreats and falls in the short term as we expect, it may first touch around 3361. If it falls below 3361, it is expected to touch around 3353, which is also the point I gave this morning to see support.
Judging from the market, our focus on the upper side is still the 3375-3385 resistance area. If it can be effectively broken through, it is expected to hit the 3400-3420 mark. Although the daily MACD is oscillating near the zero axis, the 4H market shows that the oscillation is strong. Our trading strategy remains unchanged in the short term. The pullback in the NY period provides an opportunity, and we can consider going long. If there is new news during the day that requires adjustment, I will notify you immediately. Bros, please be patient and wait for trading opportunities.
OANDA:XAUUSD

GBPAUD's wide trading range remains intact✏️GBPAUD is trading in a wide range. After the increase on Friday, the pair is retesting the support zone breaking past resistance. And the current reaction point also coincides with the 20 SMA. There is not much momentum for the pair to break out of the wide trading range, so buying the pair to the upper range of 2.097 is a reasonable choice at the moment.
📉 Key Levels
Support: 2.058
Resistance: 2.083-2.096
BUY Trigger: Confirmed bounce from 2.059 (EMA support)
Target 2.09600
BUY DCA Trigger: Break 2.083
Leave your comments on the idea. I am happy to read your views.
