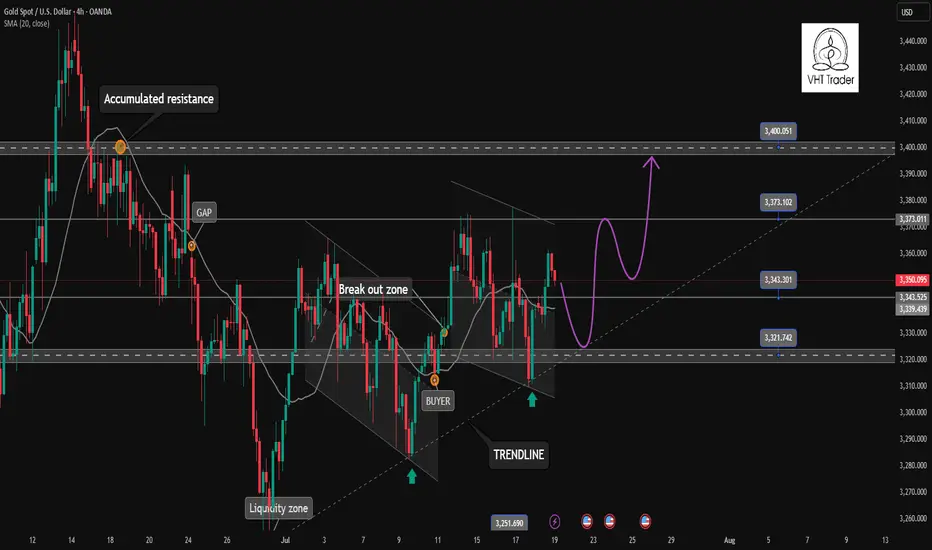
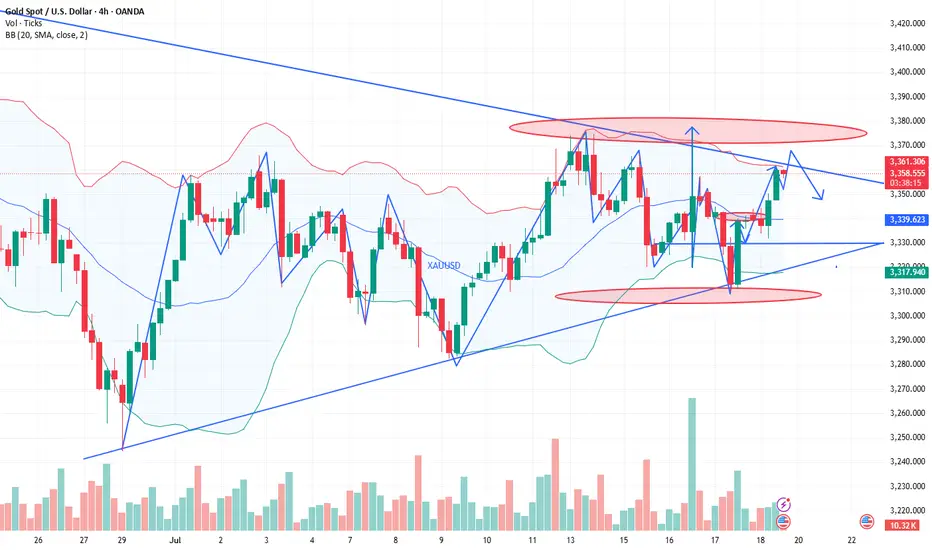
Gold returns to its original nature. Price increase towards 3400✏️ OANDA:XAUUSD is back to its inherent uptrend. Currently trading in a wide range. Shaped by CPI news last week. Trendline is still supporting Gold price towards 3400 next week. Pay attention to the important zone 3373 to DCA BUY and do not SELL when breaking this important zone 3373. Effective trading strategy is to wait for Gold to correct and buy.
📉 Key Levels
Support: 3343 - 3322
Resistance: 3373-3400
Buy Trigger: Rejects the support zone 3343 and reacts to the upside
Buy Trigger: Rebound from 3322
Target 3400
Leave your comments on the idea. I am happy to read your views.
Goldprediction
Gold Price Analysis July 21After being reinforced by CPI data last week, gold prices have regained their bullish momentum and are currently trading in a wide range. The technical structure still shows a dominant uptrend, with the trendline continuing to act as reliable support, targeting the important resistance zone of 3400 next week.
📌 Preferred trading strategy:
Watch the price reaction around the support zone of 3343. If there is a rejection signal of this zone accompanied by buying pressure, that will be the ideal entry point.
If the price continues to correct deeper, the strong support zone of 3322 will be a reasonable DCA point.
It is not recommended to SELL if the price breaks the confluence zone of 3373, as this is a signal confirming the strong bullish momentum continues.
📍 Important price zones:
Support: 3343 – 3322
Resistance: 3373 – 3400
🚀 Buy Trigger:
Price rejects 3343 zone with clear bullish signal
Strong bounce from 3322 zone
Monday market forecast, pay attention to the 3339 retracement📰 News information:
1. The Trump administration puts pressure on the Federal Reserve to cut interest rates
2. The continued impact of tariffs and the responses of various countries
📈 Technical Analysis:
This week's basic judgment and forecast on the gold market trend were consistent, but on Friday, the overall gold fluctuations were not large. The overall trend of the daily line fluctuated around 3345, and the 3345 line also became a short-term long-short watershed. Although prices are likely to rise more easily than fall in the short term, it should be noted that the three-month adjustment cycle is coming to an end while the fundamentals of the bull market have not changed. It is recommended that you focus on preventing risks from short position operations next week. At the same time, the overall strong shock pattern, the anti-pulling momentum has not reached the top suppression position, and the area around 3339 below is the previous intensive trading area, which constitutes a certain support in the short term. If the market fails to effectively break below next week, it will greatly boost the bullish momentum, and it is not ruled out that there will be a possibility of refreshing the high point near 3380 next week.
On the whole, the short-term focus next week is the 3345-3335 area below. If it falls back to this point, you can consider arranging long orders. The short-term target is 3355-3365, and the strong trend is expected to continue to touch 3375-3385.
🎯 Trading Points:
BUY 3345-3335
TP 3355-3365-3375-3385
In addition to investment, life also includes poetry, distant places, and Allen. Facing the market is actually facing yourself, correcting your shortcomings, confronting your mistakes, and strictly disciplining yourself. I hope my analysis can help you🌐.
TVC:GOLD PEPPERSTONE:XAUUSD FOREXCOM:XAUUSD FX:XAUUSD OANDA:XAUUSD FXOPEN:XAUUSD

GOLDGOLD needs some more upside, reaction zone is 3380-3395, will see how gold reacts at that level.
Disclosure: We are part of Trade Nation's Influencer program and receive a monthly fee for using their TradingView charts in our analysis.

Gold market directional biasGold currently in a balance sentiment. Now it continues buy rally. In cot report there is still chance of buy rally. but in the upper side there should be a strong sell zone. we have to prepare for this also.

Analysis of gold market operation strategies and market trends n
Remember not to act on impulse when trading. The market is a place where you can deal with all kinds of dissatisfaction, so you must not hold orders. I believe many people have experienced this. The more you resist, the more panic you will feel. The floating losses will continue to magnify, and you will not be able to eat or sleep well, and you will miss many opportunities in vain. If you also have these troubles, then you might as well follow my pace and try to see if it can make you suddenly enlightened. If you need help, I will always be here, but if you don't even extend your hand, how can I help you?
The trend of gold on Friday was mainly oscillating upward. It can be said that gold on Friday was a volatile market, closing at 3350. If there is no stimulation from international news over the weekend, we will continue to be bullish next week. If your current gold operation is not ideal, I hope I can help you avoid detours in your investment. Welcome to communicate with us!
From the 4-hour analysis, the short-term support below continues to focus on the vicinity of 3340-45, the strong support is at the 3310 mark, and the key pressure above focuses on the 3380 line. First, rely on this range to maintain the main tone of high-altitude low-multiple cycles. In the middle position, watch more and do less, be cautious in chasing orders, and wait patiently for key points to enter the market.
Gold operation strategy:
Gold goes long when it falls back to the 3335-43 line, and covers long positions when it falls back to the 3320-25 line, stop loss at 3313, target 3370-75 line, and continue to hold if it breaks;

GOLD 1H CHART ROUTE MAP UPDATE & TRADING PLAN FOR THE WEEKHey Everyone,
Please see our updated 1h chart levels and targets for the coming week.
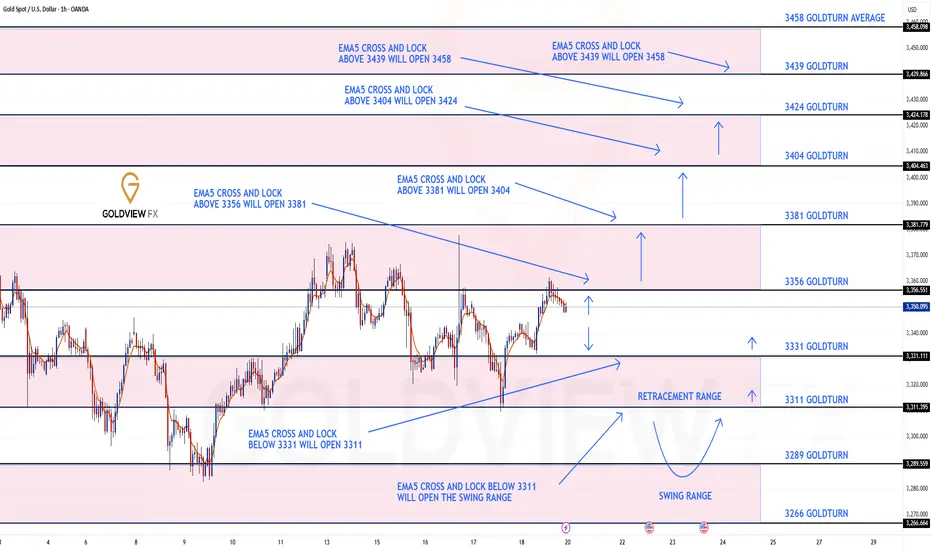
We are seeing price play between two weighted levels with a gap above at 3356 and a gap below at 3331. We will need to see ema5 cross and lock on either weighted level to determine the next range.
We will see levels tested side by side until one of the weighted levels break and lock to confirm direction for the next range.
We will keep the above in mind when taking buys from dips. Our updated levels and weighted levels will allow us to track the movement down and then catch bounces up.
We will continue to buy dips using our support levels taking 20 to 40 pips. As stated before each of our level structures give 20 to 40 pip bounces, which is enough for a nice entry and exit. If you back test the levels we shared every week for the past 24 months, you can see how effectively they were used to trade with or against short/mid term swings and trends.
The swing range give bigger bounces then our weighted levels that's the difference between weighted levels and swing ranges.
BULLISH TARGET
3356
EMA5 CROSS AND LOCK ABOVE 3356 WILL OPEN THE FOLLOWING BULLISH TARGETS
3381
EMA5 CROSS AND LOCK ABOVE 3381 WILL OPEN THE FOLLOWING BULLISH TARGET
3404
EMA5 CROSS AND LOCK ABOVE 3404 WILL OPEN THE FOLLOWING BULLISH TARGET
3424
EMA5 CROSS AND LOCK ABOVE 3424 WILL OPEN THE FOLLOWING BULLISH TARGET
3458
BEARISH TARGETS
3331
EMA5 CROSS AND LOCK BELOW 3331 WILL OPEN THE FOLLOWING BEARISH TARGET
3311
EMA5 CROSS AND LOCK BELOW 3311 WILL OPEN THE SWING RANGE
3289
3266
As always, we will keep you all updated with regular updates throughout the week and how we manage the active ideas and setups. Thank you all for your likes, comments and follows, we really appreciate it!
Mr Gold
GoldViewFX
GOLD 4H CHART ROUTE MAP UPDATE & TRADING PLAN FOR THE WEEKHey Everyone,
Please see our updated 4h chart levels and targets for the coming week.
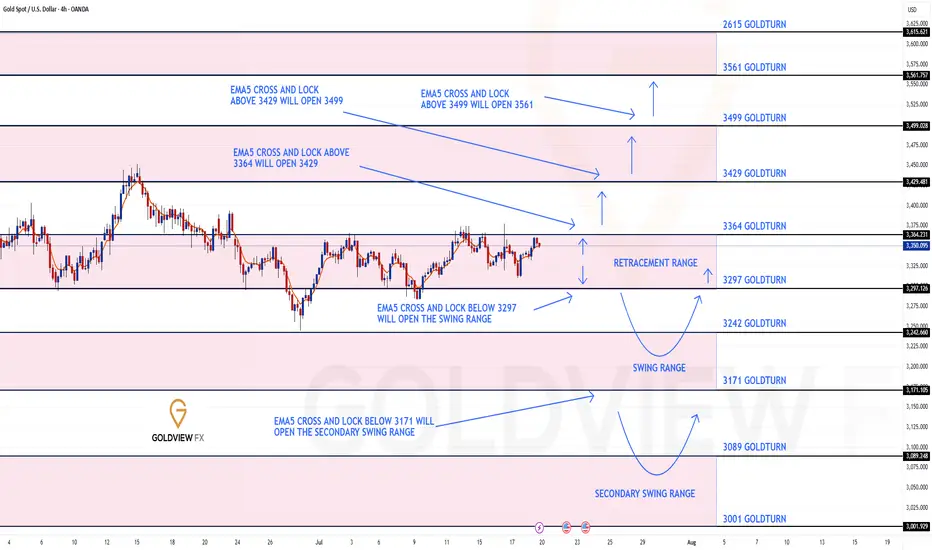
We are seeing price play between two weighted levels with a gap above at 3364 and a gap below at 3297. We will need to see ema5 cross and lock on either weighted level to determine the next range.
We will see levels tested side by side until one of the weighted levels break and lock to confirm direction for the next range.
We will keep the above in mind when taking buys from dips. Our updated levels and weighted levels will allow us to track the movement down and then catch bounces up.
We will continue to buy dips using our support levels taking 20 to 40 pips. As stated before each of our level structures give 20 to 40 pip bounces, which is enough for a nice entry and exit. If you back test the levels we shared every week for the past 24 months, you can see how effectively they were used to trade with or against short/mid term swings and trends.
The swing range give bigger bounces then our weighted levels that's the difference between weighted levels and swing ranges.
BULLISH TARGET
3364
EMA5 CROSS AND LOCK ABOVE 3364 WILL OPEN THE FOLLOWING BULLISH TARGETS
3429
EMA5 CROSS AND LOCK ABOVE 3429 WILL OPEN THE FOLLOWING BULLISH TARGET
3499
EMA5 CROSS AND LOCK ABOVE 3499 WILL OPEN THE FOLLOWING BULLISH TARGET
3561
BEARISH TARGETS
3297
EMA5 CROSS AND LOCK BELOW 3297 WILL OPEN THE SWING RANGE
3242
3171
EMA5 CROSS AND LOCK BELOW 3171 WILL OPEN THE SECONDARY SWING RANGE
3089
3001
As always, we will keep you all updated with regular updates throughout the week and how we manage the active ideas and setups. Thank you all for your likes, comments and follows, we really appreciate it!
Mr Gold
GoldViewFX
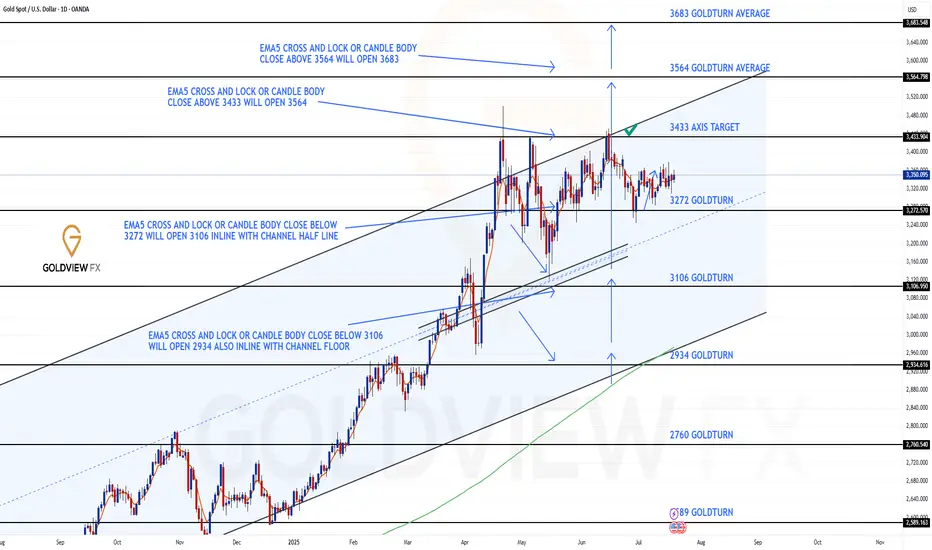
GOLD DAILY CHART ROUTE MAPHey Everyone,
Daily Chart Follow-Up – Structure Still in Full Control
Just a quick update on our daily structure roadmap. Price continues to respect our Goldturn levels with surgical precision.
After the previous bounce off 3272, we saw over 800 pips of upside follow through. That level once again proved its weight, holding beautifully as support and launching price firmly back toward the upper boundary.
Since last week’s update, nothing has changed structurally – the range remains intact and fully respected. Price is still trading between the well defined 3272 support and the untested 3433 resistance. We’ve yet to revisit 3433, which remains our key upside target and a potential inflection point.
Here’s what we’re focusing on next:
🔹 Range scenario active:
Until price breaks out cleanly, we anticipate continued swings between 3433 resistance and 3272 support. This remains the active range setup.
🔹 EMA5 cross and lock:
We’re still watching for a decisive EMA5 break and lock. Without that, we expect more range-bound action rather than a breakout.
🔹 Structure remains intact:
No EMA5 breakdown off 3272 during the recent retest means buyers are still in control. Dips into 3272 remain valid long entries within this structure.
Key Levels This Week
📉 Support – 3272
Proven bounce zone. Continues to hold structure. As long as this holds, the bias remains constructive.
📈 Resistance – 3433
Open gap + channel top confluence. Still untested. Watching for a reaction or breakout confirmation here.
Thanks again for all the continued support, your likes, comments, and follows mean the world.
Wishing you another focused and profitable week ahead!
Mr Gold
GoldViewFX
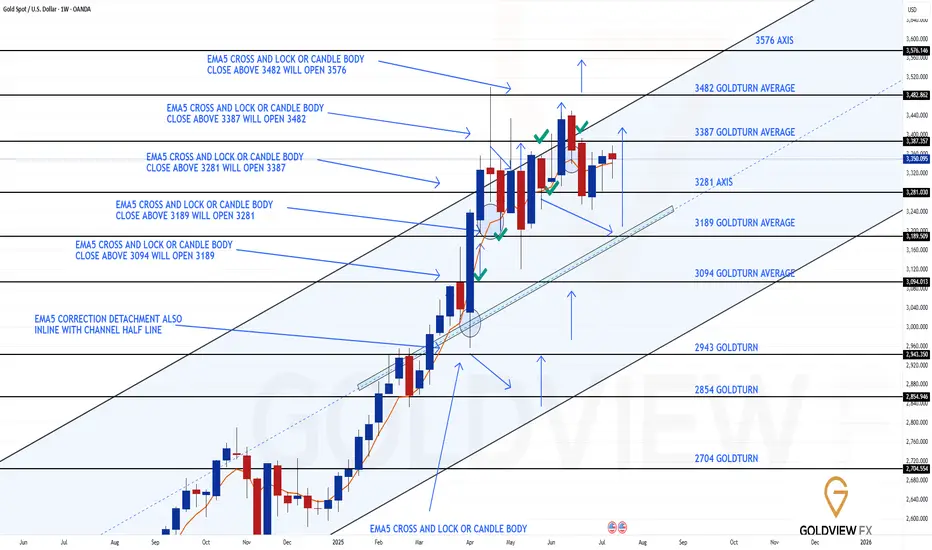
GOLD WEEKLY CHART MID/LONG TERM ROUTE MAPHey Everyone,
Please see update on our Weekly Chart idea.
As of now, nothing has changed structurally, the framework remains fully intact, and price continues to trade cleanly within the defined range.
After delivering a rejection at the channel top, price pulled back into 3281 support, where buyers once again stepped in decisively. That level held firm on a weekly closing basis, validating it as a reliable pivot and launching price back into bounce mode.
Despite the progress, we’ve yet to test the 3387 gap, which continues to act as a short term magnet. The longer range gap at 3482 also remains open and in focus as the larger objective.
Key takeaways from the current structure:
🔹 Structure unchanged:
The rising channel remains orderly. EMA5 still hasn’t locked bearishly, and the mid-line continues to climb beneath price, maintaining a constructive bias.
🔹 Support confirmed – 3281:
Held for a second time, reaffirming its significance in the broader structure.
🔹 3387 gap still in play:
While price is gravitating toward this zone, it has not yet been tested. Expect a reaction on first contact.
Updated Levels to Watch:
📉 Immediate Support – 3281
Held again, reinforcing its status as the key structural axis.
📈 Resistance 1 – 3387
Still untested. Remains the active near term target.
📈 Resistance 2 – 3482
Unfilled weekly gap and broader objective.
Plan:
As long as 3281 continues to hold, the bias remains for a measured grind higher toward 3387 and, eventually, 3482. If 3281 fails, we’ll reassess at the rising mid line for the next structured long opportunity.
As always, we will keep you all updated with regular updates throughout the week and how we manage the active ideas and setups. Thank you all for your likes, comments and follows, we really appreciate it!
Mr Gold
GoldViewFX
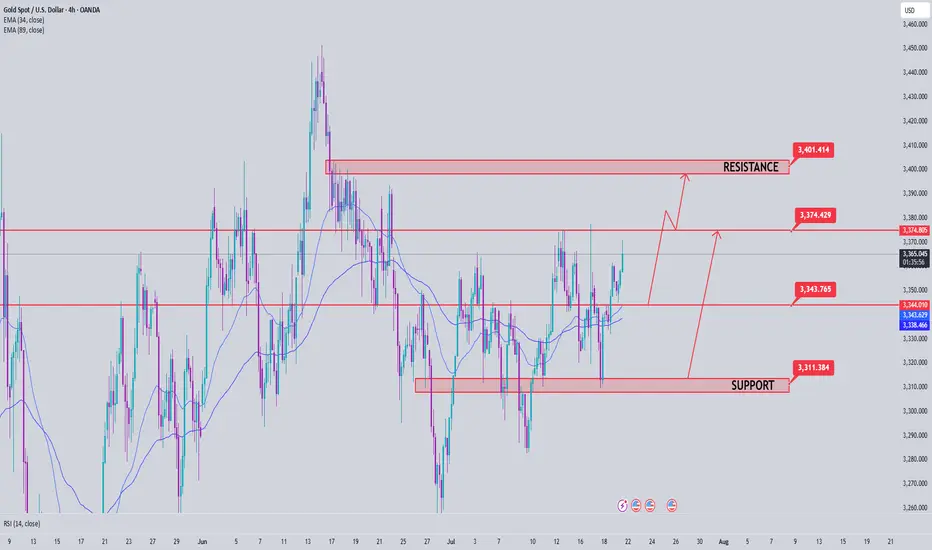
Gold breaks trendline and returns to uptrend. BUY NOW!✏️ OANDA:XAUUSD A deep sweep to 3310 and bounce back to the trading range. Gold is reacting at the Trendline around the price zone of 3344. This is an important price zone that if broken will return to the uptrend and head towards 3373 soon. 3332 plays an important role in the current bullish wave structure, which is a suitable SL placement point for BUY signals.
📉 Key Levels
Support: 3332-3312
Resistance: 3344-3357-3373-3389
BUY trigger: Break and trading above Resistance 3344 (trendline, top uptrend wave 1)
BUY DCA trigger: Break Resistance 3353
Target 3373
Leave your comments on the idea. I am happy to read your views.

Trapped orderflow. Gold Weekly Outlook. 19.07.2025,SaturdayExpecting a range bound market condition until any one of the VI on the weekly inverse. Trapped Orderflow

Double Top + Zigzag Complete: Are Bears About to Take Over Gold?Yesterday, the financial markets in general, including Gold ( OANDA:XAUUSD ) , acted like a roller coaster after the news of Powell's dismissal . After this news was denied , Gold returned to its main trend, which I published in my previous idea .
Gold is currently re-attacking the Support line , Support zone($3,326-$3,325) and 50_SMA(Daily) .
In terms of classic technical analysis , it seems that gold has formed a Double Top Pattern for support breakdowns, where a Support line breakdown can also be accompanied by a neckline breakdown .
From the perspective of Elliott Wave theory , it seems that Gold has managed to complete the Zigzag Correction(ABC/5-3-5) , and we should wait for the next bearish waves .
I expect Gold to break its supports and move towards $3,290 ; support breaks are best done with high momentum . An important price that can change the direction of Gold's downside is $3,350 .
Note: If Gold breaks the Resistance lines and forms an hourly candle above $3,351(Stop Loss (SL)), we can expect further Gold gains.
Gold Analyze (XAUUSD), 2-hour time frame.
Be sure to follow the updated ideas.
Do not forget to put a Stop loss for your positions (For every position you want to open).
Please follow your strategy; this is just my idea, and I will gladly see your ideas in this post.
Please do not forget the ✅ ' like ' ✅ button 🙏😊 & Share it with your friends; thanks, and Trade safe.

How to operate the gold market opening next MondayAnalysis of gold market trends next week:
Analysis of gold news: Spot gold fluctuated and rose in a narrow range during the U.S. market on Friday (July 18), and is currently trading around $3,354.05 per ounce. On Thursday, spot gold staged a thrilling "deep V" market. Under the dual stimulation of the U.S. retail sales data in June exceeding expectations by 0.6% and the number of initial jobless claims falling to 221,000, the U.S. dollar index once soared to a monthly high of 98.95, instantly suppressing spot gold to an intraday low of $3,309.82 per ounce. But surprisingly, the gold price then rebounded strongly and finally closed at $3,338.86, down only 0.25%. This "fake fall" market reveals the deep contradictions in the current market-although economic data temporarily supports the strengthening of the U.S. dollar, investors' concerns about inflation caused by tariffs are forming a "hidden buying" of gold. The joint rise of the U.S. dollar and U.S. bond yields did suppress gold prices, but strong takeover orders emerged in each falling window. Behind this phenomenon, smart money is quietly making plans. When the 10-year U.S. Treasury yield climbed to a monthly high of 4.495%, gold refused to fall further. This divergence suggests that the market has serious differences on the direction of the Fed's policy.
Technical analysis of gold: After the opening yesterday, gold continued to fall slowly, and the negative impact of the unemployment data in the U.S. market further suppressed the bullish momentum. The lowest price in the U.S. market reached 3310, and the cumulative decline for the whole day exceeded 30 US dollars. But the key is that gold rebounded again at midnight, forming a wide range of fluctuations on Thursday, which was completely in line with expectations. The 3310 bottom-picking and long-term strategy given during the session successfully captured large profits in the band. This trend once again verified the core judgment of this week: gold is in a high-level fluctuation dominated by a bullish trend, and the practical value of this view continues to highlight. After clarifying the current dual attributes of "bullish trend + volatile trend", Friday's trading needs to focus on the effective profit space within the range. It is expected that the 3375-3310 large range will be difficult to break this week, and the small range can be locked at 3355-3320. Before the range is broken, high-selling and low-buying operations can be performed.
.
The technical side shows that the daily line and the 4-hour Bollinger Bands are closed synchronously. At this time, there is no need to worry about the direction, and effective trading can be achieved by keeping a close eye on the range boundary. It is worth noting that the 4-hour moving average system has obvious upward divergence characteristics. Continuing the rebound momentum at midnight on Thursday, gold still has room to rise today, and the upper target is 3360-3365. The small cycle support is clear: 3330 and 3320 are not broken, both are good opportunities for long positions. During the US trading session, it is necessary to pay attention to the breaking of the 3365 and 3375 resistance levels: if the pressure is not broken, there will be room for a decline, and short-term short positions can be tried. On the whole, Charlie suggests that the short-term operation strategy for gold next week should focus on buying on pullbacks and buying on dips, supplemented by rebounds and selling on highs. The short-term focus on the upper side is the 3375-3385 line of resistance, and the short-term focus on the lower side is the 3340-3330 line of support. FX:XAUUSD ACTIVTRADES:GOLD VANTAGE:XAUUSD TVC:GOLD ICMARKETS:XAUUSD CMCMARKETS:GOLD SAXO:XAUUSD

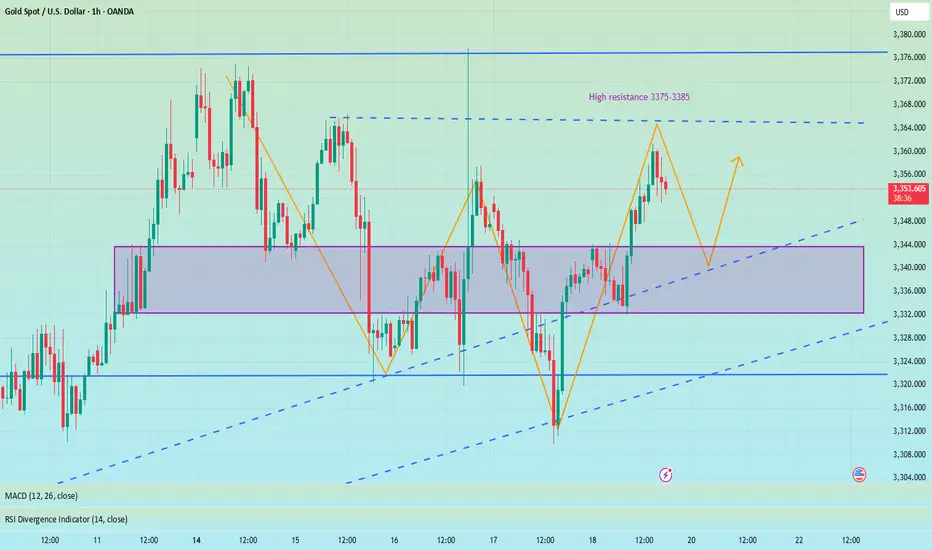
Long and short fluctuations, the market is waiting for a break📰 News information:
1. Powell responds to White House issues
2. Will other countries impose reciprocal sanctions on tariffs?
📈 Technical Analysis:
Although the MACD indicator of the gold hourly line formed a golden cross, the market reached a high of around 3361, and the RSI indicator was close to the overbought area, so we need to be cautious about corrections. From the 4H chart, the MACD second golden cross is on the zero axis. Currently, we are paying attention to the moving average SMA5 near 3343, and the SMA60 support line 3332. If the 4H upward trend falls back, we need to go long. At present, gold is still running above, and there is no good participation point in the short term, but on the whole, we should pay attention to the support of 3345-3332 below, and we can consider going long if it retreats and stabilizes. We continue to pay attention to the resistance pressure of 3375-3385 above, and we can try to go short if it does not break.
🎯 Trading Points:
SELL 3375-3385
TP 3365-3355
BUY 3345-3332
TP 3365-3375-3385
In addition to investment, life also includes poetry, distant places, and Allen. Facing the market is actually facing yourself, correcting your shortcomings, facing your mistakes, and exercising strict self-discipline. I share free trading strategies and analysis ideas every day for reference by brothers. I hope my analysis can help you.
FXOPEN:XAUUSD OANDA:XAUUSD FX:XAUUSD FOREXCOM:XAUUSD PEPPERSTONE:XAUUSD TVC:GOLD
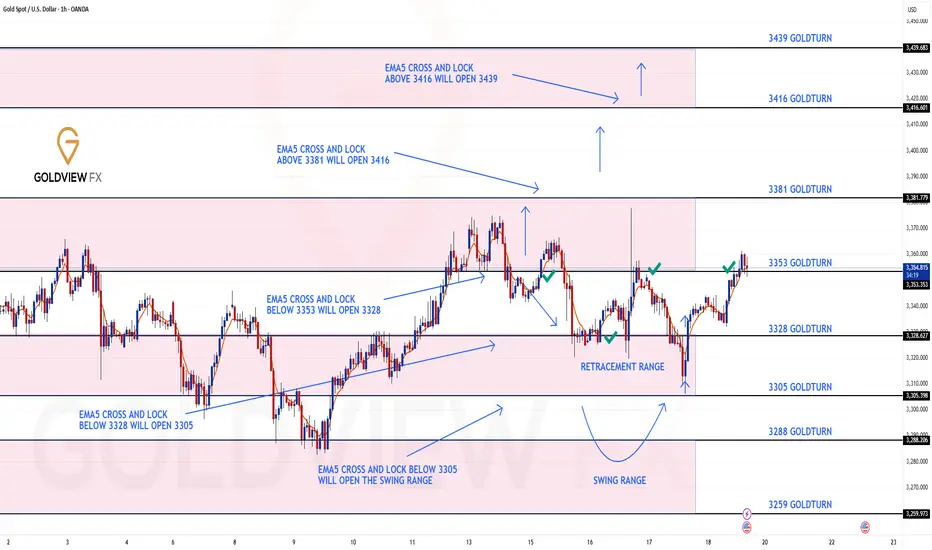
GOLD ROUTE MAP UPDATEHey Everyone,
End of week update following up on yesterday’s 1H chart outlook.
✅ 3353 was hit and respected to the pip, just as we mapped out and highlighted yesterday.
We saw the EMA5 cross and lock above 3328, confirming continuation.
The market respected structure beautifully
Rejections gave us clean dip buying entries
EMA5 methodology guided our execution
High probability Goldturn levels played out exactly as planned
Our discipline and patience were rewarded, yet again. Another strong end to the week.
We will now come back Sunday with a full multi timeframe analysis to prepare for next week’s setups, including updated views on the higher timeframes, EMA alignments, and structure expectations going forward.
Thanks again for all your likes, comments, and follows.
Wishing you all a fantastic weekend!!
Mr Gold
GoldViewFX
The short-selling idea remains unchanged, defend 3355📰 News information:
1. Powell responds to White House issues
2. Will other countries impose reciprocal sanctions on tariffs?
📈 Technical Analysis:
Gold closed with a long lower shadow on the daily line yesterday and closed with a doji on the hourly line. In the short term, gold may continue to rise and is expected to touch the 3355 line. If gold cannot break through and stabilize above 3355, then gold may fall back. We can still consider shorting, and the target can be 3330. If the trend is as expected, it may form the embryonic form of a head and shoulders bottom. On the contrary, if the gold price breaks through 3355, stop loss on short positions and pay attention to the high resistance of 3375-3385.
🎯 Trading Points:
SELL 3340-3355
TP 3330-3320
In addition to investment, life also includes poetry, distant places, and Allen. Facing the market is actually facing yourself, correcting your shortcomings, facing your mistakes, and exercising strict self-discipline. I share free trading strategies and analysis ideas every day for reference by brothers. I hope my analysis can help you.
TVC:GOLD PEPPERSTONE:XAUUSD FOREXCOM:XAUUSD FX:XAUUSD OANDA:XAUUSD FXOPEN:XAUUSD

Gold trend analysis and latest exclusive operation suggestionsTechnical analysis of gold: After the opening yesterday, gold continued to fall slowly. The negative impact of unemployment data in the US market further suppressed the bullish momentum. The lowest price in the US market reached 3310, and the cumulative decline for the whole day exceeded 30 US dollars. But the key is that gold in the New York market rebounded again, forming a wide range of fluctuations on Thursday, which was completely in line with expectations. The 3310 bottom-picking and long-term strategy given during the session successfully captured large profits in the band. This trend once again verified the core judgment of this week: gold is in a high-level fluctuation dominated by the bullish trend, and the practical value of this view continues to highlight. After clarifying the current dual attributes of "bullish trend + oscillating trend", Friday's trading needs to focus on the effective profit space within the range. It is expected that the 3375-3310 large range will be difficult to break during the day this week, and the small range can be locked at 3355-3320. The high-selling and low-buying operations can be performed before the range is broken.
The technical side shows that the daily line and the 4-hour period Bollinger band are closed simultaneously. At this time, there is no need to worry about the direction, and effective trading can be achieved by keeping a close eye on the range boundary. It is worth noting that the 4-hour moving average system has obvious upward divergence characteristics. Continuing the rebound momentum of the New York market on Thursday, gold still has room to rise today, and the upper target is 3360-3365. The small cycle support is clear: 3330 and 3320 are not broken, both are good opportunities for long positions. During the US trading period, we need to pay attention to the breaking of the 3365 and 3375 resistance levels: if they are under pressure and not broken, there will be room for a fall, and you can try short-term shorting. Overall, Charlie recommends that the short-term operation strategy for gold today is mainly to step on the low and long, supplemented by the rebound high. The short-term focus on the upper side is the 3375-3385 resistance, and the short-term focus on the lower side is the 3345-3335 support. PEPPERSTONE:XAUUSD VELOCITY:GOLD EIGHTCAP:XAUUSD ACTIVTRADES:GOLD EIGHTCAP:XAUUSD CMCMARKETS:GOLD EIGHTCAP:XAUUSD
Bottom-out rebound, 3338 short orders enteredYesterday, the gold market was affected by Trump's remarks about firing Federal Reserve Chairman Powell. After briefly falling below 3320, the price quickly rose by nearly 60 points, reaching a high of 3377. Trump later clarified that the news was false, triggering a gold sell-off, and the market rose and fell. As of Thursday's European session, gold prices fell back to around 3320. After a rapid rise and fall in the US market on Wednesday, the downward trend continued on Thursday, with the US market hitting a low of 3310 before rebounding. Judging from the 4-hour chart, the Bollinger Bands failed to open downward, indicating that the current market lacks continuity and the overall market remains in a volatile pattern. In a volatile market, it is recommended to pay attention to key support and resistance levels for high-selling and low-buying operations. The upper resistance range is currently at 3343-3351, and the important watershed support level below is at 3310.
OANDA:XAUUSD

Xauusd Bullish 18 July 2025 $4085 Prediction📍Kuala Lumpur, Malaysia – 18 July 2025
GOLD (XAUUSD) INSIGHT – First Accumulation Entry Begins
Today marks the first leg of bullish territory for Gold (XAUUSD) as price begins its early accumulation phase ahead of the Federal Reserve’s rate decision in 11 days. Using a refined OHLC strategy alongside my proprietary Chrono Conditioned Trading (CCT) method, I foresee a strategic retest around $3357 to $3360, which could unlock the momentum needed to approach $3400 and eventually $3500 a key psychological resistance before price makes its way to the $5000 projection.
🧠 Technical Insight: OHLC Strategy
The OHLC (Open-High-Low-Close) method is vital for identifying precision entries:
Open shows the market’s first reaction;
High and Low define intraday volatility boundaries;
Close indicates market sentiment and real direction.
In today's setup, early accumulation begins near the previous daily open, and a break above yesterday's high signals that buyers are returning in strength.
⏱ CCT – Chrono Conditioned Trading Approach
My CCT method focuses on timing-based entries combined with price conditioning:
Entries are planned around event timelines like the upcoming FOMC rate release (FedWatch).
CCT waits for the “right time and right structure” not just price but when price moves.
Today fits that condition: early cycle, pre-news sentiment, and a clean OHLC break structure.
💡 Trading Tip:
“Never chase gold. Let the structure and time align. When OHLC confirms and CCT conditions are met only then, you strike.”
🗓 Fed Expectations:
Although rate cuts are projected for September and December 2025, it is unlikely the Fed will move in July. That uncertainty fuels speculative accumulation—making today a strategic entry point.
Stay sharp. Watch for OHLC rejections or continuation signals above $3360.
If bulls defend $3357 well, gold may reclaim the $3400 range soon setting the stage for the ultimate test at $3500.
#XAUUSD #GoldTrading #OHLCstrategy #ChronoConditionedTrading #FedWatch #GoldAnalysis #CCTMethod
Regards,
Zezu Zaza
2048

Excellent profits booked As I mentioned in yesterday’s commentry session:
My strategy is still the same – buying every dip in Gold around my key level yesterday at 3312, which the market respects well and as our first target was 3345
I'm aiming for a breakout to the upside.
Very happy with the profits so far.
My medium-term targets remain 3380 &3,400 and I’ll keep buying every local low until then.
Also I mentioned if 3310 turns flips on down side then buy at 3290 will be the perfect buy.

Gold---sell near 3355, target 3330-3320Gold market analysis:
The gold buying and selling game in the past two days is quite fierce. The daily line is washed back and forth, with a combination of one Yin and one Yang. The upper and lower shadows of the daily line are relatively long. Yesterday, the daily line closed with a standard hammer candle pattern. After breaking the strong support of 3320, the price did not continue to fall, but bottomed out at 3308 and began to rise strongly, which eventually led to the short-term selling dream being shattered again. The daily line and K showed alternating conversions. The short-term trend is vague, but the long-term trend is still buying. This wave of repairs has the participation of fundamentals and the repair of gold itself. In the big cycle, it is difficult to form a daily selling trend without breaking the position of 3281. In addition, the fundamentals all support gold. I think the possibility of a deep fall in gold in the near future is very small. We are just a follower. In the short term, we focus on the intraday trend to operate. Yesterday, the daily line had a tail, and the possibility of continuing to fall today is small. Let's look at the repair rebound in the Asian session first. The first suppression position for buying rebound is around 3357. This position is also a form suppression and an indicator suppression. The other suppressions are around 3366 and 3377. Note that gold is not unilateral. When encountering great pressure, we must also consider selling opportunities. Today, I think it will rebound first and then fall back.
Support 3327 and 3320, strong support 3308, pressure 3344.3357.3366.3377, and the strength and weakness dividing line of the market is 3340.
Fundamental analysis:
There are not many fundamentals this week. The data released yesterday still suppressed gold as a whole, but the gold tail market still bottomed out and rebounded.
Operation suggestions:
Gold---sell near 3355, target 3330-3320

Gold prices are on the rise again!Market news:
In the early Asian session on Friday (July 18), spot gold fluctuated in a narrow range and is currently trading around $3,336 per ounce. London gold prices staged a thrilling "deep V" market yesterday, hitting a daily low of $3,309 during the session and recovering to 3,339 at the end of the session. Strong US retail sales and employment data drove the dollar to rebound and US Treasury yields to rise, putting pressure on interest-free assets such as gold. Despite this, geopolitical tensions and rising tariff risks are still providing bottom support for the gold market. The international gold market is currently in a multi-game of Fed policies, US economic data, US dollar trends and tariff policies. The Fed's position of postponing interest rate cuts, strong retail and employment data, and the rise in the US dollar and US Treasury yields have suppressed gold prices in the short term. This trading day needs to pay attention to the preliminary value of the University of Michigan Consumer Confidence Index in July and US real estate market data, pay attention to the G20 Finance Ministers and Central Bank Governors Meeting hosted by South Africa, and pay attention to news related to the international trade situation.
Technical Review:
Gold closed with a small positive line with a long upper shadow yesterday. Although it ended the continuous negative trend, it still faced sideways resistance below 3374, and the overall market still needs to be treated as a shock consolidation. From a large cycle perspective, gold has entered a convergent triangle consolidation phase of nearly three months. Among them, the lower track support line gradually moved up to above 3310. The support strength of this position continues to increase as the consolidation time lengthens. If the price touches or approaches this point, you can decisively try to buy the bottom layout.For two consecutive trading days, gold has been consolidating in a larger range of 3377/3310, and finally closed at the starting point of the daily Bollinger band middle track at the end of the trading day. Gold returned to the middle axis of the range at 3340. The daily chart Bollinger band middle track, the RSI indicator middle axis flattened, the four-hour chart hourly chart Bollinger band middle track, and the RSI indicator neutral middle axis. On Friday, the layout of the day will still be based on a wide range of fluctuations. Look at the 3320/3360 range first. Alternating buying and selling cycles, large range of wide fluctuations!
Today's analysis:
In the past two days, gold has always risen in the US market due to news. Last night, Trump called on the Federal Reserve to cut interest rates, and gold rose again. However, judging from the recent market, the market stimulated by the news is still unsustainable. Since gold has rebounded now, gold will continue to sell at a high level in the early trading.
Excluding yesterday's market affected by Trump, the gold price operation pattern this week is close to perfect, and it has been steadily operating under the suppression of the downward trend line. Therefore, the market has given a clear direction. It is OK to sell when the Asian market rebounds to the pressure level. Gold is still in a fluctuating downward trend in 1 hour!
The downward trend resistance of gold has moved down to around 3350. Before gold effectively breaks through 3350, gold is under pressure at 3350 and continues to sell at high prices. Today, Friday, the probability of gold having a big market is relatively high, and if there is a big market on Friday, it is basically weak throughout the day. If it is strong, it is strong throughout the day. As long as gold continues to be weak in the European market, it is likely that gold will continue to fall today.
Operation ideas:
Buy short-term gold at 3317-3320, stop loss at 3308, target at 3340-3360;
Sell short-term gold at 3352-3355, stop loss at 3364, target at 3330-3310;
Key points:
First support level: 3323, second support level: 3310, third support level: 3290
First resistance level: 3348, second resistance level: 3360, third resistance level: 3377
