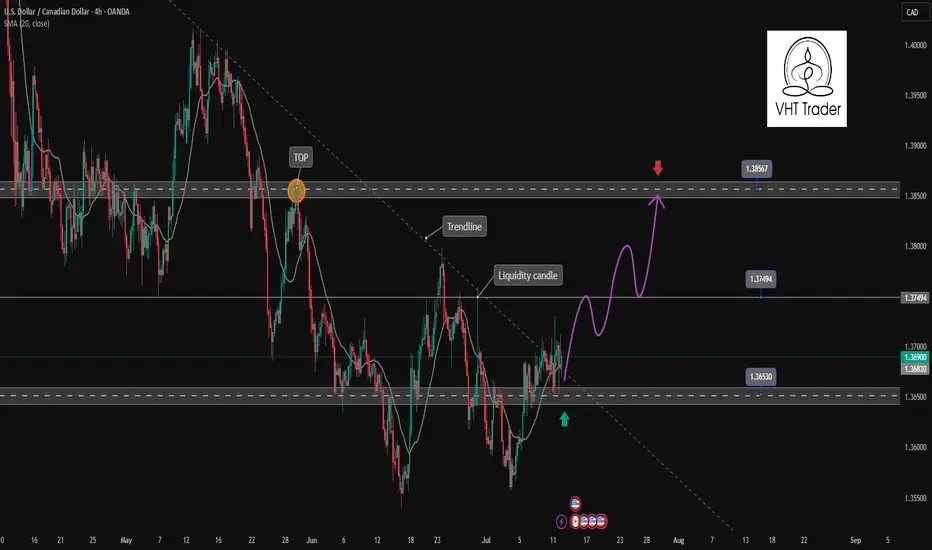
USDCAD is showing signs of bullish recovery✏️ OANDA:USDCAD has broken the Trendline structure to form a corrective uptrend. The price is still above the 20 SMA, indicating that the market's bullish momentum is still strong. The bullish wave may extend to 1.385. Pay attention to the reaction at the 1.375 liquidity candle wick zone for a positive DCA strategy.
📉 Key Levels
Support: 1.365
Resistance: 1.375-1.385
BUY Now: 1.365 (Strong support zone)
BUY Trigger: break and close above 1.375
Target: 1.385
Leave your comments on the idea. I am happy to read your views.
Goldprediction
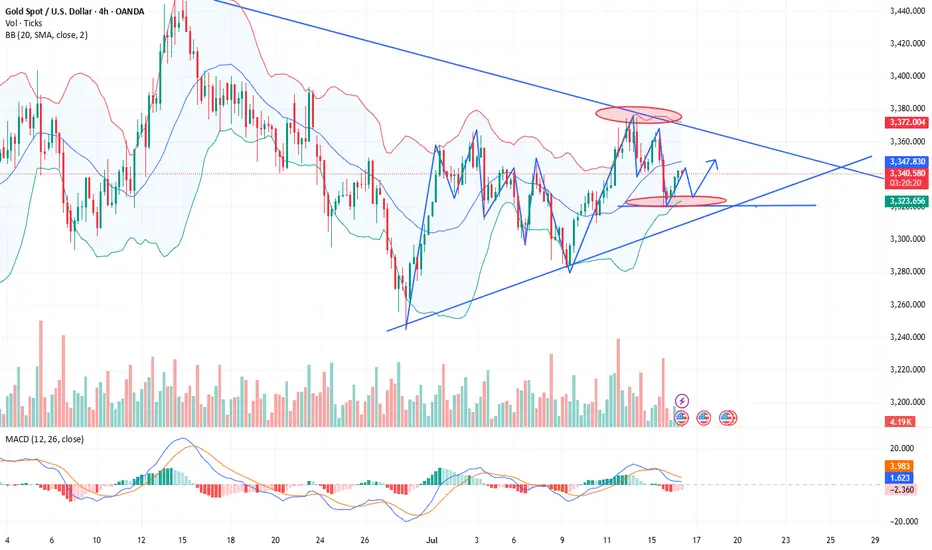
Gold returns to Sideway range waiting for new momentumOANDA:XAUUSD A sweep of liquidity back to the 3377 zone and then back into the triangle trading range. Currently, the market will wait for new momentum for the next trend. If the 3322 zone is still holding, the uptrend to 3400 is still there. This is an important price zone in today's trading day.
📉 Key Levels
BUY Trigger: rejection 3323 with bullrish confirmation
Target: 3373
SELL Trigger: Break and trading Bellow support 3321
Target: 3285
Leave your comments on the idea. I am happy to read your views.
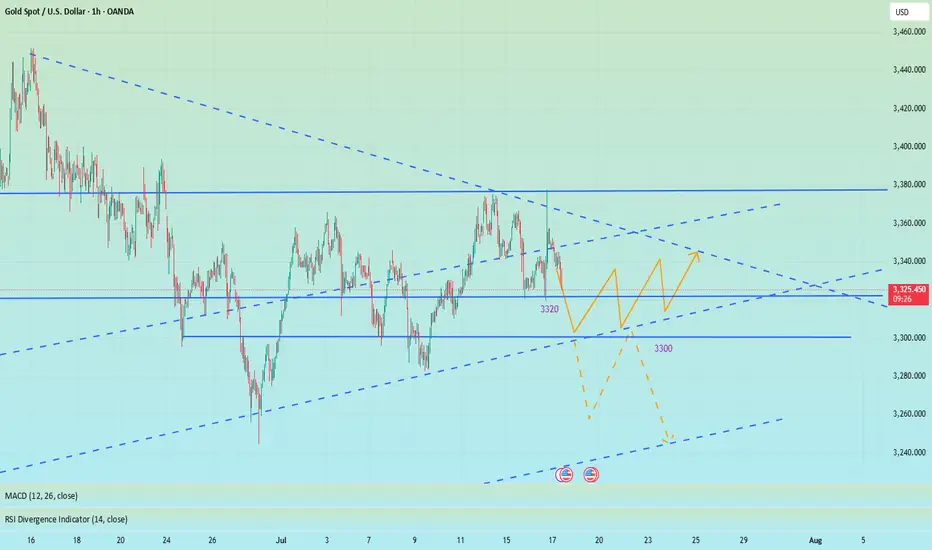
Gold Analysis – Why I’m Targeting $4,085Friday July 18 2025. Malaysia, Kuala Lumpur - Gold analysis done by Zezu Zaza to see the potential upcoming upside starting today this Friday.
I am using a CCT (Chrono Conditioned Trading) technique for my trading based analysis with mathematical strategy in the Xauusd pricing. We will cover the technical, fundamental and sentiment aspect as these are the three components pillars in trading before making any decision and movement trend.
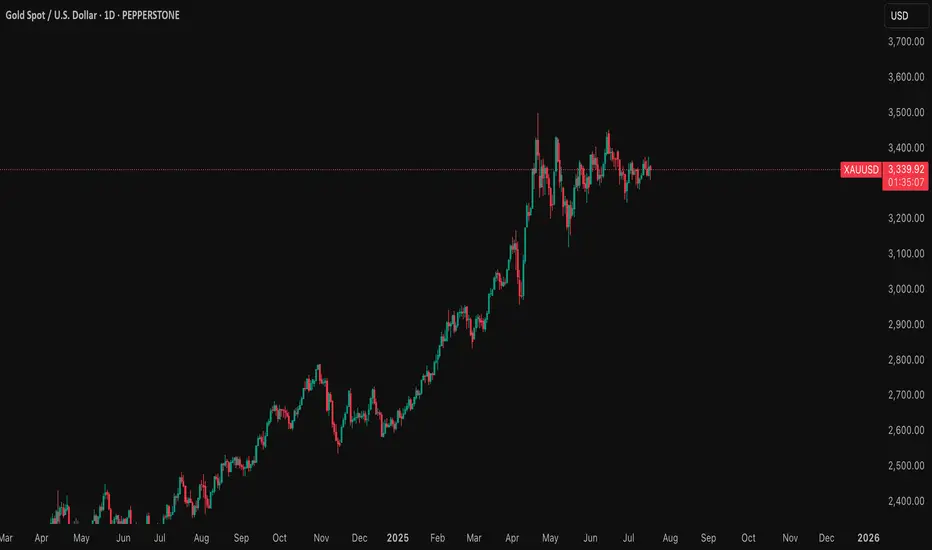
1. Technical Setup (Daily Chart)
Gold is currently consolidating between the $3,300 to $3,375 range after a strong rally earlier this year.
The RSI sits near the neutral 50 level, while the MACD shows signs of a potential bullish crossover.
A confirmed breakout above the $3,375 to $3,400 resistance zone may lead to a surge toward $3,600 to $3,650, and possibly much higher.
Market structure remains bullish, with higher lows forming a solid base around $3,300.
2. Federal Reserve Outlook – 2025 Rate Cuts Expected
The market is now pricing in at least two interest rate cuts from the Federal Reserve by the end of 2025. A 25 basis point cut is expected in September, with another potentially coming in December. Recent CPI and PPI data indicate cooling inflation, giving the Fed more room to ease without reigniting price pressure. Labor market strength is weakening, wage growth is decelerating, and tighter credit conditions are emerging. Fed Chair Jerome Powell recently stated that the risks of over-tightening are now balanced, signaling a shift to a more dovish stance. Lower interest rates reduce bond yields and weaken the dollar, which historically fuels gold’s bullish momentum. If trump fired or Powell decision to step down, this will fire the gold even higher for the catalyze.
3. Market Sentiment (Speculative Positioning)
As of July 11, 2025, the latest CFTC Commitment of Traders report shows speculative net long positions on gold have surged to 203,000 contracts, the highest level in several months.
This signals a strong bullish sentiment among hedge funds and large traders.
In addition, gold ETFs saw over $38 billion in inflows in the first half of 2025, highlighting strong institutional demand as investors seek safety in uncertain times.
The positioning supports further upside as traders bet on a softer dollar and increased market volatility.
4. Macro Fundamentals and Hedge Fund Sentiment
Central banks around the world, especially in the BRICS nations, continue to increase their gold reserves in efforts to reduce reliance on the US dollar.
China has been actively accumulating gold for more than eight consecutive months, with unofficial estimates suggesting holdings of up to 5,000 metric tons.
Several hedge funds and institutional managers now classify gold as a core asset class due to rising fiscal uncertainty, geopolitical risk, and the deterioration of confidence in monetary policy. David Einhorn of Greenlight Capital emphasized that gold is not just about inflation but about the credibility of monetary and fiscal policies. His fund maintains a long gold position and expects higher prices as global deficits and structural imbalances persist.
5. Institutional Forecasts and Speculator Targets
Goldman Sachs has raised its end-of-2025 target to the $3,700 to $3,950 range, citing rising ETF inflows and a softer Fed stance. JPMorgan expects gold to average around $3,675 in the fourth quarter of 2025. Citi, in a bull case scenario, believes gold could trade well above $3,300. The World Gold Council has outlined a high-conviction scenario in which gold could reach $4,000 within the next six to nine months, driven by stagflation and global monetary instability. Greenlight Capital is reportedly aiming for the $3,500 to $3,800 range, though David Einhorn noted that he does not want prices to rise excessively too quickly.
Target Price: $4,085 first before turn the bullish sooners to $5000 price make this same year.
My target of $4,085 is supported by the convergence of multiple factors:
- A bullish technical structure with a potential breakout
- Fed interest rate cuts reducing yields and weakening the dollar. Fed will reduce the rates for the first time this year (12 more days) after this article is published today 18 July 2025.
- Strong speculative positioning and ETF demand
- Aggressive central bank accumulation
- Hedge fund sentiment aligned with rising gold exposure
- Persistent geopolitical and macroeconomic uncertainty
If these conditions hold, $4,085 is a realistic medium-term objective within six to nine months.
Trading Plan Summary
Component Strategy
Entry Zone Breakout above $3,375
Stop Loss $3,300 to $3,320 (below key support)
Take Profit Partial at $3,600 to $3,650, trail remainder to $4,085
Risk Triggers Dollar strength, unexpected Fed hawkish turn, resolution in geopolitics
Key Catalysts CPI done, PPI done, FOMC statements, nonfarm payrolls, war developments
Final Takeaway
This gold analysis blends a bullish technical pattern with the macroeconomic backdrop of an approaching Fed pivot, rising speculative positioning, and ongoing central bank purchases.
Hedge funds and institutions are increasingly viewing gold as an essential defensive asset, especially in the face of deteriorating fiscal credibility and geopolitical tensions.
If gold breaks and holds above the $3,375 level, the path toward $4,085 becomes significantly more probable.
18 July 2025 Friday is a starter ignition trend will born today. I will place some test lots today and will accumulate after from time to time.
Let me know if you what is your opinion or send email to me to reach me for the insitutional analyst or want to see live trade.
Regards,
Zezu Zaza
2048
GOLD LONG SETUP Gold Bullish Long Setup
Startegy : FVG + MSS + BUY STRUCTURE
Where To Buy ?
3329 - 3320 Area FVG Buy
Targets : 3350 , 3355, 3360
Stop Loss Previous Low
XAUUSD:Go long
Based on the 4-hour analysis, the short-term support below for today remains focused on the area around 3318-25, while the short-term resistance above focuses on the 3340-45 level. The key resistance above is at 3380. Overall, this range remains the main framework for our participation in the trade, with positions generally being cautious and waiting for key levels to enter. I will provide specific trading strategies during the session, so please stay tuned. Given that the current market has retraced to 3325 and then rebounded, we can go long in the 3325-30 range.
Trading Strategy:
BUY@3325-30
TP:3340-45
More detailed strategies and trading will be notified here ↗↗↗
Keep updated, come to "get" ↗↗↗
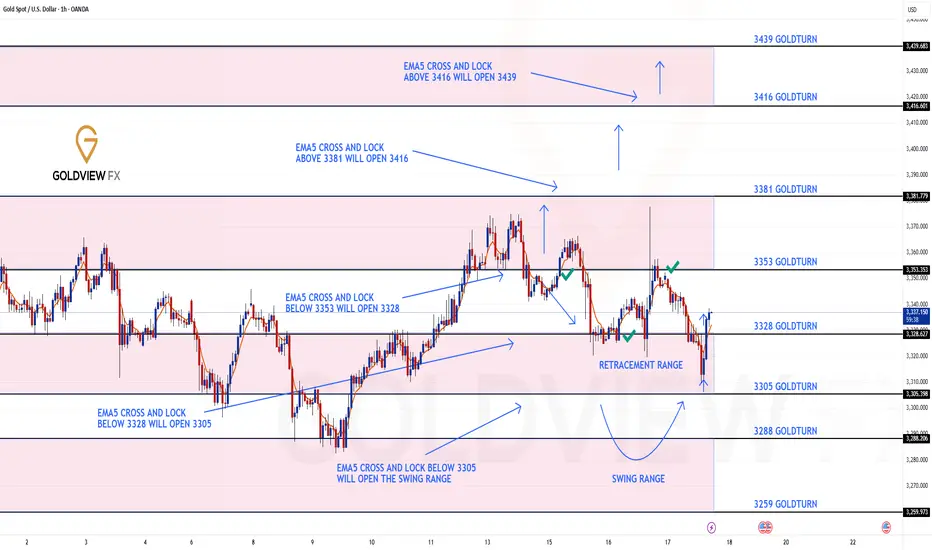
GOLD ROUTE MAP UPDATEHey Everyone,
Quick follow-up on yesterday’s 1H chart update
After hitting 3353, we did not see an EMA5 cross and lock above this level. That lack of confirmation was key and it validated a rejection right at 3353, leading to another drop into the retracement zone.
As per plan, that retracement provided yet another clean bounce, perfectly in line with our dip buying strategy.
We are once again looking toward 3353, and just like before, we will be closely watching for an EMA5 cross and lock confirmation to validate any continuation.
This kind of movement continues to confirm the power of patience, structure, and disciplined execution. No chasing just clean planned executions with high probability setups based on our EMA5 methodology.
We’re also still watching the 3381 gap a key magnet above, and a level we’ve been tracking since the Monday outlook. The roadmap remains unchanged. We’re trading the structure, managing risk, and letting confirmations guide the execution.
Updated Reminder of Key Levels:
BULLISH TARGET
3381
EMA5 CROSS & LOCK ABOVE 3381 opens
3416
EMA5 CROSS & LOCK ABOVE 3416 opens
3439
BEARISH TARGETS
3353 ✅ HIT
EMA5 CROSS & LOCK BELOW 3353 opens
3328 ✅ HIT
EMA5 CROSS & LOCK BELOW 3328 opens
3305
EMA5 CROSS & LOCK BELOW 3305 opens Swing Range:
3288
3259
As always, we’ll continue monitoring and sharing updates, as price reacts around these zones. Thank you all for the continued support, your likes, comments, and follows are genuinely appreciated!
Mr Gold
GoldViewFX
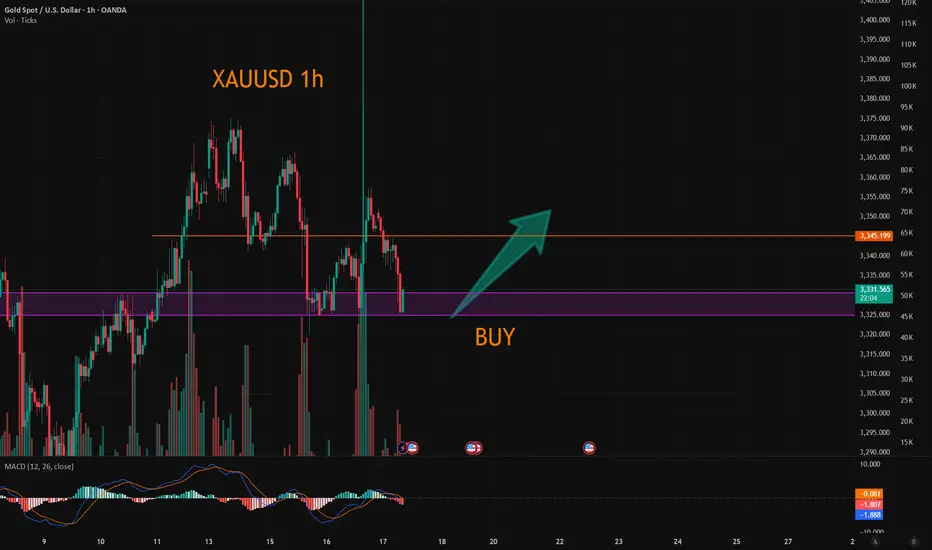
Treat it as a long-short wash-out shock, and go long on pullback📰 News information:
1. Initial jobless claims data
2. June retail data
3. Beware of Trump's remarks about firing Powell
📈 Technical Analysis:
Last night, the daily line closed at around 3347. The current short-term daily line range is 3355-3300. The short-term support below is still 3320. Once it falls below 3320, it will look to 3310-3300. Short-term trading is still volatile. If the intraday retracement reaches 3320-3310, consider going long, and the defense is 3300, with the target at 3340-3350. Under the current rhythm of long and short wash, don't chase the rise and sell the fall, look at it rationally, and brothers who trade independently must bring SL.
🎯 Trading Points:
BUY 3320-3310
TP 3340-3350
In addition to investment, life also includes poetry, distant places, and Allen. Facing the market is actually facing yourself, correcting your shortcomings, facing your mistakes, and exercising strict self-discipline. I share free trading strategies and analysis ideas every day for reference by brothers. I hope my analysis can help you.
FXOPEN:XAUUSD OANDA:XAUUSD FX:XAUUSD FOREXCOM:XAUUSD PEPPERSTONE:XAUUSD TVC:GOLD
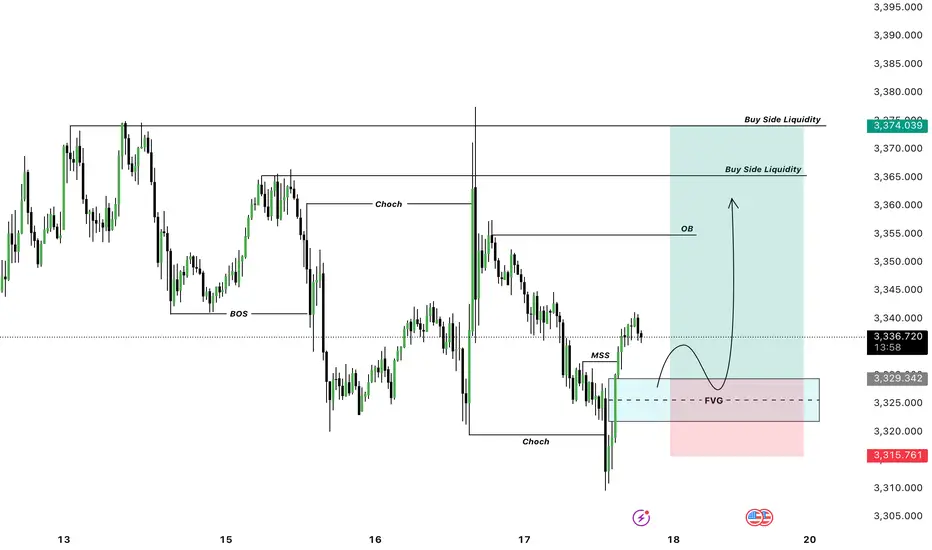
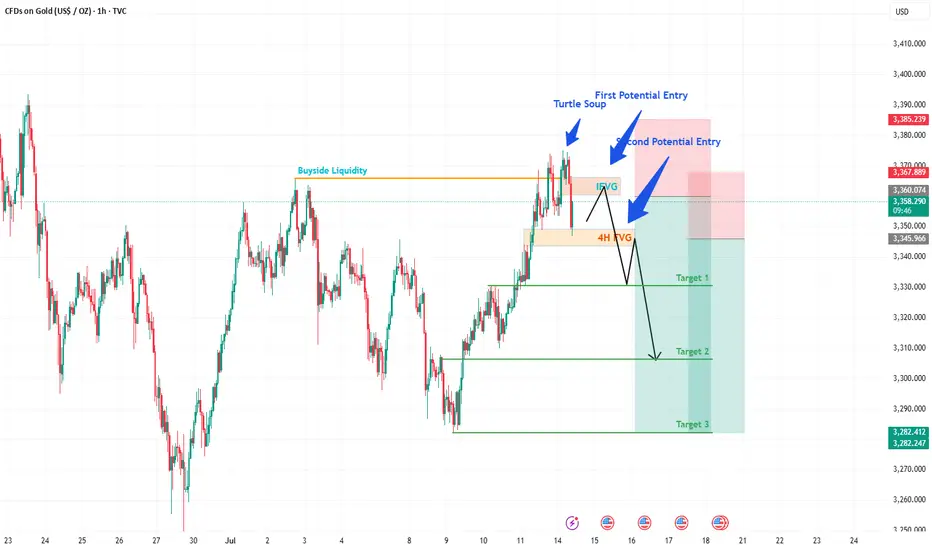
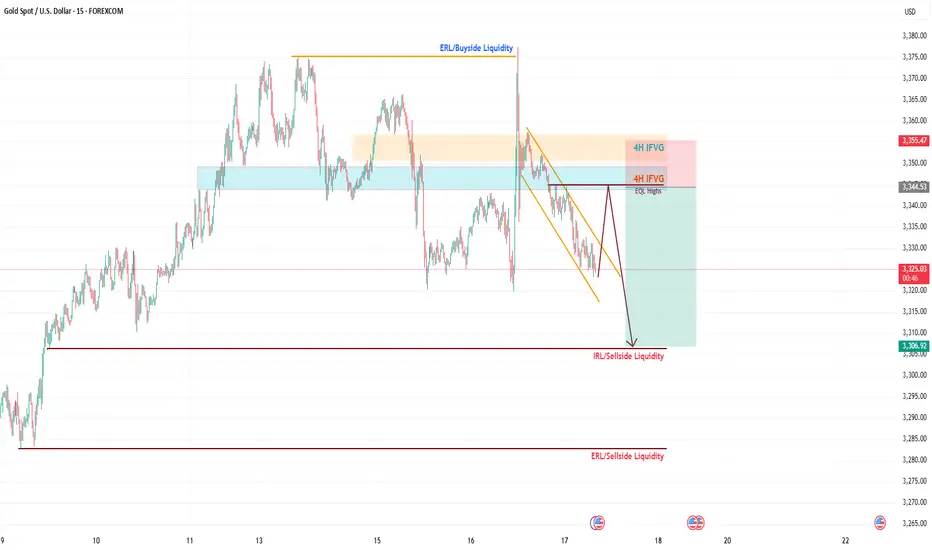
XAUUSD (GOLD) POTENTIAL SELL IDEAGold after hitting 3500 level, has kind of been ranging between 3200 and 3450 level. As we can say that Monday as start of the week has taken a Buyside Liquidity maybe making it high of the week which we will know as the market unfolds itself.
A FVG was formed on 1H before the Buyside was taken and after taking BSL, price sliced through FVG making it IFVG, we can expect Gold to give us a sell trade as it enters this IFVG which will be our first potential entry, placing SL slightly above Buyside Liquidity level.
If our first entry is successful, we can see a second entry when the price slices through the 4h FVG as marked, making it again an IFVG targeting the levels as highlighted on the chart.
FIRST POTENTIAL ENTRY:
Sell @ 3360-3365
Stop loss = 3385
Take Profit = 3335 (Target 1), 3310 (Target 2), 3390 (Target 3)
SECOND POTENTIAL ENTRY:
Sell @ 3340-3345
Stop loss = 3367
Take Profit = 3335 (Target 1), 3310 (Target 2), 3390 (Target 3)
Trump's five major factors! Will gold continue to rise?The past six months may have been dizzying, but a clear theme has emerged since U.S. President Donald Trump returned to the White House: It’s good news for the gold market.
Although gold prices broke through $3,500 an ounce nearly three months ago, setting a new record high, five key factors that have emerged since the start of Trump’s second term are likely to continue to support gold prices in the coming months. These factors may even prove that the precious metal is becoming a core asset class in investors’ portfolio strategies.
David Miller, co-founder and chief investment officer of Catalyst Funds, said that as the market enters the third quarter, gold remains a standout asset class that “provides both a hedge against the potential risks of geopolitical conflict and a break from the erosion of fiat currencies.”
The first key factor supporting gold is demand from central banks, which indicates that the market has weakened confidence in the U.S. dollar. Miller pointed out in emailed comments that central bank demand is surging, and the BRICS countries, especially China and India, are accelerating the accumulation of gold reserves “as part of a broader de-dollarization strategy.” According to a report released by the World Gold Council on Wednesday, the People’s Bank of China’s official gold holdings have climbed for eight consecutive months.
David Russell, head of global market strategy at TradeStation, said the global tariffs threatened and implemented by Trump have accelerated the "de-dollarization process." De-dollarization refers to efforts by some countries to reduce their reliance on the U.S. dollar as a reserve currency.
"Trade is becoming less dependent on the U.S. end market and less dependent on the dollar. This is more like the 19th century than the era after World War I and World War II," Russell said in emailed comments. "This trend back to the old model is creating structural demand for gold after decades of neglect. Fiat currencies are in decline," he added.
Russell also said the decline in the credit quality of developed country governments, such as the United States, is also a major concern for the market. "We have lost our AAA rating from the three major rating agencies because of growing deficits and looming pressure on unfunded liabilities such as Social Security," he said, referring in part to Moody's downgrading its top credit rating for the United States in May. "After decades of procrastination, we are running out of ways to go."
That said, trade policy is a third factor affecting gold. Russell said that "large budget deficits or increased tariffs" would reduce demand for U.S. Treasuries, supporting gold prices.
With both 2-year and 10-year Treasury yields falling so far this year and real rates under pressure from inflation, "the opportunity cost of holding gold is falling," noted Catalyst Funds' Miller. That's leading to a fourth potential support for gold -- a resurgent interest in gold exchange-traded funds and other alternatives.
In the first half of 2025, North America led the growth in global gold ETF inflows, according to the World Gold Council. Global physically-backed gold ETFs saw inflows of $38 billion in the first half of this year, marking the strongest half-year performance since the first half of 2020, according to the World Gold Council.
Finally, from a technical perspective, gold prices have held above $3,250 an ounce for much of June, Miller said. That shows signs of "a potential breakout as equity market volatility returns," he said. Gold for August delivery closed at $3,359.10 an ounce on Wednesday.
“Gold is not just a crisis hedge, it is becoming a core asset class in modern portfolio strategies.” Miller said that the current macroeconomic environment “justifies a meaningful allocation to gold and gold-related strategies.”
He said: “The combination of fragile stock market sentiment, uncertain policy direction and structural macro headwinds reinforces our view that gold is not just a crisis hedge, it is becoming a core asset class in modern portfolio strategies.” PEPPERSTONE:XAUUSD ACTIVTRADES:GOLD ICMARKETS:XAUUSD ACTIVTRADES:GOLD EIGHTCAP:XAUUSD VELOCITY:GOLD

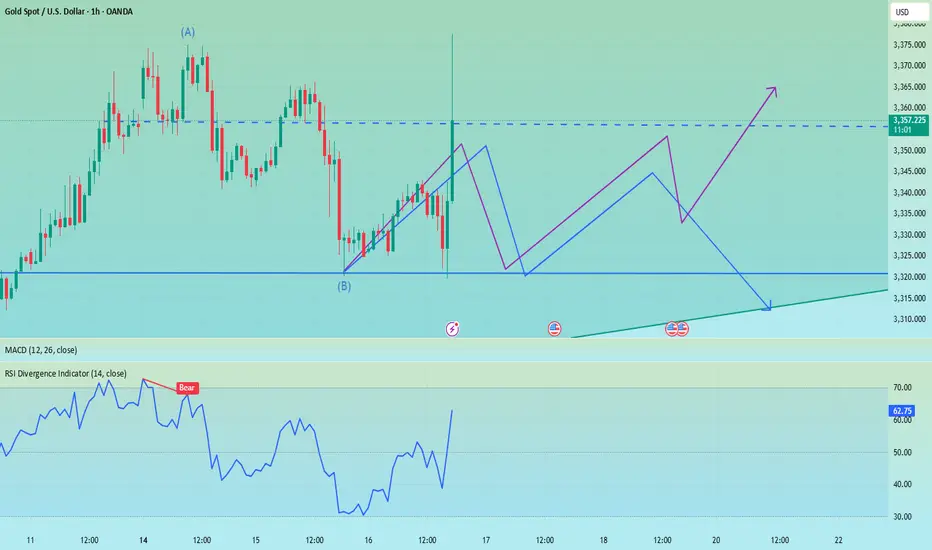
Gold pullback bulls are a winning streak strategy
💡Message Strategy
Gold prices experienced a roller coaster ride on Wednesday, mainly due to a Bloomberg report that Trump was considering firing Federal Reserve Chairman Powell (Trump wants to cut interest rates as soon as possible and the Fed is cautious). This quickly ignited the market's risk aversion sentiment, pushing gold prices up quickly by $50. However, after the rise, gold soon encountered resistance and gave up nearly $40 in gains, as Trump quickly denied the plan and the market's risk aversion sentiment cooled.
Gold prices fluctuated and fell on Thursday as Trump denied plans to fire Powell. Due to the rise in US CPI data released earlier, investors' expectations for the Fed's interest rate cuts cooled, which began to affect the market again. Looking ahead, investors still need to pay attention to the impact of Trump's tariff remarks and the Fed's monetary policy outlook on gold prices.
📊Technical aspects
After hitting a three-week high, gold prices fell back and continued to fluctuate in a wide range.
Gold is still in a bullish pattern. The support below focuses on Tuesday's low of $3,320, which is near the position where gold prices stabilized and rose in the Asian and European sessions on Wednesday, and near the position where gold prices fell and stabilized and rose in the US session on Wednesday. This is also the core position of our trading this week.
Gold's upper pressure focuses on the downward breakthrough of gold prices in the Asian and European sessions at $3,345, which is also the low point where gold prices quickly fell after rising on Wednesday. Secondly, focus on the intraday high of $3,375. The 5-day moving average slowed down after a slight golden cross, the MACD indicator slightly crossed upward, and the KDJ and RSI indicators formed a dead cross. The short-term technical aspect suggests that gold prices have a short-term upward trend.
💰Strategy Package
Long Position:3300-3315,SL:3280,Target: 3360-3370
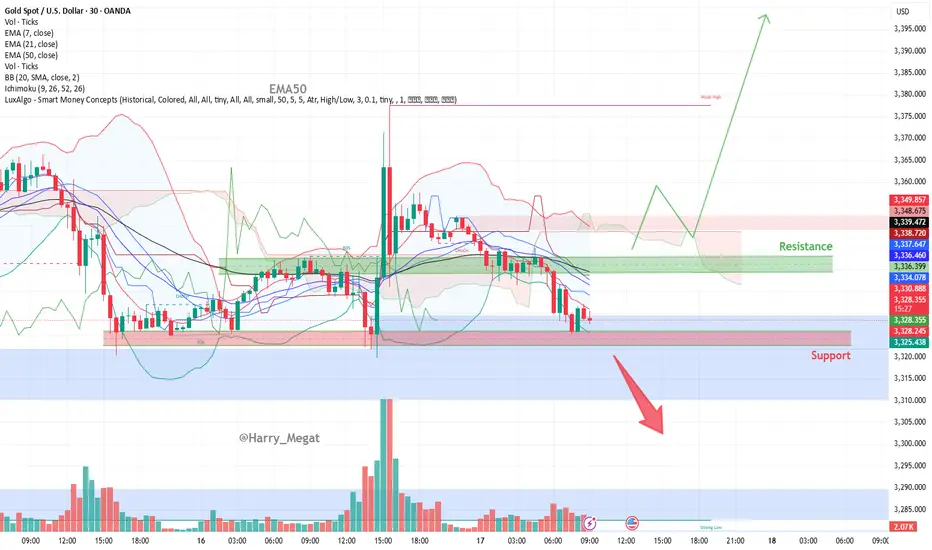
Gold (XAU/USD) Setup based on 30-minute chartGold (XAU/USD) Setup based on 30-minute chart
**Bullish Scenario**
* **Support Held**: Price is currently testing a key horizontal support zone (\~\$3,320–\$3,327), which has held multiple times in the past.
* **Potential Reversal**: If price forms a bullish candlestick pattern here (e.g., bullish engulfing, hammer), we may see a rebound.
* **Upside Target**:
* **First Resistance**: \$3,345–\$3,350 (green zone)
* **Further Target**: \$3,380–\$3,400 if momentum continues
**Confirmation Triggers**:
* Bullish price action from support zone
* Break above EMA 7 / EMA 21 (\~\$3,330–\$3,336)
* Increasing volume on green candles
**Bearish Scenario**
* **Breakdown Threat**: Price is hovering near support; if it breaks below \$3,320 with volume, downside pressure may intensify.
* **Next Support Levels**:
* \$3,310 (minor)
* \$3,285–\$3,275 (major support)
**Bearish Triggers**:
* Clear break and close below \$3,320
* EMA crossover (short-term below long-term)
* Rising red volume bars
Summary
| Direction | Conditions | Targets |
| ---------- | --------------------------------------------------- | ------------------------- |
| Bullish | Hold above \$3,320 + breakout above \$3,336 (EMA50) | \$3,350 → \$3,380–\$3,400 |
| Bearish | Break below \$3,320 support | \$3,310 → \$3,285 |
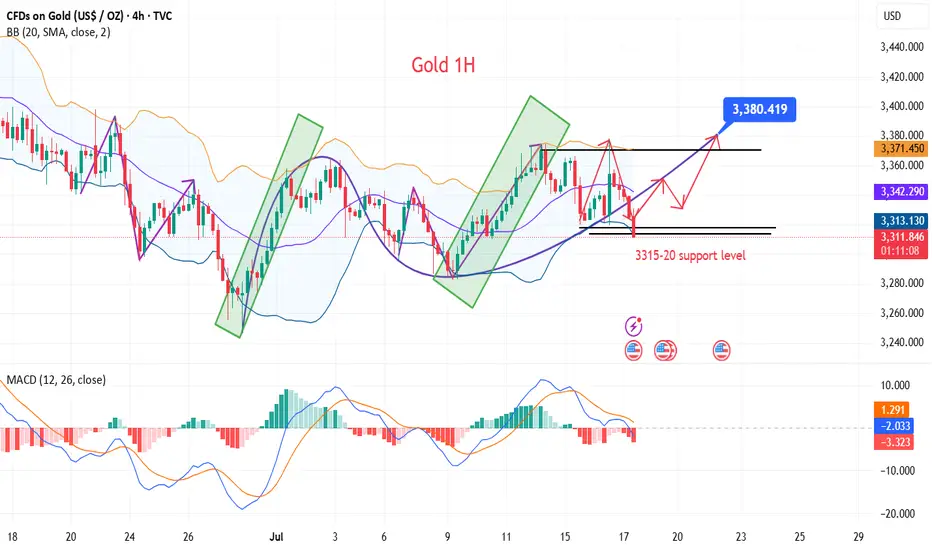
XAU/USD) bearish Trend Read The captionSMC trading point update
Technical analysis of XAU/USD (Gold Spot vs US Dollar) on the 1-hour timeframe. Here's a breakdown
---
Technical Breakdown:
1. Descending Channel:
Price is trading within a clearly defined downward-sloping channel (black trendlines).
This suggests a short-term bearish trend.
2. Resistance Zone (Yellow Box at 3,335–3,340):
Price recently rejected from this resistance area.
This zone aligns with both the 200 EMA and previous structure, strengthening its validity.
3. EMA Confluence:
The 200 EMA (3,336.798) is acting as dynamic resistance.
Price is currently below the EMA, confirming the bearish bias.
4. Support/Target Zone:
The projected target zone is around 3,313.266, labeled as a support level.
This level has acted as previous structure support, increasing its significance.
5. RSI Analysis:
RSI is at 37.18, close to the oversold region, but not yet fully exhausted.
Suggests there’s still room for a downside move before any potential bounce.
Mr SMC Trading point
---
Trade Idea Summary:
Bias: Bearish
Entry: Below the resistance zone (~3,335–3,340)
Target: 3,313 (support zone)
Invalidation: Break and hold above 3,340–3,345
Risk Note: Watch for potential consolidation or fakeouts before continuation.
Please support boost 🚀 this analysis)

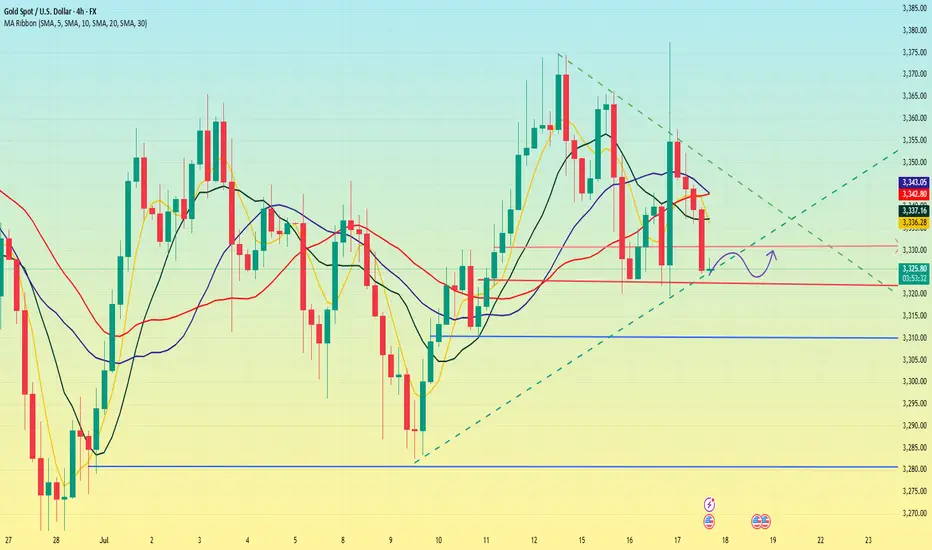
Gold market price trend analysis and operation strategyGold trend analysis:
Gold reached a high of 3366 yesterday, a low of 3320, and closed at around 3325. From the daily chart, the performance of the daily cycle is high and closed negative, and it may not be able to go out of the big rise in the short term. Gold will fall into range fluctuations. The rise of gold in this cycle has not actually been completed. At least it needs to go to the high point of 3400, and then look at the adjustment space within the week, but don’t look too much at the strength of the rise. The general trend is bullish, and we must also beware of the adjustment space that may fall back at any time. Gold tried 3375 several times yesterday and failed to break through, and then fell back for adjustment, indicating that the pressure on 3375 is obvious, that is, gold needs to fall back and correct in the short term. At this time, we are cautious about chasing more and continue to buy more after falling back.
From the 4-hour chart, gold rose and fell yesterday, and the bearish trend did not continue. Gold entered a period of adjustment. From the current K-line, the downward momentum of gold is slowing down, and it tends to rebound in the short term. In the 4-hour chart, the lower track support of the Bollinger Band is near 3320, and the position of the middle track of the Bollinger Band is near 3345, which will form a short-term resistance. From the 1-hour chart, after yesterday's drop to 3320, it was strongly supported again and pulled up to above 3330. The support below is still strong. If the European session rises and breaks through 3350 today, the US session may go to the resistance of 3365-3375. Before breaking through 3350, the current market can only be regarded as a bottom adjustment and correction. Today, we will first focus on the rebound strength. If the upward momentum weakens, pay attention to the support of 3310-3300 below, and wait for the decline to be mainly low-multiple. In the short term, we will first focus on the breakthrough of the shock range. The intraday idea is to fall back to low-multiple. FX:XAUUSD ACTIVTRADES:GOLD OANDA:XAUUSD TVC:GOLD EIGHTCAP:XAUUSD ACTIVTRADES:GOLD
Gold rebounded and shorted in the New York market.Trump's recent remarks about "possibly firing Fed Chairman Powell" triggered risk aversion in the market, and gold once surged to $3,377, but then Trump denied the plan and gold prices fell back to fluctuate in the 3,340-3,350 range; the U.S. PPI in June was flat month-on-month, lower than expected, easing market concerns about the Fed's immediate tightening of policy, but long-term inflation expectations still support gold; Israel's air strikes on Syria have exacerbated tensions in the Middle East, and safe-haven demand has boosted gold; Trump threatens to impose tariffs on the EU, and global trade uncertainty still supports gold's safe-haven properties; gold fluctuated and fell today. After yesterday's big rise, gold gradually fell today. Today, gold fluctuated weakly, and the 4-hour moving average crossed downward. The gold price gradually moved toward the lower Bollinger band, and the Bollinger band opened downward. The trend is more bearish. In terms of operation, we recommend that gold rebound and go short. FOREXCOM:XAUUSD ACTIVTRADES:GOLD FXOPEN:XAUUSD ACTIVTRADES:GOLD VANTAGE:XAUUSD CMCMARKETS:GOLD VANTAGE:XAUUSD
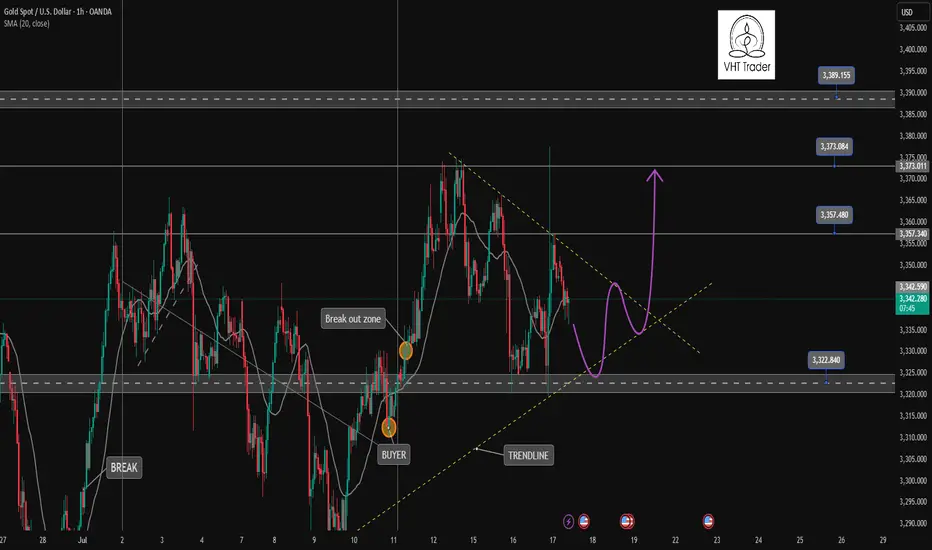
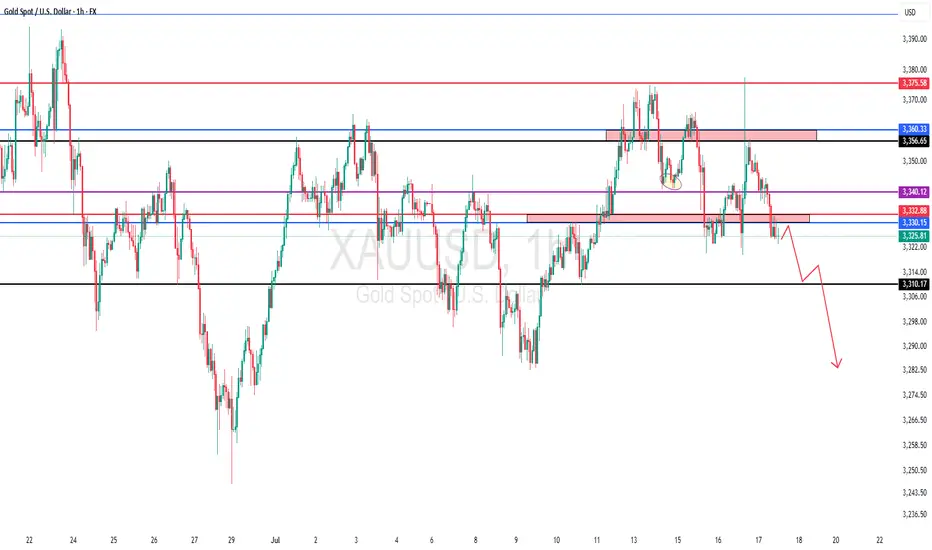
Gold Rejects Resistance Again – Gold Rejects Resistance Again ?Gold is currently trading near $3,335, showing signs of exhaustion after a failed breakout above the recent consolidation range. The market attempted to push higher but lacked strong momentum, leading to a pullback and possible shift in bias. The price is forming lower highs, indicating bearish pressure building up on the 4H timeframe. Gold is showing weakness after a second breakout followed by a possible retest failure. The market structure indicates a bearish bias
🔍 Market Structure Overview:
- Two Breakouts: Price attempted two bullish breakouts recently. The first breakout gained some traction, while the second failed to hold above resistance.
- Failed Retest: Price has now returned back near the previous breakout zone (~$3,332), signaling a potential bearish reversal pattern.
- The chart structure suggests a distribution phase, with price struggling to hold gains, and sellers slowly gaining control.
🧭 Key Support and Resistance Levels:
✅ Resistance Zones:
- $3,337.54 – Immediate resistance (recent rejection zone)
- $3,348.03 – Strong resistance if price pushes above $3,337
- $3,412.76 – Major resistance from previous swing high
- $3,490.40 – Long-term psychological resistance
🔻 Support Zones:
- $3,318.94 – Immediate support (just below current price)
- $3,303.46 – Key fib retracement (0.382 level)
- $3,248.28 – Strong horizontal support (major zone)
- $3,193.11 – Fibonacci extension level (-0.382)
- $3,159.02 – Next support zone (Fibo -0.618 level)
🟠 Current Bias:
Bearish to Neutral – as long as price remains below $3,337.
If price breaks and holds above $3,337 with volume, short-term bullish reversal is possible.
Yeterday there was a fake news and gold was pumped but after clarification it was dumped. It means buyers are not much interested till fed next meeting and the high price of the gold. Sellers will short the gold on every rise while buyers will wait for low price of the gold for long term trade.
Note
Please risk management in trading is a Key so use your money accordingly. If you like the idea then please like and boost. Thank you and Good Luck!

Gold Trading Idea: Short Opportunity on 15-Min Descending ChanneHello TradingView Community,
Following up on my Gold analysis from Monday, the price action has respected the levels I outlined (check my previous posts for the breakdown), delivering solid trade opportunities except yesterday's news-driven volatility. Today, we're eyeing a short setup on Gold based on the 15-minute timeframe.
Technical Analysis:
Gold is moving within a descending channel on the 15-min chart.
I've identified equal highs and a small FVG (Fair Value Gap) aligning with the 61.8% Fibonacci retracement of the channel's range.
This confluence zone is where I expect the price to react, potentially clearing liquidity above the channel before reversing.
Trade Plan:
Entry: Wait for the price to reach the confluence zone (equal highs + 61.8% Fib + FVG) and show a clear reaction (e.g., rejection or reversal pattern) before entering a short position.
Take Profit: Targeting 3310 level.
Risk Management: If the price fails to reach the zone and breaks lower, I'll stay out to avoid chasing trades. Patience is key here.
Stay disciplined, traders! Let the price come to our zone, and always manage your risk.
Follow for more setups, like this post if you found it helpful, and drop your thoughts in the comments below! Let’s discuss!
#Gold #XAUUSD #ShortSetup #TechnicalAnalysis
GOLD - Its Breakout? Short now??#GOLD.. perfect move as per our analysis, and now market just break hit current supporting area that was actually 3328
so keep close it and if market stay below that then we can expect a further drop towards our next supporting areas.
good luck
trade wisely
Gold fluctuated downward. Stuck in a stalemate.Information summary:
Global investors have experienced the longest night this year. There are reports that Trump has drafted a letter to fire Federal Reserve Chairman Powell. The incident triggered a strong reaction in the financial market. An hour later, Trump came out to clarify that "there is no plan to take any action" and denied drafting a letter to fire Powell.
Due to the impact of the incident, gold experienced a roller coaster market, soaring more than $50 at one time, hitting a three-week high of $3,377.17, and then narrowed its gains to 0.68%, and finally closed at $3,347.38. In today's Asian market, gold fell slightly and is currently hovering around $3,325.
Market analysis:
The current volatility pattern has not changed. In the short term, the market shows signs of weakness, which is also affected by CPI data, and expectations for interest rate cuts have weakened. In the current state where there is no break in the pattern, waiting and watching is still the best strategy.
The first support level is around 3,310, which is the starting point of last week's high. The second is around 3280, which is the historical low since July and also the starting point of the rise in the first week of July.
XUA/USD) Bearish Analysis Read The captionSMC trading point update
Technical analysis of XAU/USD (Gold vs USD) on the 1-hour timeframe. Here's a breakdown
Technical Analysis Summary
1. Descending Channel:
The price is moving within a clear descending channel, indicating a bearish market structure.
Recent price action rejected the upper boundary of the channel, strengthening the downtrend bias.
2. Resistance Rejection:
A key resistance level around 3,340–3,345 was retested (marked with a red arrow) and rejected.
Price has already shown early bearish candles post-rejection, suggesting weakness at that level.
3. 200 EMA (Exponential Moving Average):
Price is currently hovering around the 200 EMA, and a clean break below it could accelerate the bearish move.
4. RSI Indicator:
RSI is around 46, below neutral 50, showing bearish momentum is building but not yet oversold.
No divergence is present, supporting the idea of continuation.
---
Bearish Playbook
Entry Idea: After the rejection at the resistance zone and confirmation of lower highs.
Target: 3,313 – 3,310 zone (marked as the “key support level” and “target point”).
Risk Management: A stop loss above 3,345 (above the resistance zone) would be a prudent protection level.
---
Confluences Supporting the Short Setup:
Rejection at horizontal resistance.
Alignment with the descending trendline/channel.
Price trading near or below the 200 EMA.
RSI slightly bearish.
Caution:
Watch out for any macroeconomic news or high-impact events (highlighted with the economic event icons) that could inject volatility.
A strong break back above the resistance could invalidate this bearish setup.
Mr SMC Trading point
Conclusion:
This setup anticipates a bearish continuation targeting the 3,310 support zone. Ideal for short-term traders looking for downside opportunities, provided price respects the trend and fails to reclaim the resistance.
Please support boost 🚀 this analysis)

The firing of Powell set off the market, don't chase the longsTrump showed a draft of the letter to fire Powell, but whether Powell will be fired in the end remains to be seen, but the impact on the gold market is undoubtedly huge. The wolves have now smelled a very dangerous scent. Don’t chase high prices. Don’t chase high prices! ! ! After all, the impact of the news comes and goes quickly, and there is a high possibility of a reversal later in the evening. The final suppression position of the current gold daily line is 3340. If the closing line today can maintain above 3340, then gold will usher in a real bullish trend in the future.
OANDA:XAUUSD
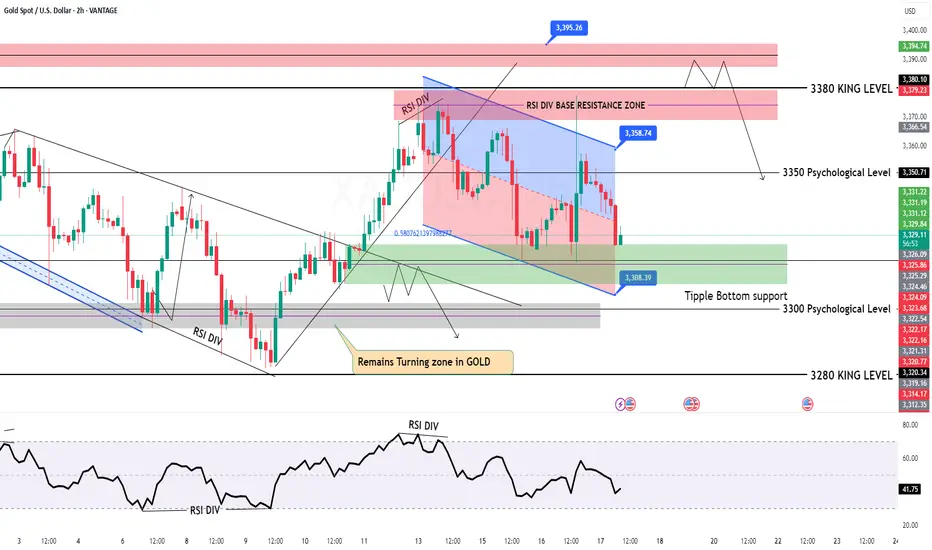
GOLD Intraday Chart Update For 17 July 2025Hello Traders, welcome to new Trading day
Today we have some high impact news of USD, Currently market is still in tight range and we still need breakout of 3300 Psychological for downside clearly
For upside market must need to close above 3380-90 zone for further upwards continuation
currently we are also keep an eyes on WAR Fundamental news
Disclaimer: Forex is Risky
Gold----Sell near 3357, target 3330---3320Gold market analysis:
Yesterday's gold daily Asian session was still a normal shock drop. We sold at 3340 and 3341 twice to 3322 to make all profits. 3320 is the previous low point and the moving average support position. This position is also a strong support today. Yesterday, the Trump and Powell incidents made gold strongly rise to around 3377. In addition, the Middle East bully bombed Syria again, which is also the main reason for the surge in gold. However, the fundamentals are only short-lived. In the end, the gold daily line closed positive, but closed with a super long upper shadow line. Selling is still not dead. Today's gold buying and selling have opportunities, and the possibility of a direct decline is small. I estimate that the Asian session will be repaired, and our ideas for buying and selling in the Asian session can be intercepted. If it breaks 3320, consider chasing and selling again, which means that selling has started again.
The highest rebound in the Asian session was around 3352, and the highest position in 1 hour was around 3357. Today's small suppression in the white session is 3357. The following support focuses on two positions, one is 3320, and the other is 3330. I estimate that the fluctuation range of the Asian session is 3320-3357. Let's observe and wait for the position in the Asian session.
Pressure 3352 and 3357, strong pressure 3366, support 3320 and 3330, and the watershed of strength and weakness in the market is 3350.
Fundamental analysis:
Trump's dissatisfaction with Powell has not been a day or two, and the conflict is inevitable. The impact on gold is also short-term. Yesterday's pull-up and dive is a case in point.
Operation suggestion:
Gold----Sell near 3357, target 3330---3320

Powell's stay or departure affects the market, and gold is unlik
Yesterday, the Trump and Powell incident caused gold to rise strongly to around 3377. The rise of gold was just a moment. In the end, the gold daily line closed positive, but closed with a super long upper shadow line. In the end, the gold price quickly rose and broke through the 3377 mark, and then fell under pressure and fell into a shock closing. The daily K line closed high and fell back and fluctuated in the middle of the positive. Although the overall gold price repeatedly fluctuated and washed the market under the stimulation of the news, it ultimately failed to break through the recent large box shock range. Today we continue to pay attention to the support line of 3318-25 below. We will continue to go long if it falls back!
From the 4-hour analysis, today's short-term support below continues to focus on the vicinity of 3318-25, the short-term pressure above focuses on the 3340-45 line, and the key pressure above focuses on the 3380 line. The overall support range still maintains the main tone of high-altitude low-multiple cycle participation. In the middle position, watch more and do less, and follow orders cautiously, and wait patiently for key points to enter the market.
Gold operation strategy:
Gold falls back to the 3318-25 line and goes long, stop loss 3312, target 3340-45 line, and continues to hold if it breaks;
