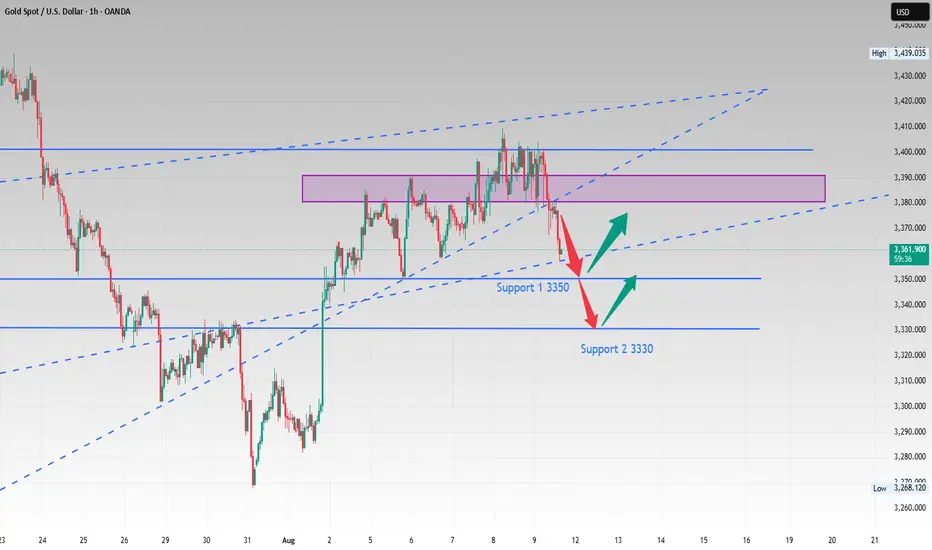
Wait patiently, 3350 is the key, if it falls below, look at 3330Gold experienced frequent fluctuations last Friday night. After opening today at around 3,400, it quickly fell back. Gold has already fallen below last Friday's low. 🐻
It is expected to retrace to test the support level of 3357-3350 today📈. If the support level is not broken, the bulls may rebound at any time.🐂
If it unexpectedly falls below, it may accelerate its decline to around 3330📉, where there is also support, and you can go long in the short term when it approaches📊.
On the whole, the main strategy during the day is to go long based on support and callback. If it touches 3357-3350 for the first time, you can consider going long with a light position.✅
Goldprediction
Gold's decline does not mean a bearish trendGold opened high and closed low today, gradually declining from 3405 and then widening its losses, hitting a low of 3354 in the European session. The intraday short-term trend was clearly weak, with the price still unable to break through 3400 and stabilize. In last week's analysis, I emphasized that if this uptrend fails to stabilize above 3400, a downward turn is possible at any time.
However, in the medium and long term, the bullish outlook remains unchanged. Although 3400 hasn't been broken, after a deep correction, it will likely break again; it's just a matter of time.
It also requires the right opportunity, namely, news stimulus to drive the market. Focus on CPI data. Don't turn bearish based on today's decline; it could potentially rebound tomorrow. Therefore, we recommend avoiding short positions. Even if you do go short, wait for a rebound and use a stop-loss to maintain risk management.
Gold is currently trading sideways around 3360. If it rebounds before the US market opens and reaches the 3378-3380 level, short it with a stop-loss at 3390, targeting 3360-3350.
If there's no rebound before the US market opens and the decline continues, then consider a bullish trend around 3345. This was last week's starting point and coincides with the 50% retracement support level. A rebound could be expected if it reaches the watershed level of 3334, with a target around 3380. OANDA:XAUUSD VELOCITY:GOLD VANTAGE:XAUUSD CMCMARKETS:GOLD PYTH:XAUUSD FOREXCOM:GOLD EIGHTCAP:XAUUSD


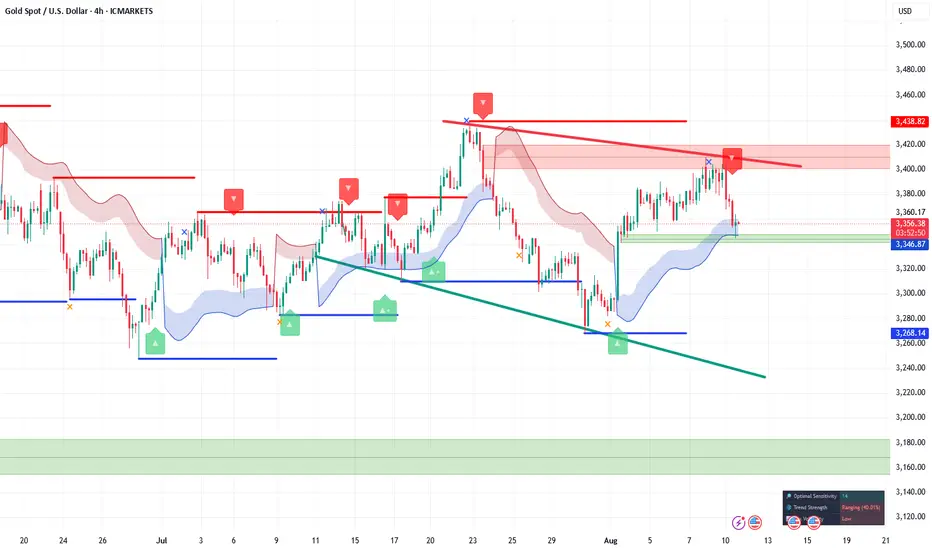
Grasp the key opportunities in gold tradingBefore and after the European session, gold fell back and adjusted again; in the U.S. session, it stabilized and rebounded above 3340 as expected, and continuous low-long layouts achieved steady profits. From the hourly chart structure, the gold trend was highly consistent with the prediction, which not only continued the downward adjustment rhythm, but also released the profit space of rebound long orders, showing the fierce game between the long and short forces in the market.
The 1-hour moving average has begun to turn downward, significantly strengthening bearish momentum. During the US trading session, gold failed to break through the key resistance zone of 3365-3380. This area remains a key defense for bears in the short term.As long as gold fails to effectively break through and hold 3380, the bearish trend will continue to dominate the market, and rebounds will provide favorable opportunities for short positions. The continuous breaking of new lows indicates that bears have a stronger advantage, and bulls are unlikely to achieve a sustained reversal. During trading, it is recommended to strictly implement risk management, reasonably control positions, and position accordingly, seizing every rebound short opportunity. Subsequently, monitor the performance of the key support level of 3340-3330. If this support level fails, bearish momentum will further intensify. Otherwise, there will be limited room for short-term adjustments. Overall, gold is still in a bear-led, volatile downward phase. The main strategy is to short on rebounds, supplemented by buying on pullbacks, and respond flexibly to market changes.
Gold operation suggestion: short gold when it rebounds around 3365-3380, target 3350-3340. If gold falls back to 3340-3330 and stabilizes, consider going long with the target at 3355-3360.

Analysis for the next weekHello Trader,
I hope you are doing well and you enjoyed your weekend.
As you know the market is running in uptrend, it’s creating break of structure (BOS) again and again. The market can fall a bit and then it will continue the uptrend.
It can make another All Time High (ATH) next week. Avoid to take much risk. Follow the trend.
The market is going to open tonight, Get ready your accounts for the next week. Best wishes for all of you guys.

Gold is falling. Can it continue?Ahead of the release of US CPI data, gold saw a sell-off. Before the release of the US CPI data, gold ushered in a selling spree. The price of gold began to decline from a high of around 3400 in early Asian trading on Monday, and the current lowest point has reached around 3353.
Judging from the current 1-hour chart, the moving average system crossed downward; the RSI value is running below the middle track and is currently around 41.4. Gold prices have already dipped below the 5-day moving average, but Quaid believes prices cannot fall below 3350. If this level is broken, gold is likely to reach a low of 3330.
The decline began in early Asian trading and continued in European trading, with no signs of a strong rebound. In the near term, it's important to monitor gold's performance in the US market. However, before the release of the PPI data, there is unlikely to be any catalysts that could support a unilateral rise in gold.
Quaid believes prices are likely to remain above 3360 in the short term, consolidating.

Gold Price Analysis August 11Last week, gold closed the last trading session in a sideways state in the accumulation zone. Entering the beginning of this week, the market is waiting for a new push to break the 3385–3405 zone, from which to trade in the winning direction.
If the lower edge breaks: A correction will be formed, then there is a high possibility of a new uptrend towards the historical peak (ATH).
If the upper edge breaks: The buyers can completely take advantage of the uptrend to bring the price closer to the ATH mark around 3445 in a short time.
📌 Key Levels
Support: 3383 – 3345
Resistance: 3404 – 3431 – 3445

U.S. Slaps 39% Tariff on Swiss Gold BarsU.S. Slaps 39% Tariff on Swiss Gold Bars, Shaking the Global Bullion Market
By Hirad Aryanejad – Macroeconomic & Gold Markets Analyst
---
The United States has moved to impose a 39% tariff on imports of one-kilogram and 100-ounce gold bars from Switzerland — a shock decision that could ripple across the global bullion market.
In a letter dated July 31, 2025, the U.S. Customs and Border Protection (CBP) reclassified these widely traded bullion products — critical to the Comex futures market — as “semi-manufactured”, making them subject to duties.
Previously, they were classified as “unwrought, nonmonetary gold” , exempting them from earlier tariff rounds.
---
A Blow to the World’s Largest Refining Hub
The decision follows former President Donald Trump’s broader tariff package on all Swiss goods, announced after rejecting Switzerland’s proposal for a 10% tariff in exchange for \$150 billion in U.S.-bound investment.
Switzerland — the world’s largest gold refining hub — exported roughly $61.5 billion in gold to the U.S. over the 12 months ending June 2025. The new tariff could add nearly $24 billion in duties.
Christoph Wild, President of the Swiss Association of Manufacturers and Traders of Precious Metals, called the ruling “another blow” to Swiss-U.S. gold trade, warning that exports may become “economically unviable”.
---
Market Reaction: Record Gold Prices
The ruling triggered an immediate market shock. Gold futures in New York surged past $3,500 per troy ounce, hitting a record $3,534 on August 8, before pulling back slightly.
Analysts say the rally was driven by both the tariff announcement and gold’s safe-haven appeal amid escalating trade tensions and geopolitical uncertainty.
Some traders described the CBP’s decision as “shocking” and possibly mistaken, predicting legal challenges ahead. The lack of clarity has already caused certain shipments to freeze in transit.
---
The Critical Role of Switzerland in Bullion Logistics
Global bullion trade depends on a triangular supply chain:
Raw gold refined in Switzerland Cast into kilo bars for the U.S. market or 400-ounce bars for London Delivered to satisfy Comex contracts and central bank reserves
This logistical network is now under threat. UBS strategist Joni Teves has questioned whether U.S. gold futures trading can remain viable if tariffs on deliverable products persist.
The Swiss Precious Metals Association noted that the CBP’s clarification applies to all 1kg and 100oz gold bars imported into the U.S. not only those from Switzerland — raising the stakes for global trade flows.
---
Negotiations and Uncertainty Ahead
Switzerland continues to negotiate with Washington to reduce the tariff burden, but uncertainty remains.
The White House is reportedly preparing a clarification on the bullion tariffs that could determine whether the market stabilizes or faces prolonged disruption.
Until then, gold industry players — from major banks to refining houses — are bracing for further volatility, both in pricing and physical supply chains.
---
Keywords: gold market news, Swiss gold bars, U.S. gold tariffs, Comex gold futures, bullion trade, Switzerland gold exports, precious metals refining, gold price surge, macroeconomic analysis.
Excellent profits 200 pips TP on opening session As I mentioned Today's early commentary session:
My strategy is sell from 3402–3405.
Very happy with the profits so far, multiple trades at 3400-3402
I sold GOLD 3402 – 200 PIPS TP
• 1st SETUP of week
Always follow your setup & your path with patience and discipline.
My targets is achieved alhumdullilah.
All I say thanks to those who followed us and made profits.

Gold Technical Analysis - Bearish Bias Below $3,384Gold is currently trading near $3,373 within an ascending channel but showing signs of weakness. A rejection near the $3,384–$3,390 resistance zone could trigger a downside move toward key supports at $3,350, $3,338, and $3,326. If price breaks below the channel midline, bearish momentum may strengthen. However, a bounce from support could push gold back toward the upper range. Keep an eye on breakout zones for the next move.
🔑 Key Levels to Watch
- Resistance: $3,384 → $3,390: Strong resistance zone
- Support: $3,350 → $3,338 → $3,326
- Breakout Zones: Below $3,338: Opens room to $3,310 and below. Above $3,390: May lead to fresh highs toward $3,410+
🧭 Trend Outlook
- Short-Term: Bearish bias within the ascending channel, especially if price breaks below mid-channel.
- Medium-Term: Neutral to bullish as long as the lower channel trendline holds.
- Momentum: Losing bullish momentum; potential for downside correction.
Price is at a decision point within the ascending channel. A clean break below the mid-channel and $3,365 area can accelerate downside correction. Stay alert to key support zones and any reversal signals.
Note
Please risk management in trading is a Key so use your money accordingly. If you like the idea then please like and boost. Thank you and Good Luck!

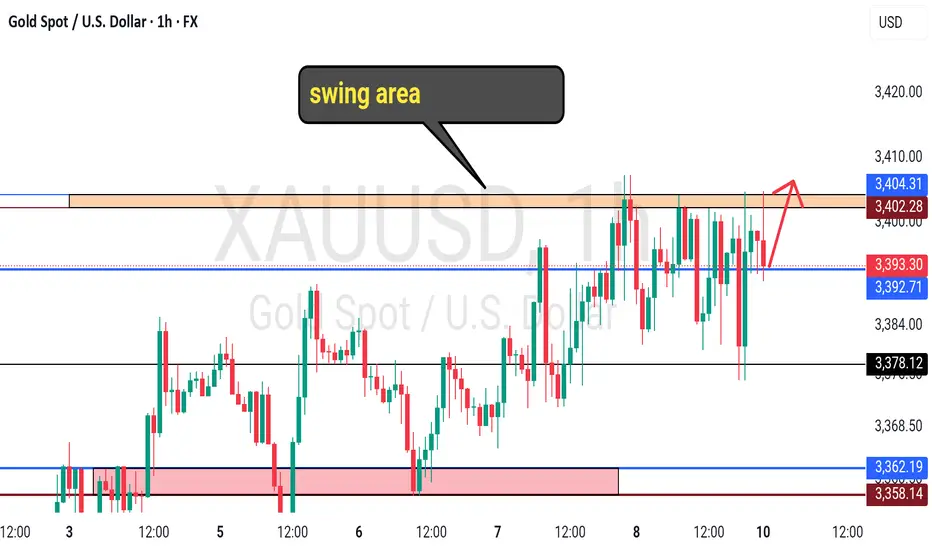
GOLD - at support ? What's next??#GOLD... Perfect move as per our video analysis and now market just at his current immediate supporting level.
That is 3392-93
Keep close and if market hold it in that case we can expect bounce otherwise not..
NOTE: we will go for cut n reverse below 3392-93 on confirmation.
Good luck
Trade wisely
GOLDNext Reaction for Gold will be around 3415-3420. Once we see the reaction then we will wait for the drop.
Disclosure: We are part of Trade Nation's Influencer program and receive a monthly fee for using their TradingView charts in our analysis.

Ready to BUY Gold to target 3445✏️ OANDA:XAUUSD confirms a continued uptrend as it breaks out of the triangle. The price is heading towards 3430 today and even higher at 3445. Today is Friday, the weekly candle close, and according to the range of the candle, it is possible to reach those highs. The BUY strategy can be activated at the moment and hold the position until the US session with the continuous US session buying pressure in recent days.
📉 Key Levels
Support: 3385-3365-3333
Resistance: 3419-3431-3445
Buy trigger: Confirmation of the h4 candle buying pressure above 3385
Buy trigger: Rejection of the support zone at 3365
Target 3445
Leave your comments on the idea. I am happy to read your views.

Bullish momentum remains. New catalysts?Next week's risk events:
1. US July CPI data and Reserve Bank of Australia interest rate decision
2. US July PPI and initial jobless claims
3. US July retail sales, core retail sales, and the University of Michigan preliminary consumer confidence index.
The market will focus on whether the impact of tariffs begins to show up in inflation data and whether consumer spending data confirms economic resilience. A mild reading would reinforce expectations of a rate cut, positive for US stocks and gold. An unexpectedly high inflation rate could delay the Fed's pace of easing, weighing on risk assets and supporting the US dollar.
Gold's continued rise this week is a continuation of the strong non-farm payroll report. Although there have been slight dips along the way, it has stabilized above the mid-line, and the upward resistance has been fluctuating. Therefore, there is a high probability of further breakouts next week.
Judging from the 1-hour line, each decline was not sustained, and then buying intervened and the market began to rise sharply, so the current big cycle is still bullish, but it is not certain that the upward trend will break out next week without a major positive push. Only if it holds above the 3410 level and allows for extended correction time will new momentum emerge next week to continue its breakout trend.
Trading Strategy:
Short around 3405, stop loss at 3415, profit range 3380-3370
Long around 3375, stop loss at 3365, profit range 3390-3400-3410.

EURUSD Analysis week 33🌐Fundamental Analysis
The US Dollar (USD) struggled to find buying momentum on Thursday, but the EUR/USD pair struggled to build upside momentum. The US economic calendar will not release any macroeconomic data that could boost USD valuations over the weekend. Therefore, investors may pay attention to comments from Federal Reserve officials and risk sentiment.
A bullish move on Wall Street after the opening bell could limit the USD’s upside momentum and help the EUR/USD pair find support. Conversely, the pair could continue to decline if the market turns cautious in the second half of the day.
🕯Technical Analysis
EURUSD is still trading in an uptrend and is facing resistance at 1.170. A break above 1.160 forms a lower boundary support zone that should prevent further downside. Pay attention to the resistance and support zones noted on the chart to have a strategy when there is a price reaction in that area.
📈📉KEY LEVEL
Support: 1.160-1.145
Resistance: 1.170-1.181

Will gold test 3500 again next week?
💡Message Strategy
Amidst heightened global economic uncertainty, the gold market has experienced a thrilling roller-coaster ride this week.
Most Wall Street professionals and retail investors are bullish on gold's short-term outlook, with a broad expectation that prices will surge past $3,400 per ounce next week.
This is driven not only by the panic caused by this week's tariff saga but also by upcoming key inflation and consumer data, which are likely to reinforce market expectations of a Federal Reserve rate cut and boost gold's appeal as a safe-haven asset.
📊Technical aspects
Next Week's Market Preparations (Two Directions)
Preparation 1: The US dollar index has been trading at a low level. If it breaks a new low intraday, gold and silver may break out of their two-week range. This presents a relatively certain window for follow-up trading, requiring advance preparation, as the timeframe is short.
Background: Expectations of a rate hike have yet to materialize, and the US dollar index will continue to trade at a low level, providing fundamental support for the highs in gold and silver.
Preparation 2: The trend line pattern at 3300 remains crucial. If it continues above 3300, the highs remain. 3400 is the key integer level for breaking through the range, and a breakout indicates continued upward movement, with the median at 3350.
Background: The high-level market foundation is in place, with bulls primarily attacking above 3350. 3400 signals a range breakout. If a rate hike is implemented, consider revisiting 3300. The 100-point swing range is ample for trading.
Direction 1: The US dollar index breaks below its lows. A break below 3400 could lead to a new high, signaling a continuation of the bullish trend. Maintain a regular position for swing trading. If it breaks through strongly, gold could potentially revisit the 3500 mark.
Direction 2: A rate hike is confirmed, signaling a 3350 level. The trend line at 3300, the depth of which will be reported separately.
💰Strategy Package
Long Position:3375-3385,SL:3355,Target: 3420-3440

GoldXau usd daily analysis
Time frame 4hours
Risk rewards ratio =2
I think we can have good benefits in this time
Gold is moving up and down a d we can open long position in the position close to support line

Gold is consolidating. Can it break out again?Information Summary:
Focus on US inflation data: The US will release July's Consumer Price Index (CPI) on Tuesday, followed by the Producer Price Index (PPI) on Thursday. Economists expect the CPI, excluding volatile food and energy components, to rise 0.3% month-over-month in July, accelerating from a 0.2% increase the previous month.
Quaid believes that if this week's inflation data slightly exceeds market expectations, it could help the Federal Reserve temper market expectations for a September rate cut, which would be negative for gold.
Recently, due to a weaker-than-expected US jobs report, most traders have begun increasing their bets on a September rate cut. Gold typically performs well during periods of economic uncertainty and low interest rates.
Market Analysis:
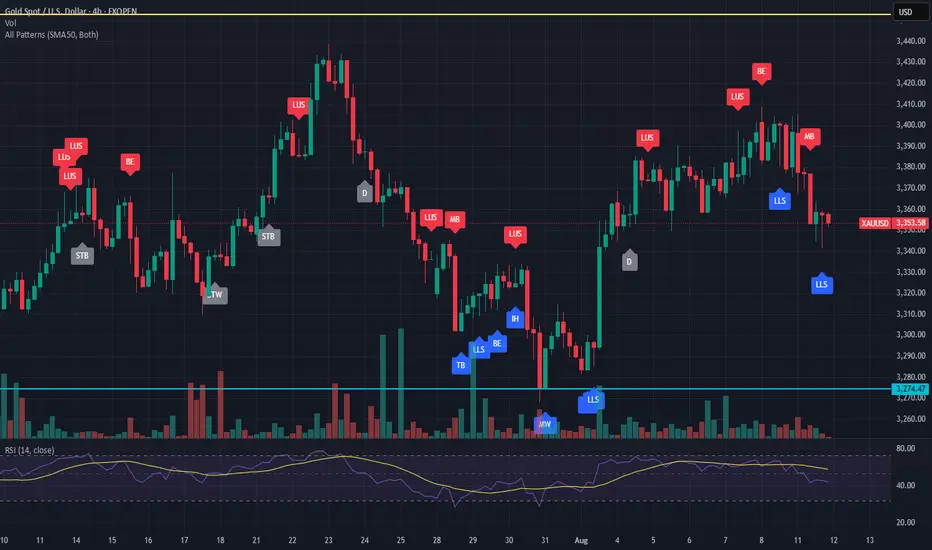
The daily gold chart shows that gold is trading near its 20-day moving average, while the bullish 100-day moving average has lost momentum and is currently near 3290. If gold prices continue to fall, this moving average will provide dynamic support. Meanwhile, technical indicators have crossed above their midlines and have a firm downward slope, reflecting ongoing downward pressure and suggesting lower lows ahead.
The 4-hour gold chart shows that technical indicators are well below their midlines, maintaining a downward trend, with the Relative Strength Index (RSI) nearing oversold levels, suggesting a bearish near-term outlook for gold. Meanwhile, gold prices have fallen below both their 20-period and 100-period moving averages, with the former gaining downside traction and currently trading around 3378. Gold is finding some near-term support at the directionless 200-period moving average. If gold prices break clearly below the 200-period MA, it should open the doors for a bearish extension in the coming sessions.
Key Levels to Watch:
Support: 3340, 3320, 3310.
Resistance: 3355, 3370, 3380.

XAUUSD Analysis – August 12 – 4H ChartOn the 4H timeframe, gold is forming a Bullish Harmonic structure (likely a Gartley or Bat pattern), with point D appearing around the strong support zone 3,349 – 3,346 USD, aligning with the 0% Fibonacci level and previous swing low.
1. Technical Breakdown
Harmonic Pattern:
A → B: Strong bearish leg.
B → C: Retracement to the 61.8 – 78.6% Fibo zone.
C → D: Decline to the 88.6 – 100% Fibo zone, touching a strong support area and giving potential reversal signals.
Fibonacci Retracement Key Levels:
50%: 3,352 USD.
61.8%: 3,353 – 3,354 USD.
78.6% – 88.6%: 3,355 – 3,356 USD (near-term resistance target).
Volume: Bullish wick candles at point D with higher volume, indicating bottom-picking activity.
EMA: Price is currently testing the short-term EMA; a successful breakout could open the way toward higher resistance levels.
2. Trading Scenarios
Scenario 1 – Buy following the Harmonic pattern (Preferred):
Entry: 3,349 – 3,350 USD.
Stop Loss: 3,343 USD (just below point D by ~6–7 USD).
TP1: 3,352 USD (Fibo 50%).
TP2: 3,355 USD (Fibo 61.8%).
TP3: 3,358 USD (major resistance + Fibo 78.6%).
RRR: ~4.8 as seen on the chart, suitable for short-term swing setups.
Scenario 2 – Sell against the pattern (High Risk):
Only consider if price breaks strongly below 3,343 USD with high volume.
Target: 3,338 – 3,335 USD.
3. Key Notes
Prioritize buying as long as price holds above point D with bullish confirmation on H1–H4 timeframes.
If price rallies but fails to break above 3,355 USD, consider partial profit-taking and moving SL to breakeven.
Risk management: limit to 1–2% per trade, avoid FOMO entries.

Gold prices fluctuated significantly. Here comes the analysis.Last week's volatile rise in gold wasn't entirely smooth, with several minor pullbacks. However, each pullback was relatively limited, and upward momentum quickly resumed, resulting in an overall step-by-step upward trend. This trend shows that the bulls had a certain advantage at the time and buying was relatively active.
But the market situation on Monday took a fundamental turn. After the Asian market opened, the price of gold began to fall under pressure, with selling pressure continuing to emerge during the session and buying power clearly insufficient. By the close of trading, prices had fallen sharply, not only giving up all of last week's gains but also breaking through multiple moving average support levels in one fell swoop. From a technical perspective, the uptrend line on the daily chart has been effectively broken, signaling the initial formation of a short-term downtrend and a clear sign of weakening.
On Tuesday, watch closely to see if the downtrend continues.
If the price can find support near yesterday's low of 3341 and rebound above it, then we need to pay attention to the resistance near 3365, 3375 and 3385 on the upside.
If the market continues to fall, then the support around 3340 and 3330 should be watched below. This range is the second rising position after the impact of non-farm payroll data.
Strategy:
Short around 3365, stop loss at 3375, profit range 3340-3320
Long around 3330, stop loss at 3320, profit range 3340-3465

Gold long and short two-way layout ideasI write every article hoping to connect with those I'm connected with. I hope to help investors in need. Regardless of initial impressions, I should give them a chance to understand me. I believe that the fact you've read all this is fate, and investing is largely about fate. If you believe in fate and believe I can do something for you, you might want to talk to me.
Gold has been falling steadily today. Technically, the hourly moving average is turning upwards from its highs. This suggests a potential short-term rebound for gold bulls, and they may need significant news to stimulate their decline. Otherwise, they may struggle to achieve significant gains in the short term. With this hourly decline, there's little chance of a major rebound. The key level for gold remains around 3365-3380. After all, previous support levels have become resistance levels. If your current trading isn't ideal, I hope I can help you avoid investment setbacks. Feel free to discuss your options.
From the perspective of the 4-hour cycle structure, the lower support is focused on the 3340-3330 area, which is an effective support zone that has been verified many times; the upper resistance is focused on the 3365-3380 area, which may form a key suppression level in the short term. In terms of operation ideas, we should maintain a two-way strategy of shorting on rebounds and going long on pullbacks. According to the changes in the shape and momentum of prices touching key positions, we should flexibly adjust the entry direction, specific execution points and risk control plans. I will remind you as soon as the market touches key areas, so please pay attention in time.
Gold Trading Strategy:
1. Short gold in batches when it rebounds around 3365-3380, targeting 3350-3340.
2. Go long on gold when it falls back to around 3340-3330, with the target at 3355-3360.

Gold is plummeting. Will CPI turn the tide?CPI data is due to be released on Tuesday, US time. Ahead of the release, gold saw a significant sell-off. In early Asian trading, gold plummeted from its high near 3400, continuing its decline in European and US trading, currently hitting a low near 3341.
Monday's sharp drop inevitably raises the question of a rebound on Tuesday. If the market continues to fall, will the CPI data support a rise in gold on Tuesday?
3345 currently represents a significant support level for gold. If it fails to break below 3345, it is likely to consolidate between 3345 and 3370 before the CPI data is released.
Conversely, if it falls below 3345, caution is raised about the possibility of gold testing 3330 again. Therefore, gold may remain volatile between 3330 and 3350 before the data release, awaiting further guidance from the CPI data.
Quaid believes that traders can pay attention to the important position of 3345. If it falls below 3345 again, it is likely to reach 3330. Then everyone can pay attention to the fluctuations in the 3330-3345 range.

GOLD Touches the Order blocks and does a little retracement.Gold is stuck in some range bond and is still not able to break 3500. Watch the DXY and be very careful when it breaks the supports or resistances. Can be fake-outs. Check your support and resistances and open positions accordingly. Wait for Price Again and strong solid breakouts to enter the market.
Disclaimer:
The content presented in this IMAGE is intended solely for educational and informational purposes. It does not constitute financial, investment, or trading advice.
Trading foreign exchange (Forex) on margin involves a high level of risk and may not be suitable for all investors. The use of leverage can work both for and against you. Before deciding to participate in the Forex market, you should carefully consider your investment objectives, level of experience, and risk tolerance.
There is a possibility that you may incur a loss of some or all of your initial investment, and therefore, you should not invest money that you cannot afford to lose. Be fully aware of all the risks associated with foreign exchange trading, and seek advice from a licensed and independent financial advisor if you have any doubts.
Past performance is not indicative of future results. Always trade responsibly.