The weekend closed higher to around 3360
📌 Driving Events
Gold prices (XAU/USD) were on track to rise for the third consecutive day on Friday, climbing to the upper limit of this week's trading range as escalating trade tensions fueled safe-haven demand. Amid a significant intensification of global trade disputes, U.S. President Donald Trump this week sent formal notices to multiple trading partners detailing individual tariff rates that will take effect on August 1 if no agreement is reached. This has disrupted investor sentiment, weighed on risk assets, and provided solid support for gold.
Meanwhile, expectations of an imminent rate cut by the Federal Reserve (Fed) have cooled after last week's strong U.S. jobs data. As a result, the U.S. dollar (USD) remained firm, holding near more than two-week highs set on Thursday. A stronger dollar could limit upside for the non-yielding gold in the short term. Therefore, traders could look for a sustained breakout before going further bullish on the XAU/USD pair.
📊Personal comments:
Gold price broke through 3330, maintained good buying pressure, and rebounded over the weekend
⭐️Set gold price:
🔥Sell gold area: 3367-3369 SL 3374
TP1: $3355
TP2: $3342
TP3: $3325
🔥Buy gold area: $3306-$3308 SL $3301
TP1: $3315
TP2: $3325
TP3: $3338
⭐️ Note: Labaron hopes that traders can properly manage their funds
- Choose a lot size that matches your funds
Goldprediction
The price fell back. Watch out for a breakthrough.After reaching the resistance position near 3345 predicted by Quaid, the price fell back slightly, and the price fluctuated around 3335 so far.
From the hourly chart, before the price stabilizes at 3345, it is likely to maintain a range of 3330-3345. 3330-3345 is a temporary range. If it stands firm and breaks above 3345 again, the fluctuation range will become 3345-3360.
On the contrary, if it falls below 3330, the range may drop to 3320-3330. However, as long as the downward trend does not fall below 3320, gold will still maintain a bullish trend. If the price breaks down below 3320, today’s trend will be reversed.
As long as it is above 3320, gold will maintain a bullish trend today.
On the last trading day of this week, I wish all traders a good harvest.

Go long when the trend reverses, beware of black swansYesterday's pullback to 3313-3310 confirmed the upward trend of gold. As I expected, it broke through the resistance of 3330 and touched around 3345. Currently, the short-term strong resistance is at 3345. Only by breaking through this resistance can gold maintain its upward trend. If it is blocked near the 3345 line in the short term, there is a possibility of a pullback. If 3345 breaks, there will be 3365 and 3400 above. Once the direction is clear, it will be easier to act. If there is a pullback during the day, it will give us a trading opportunity to enter the long position.
OANDA:XAUUSD

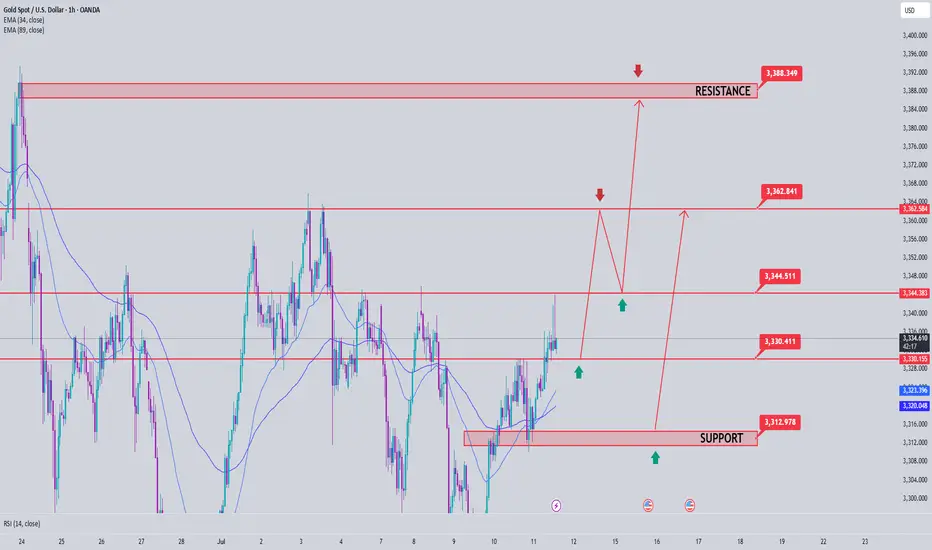
Gold Price Analysis July 11Gold price today continues to maintain a strong upward momentum after breaking the previous support trendline (gold wire). Currently, SELL orders should only be considered as short-term response transactions, with priority given to monitoring to join the main trend.
✅ Trend: Up has been confirmed, the nearest target is towards the 3390 area today.
🔑 Key Levels:
Support: 3330 – 3314
Resistance: 3345 – 3362 – 3388
🎯 Trading strategy:
SELL activation: Watch the 3345 area, only SELL when there is a price rejection signal with a confirmation of a decrease.
Potential SELL area: 3362 – 3387 (strong resistance).
BUY Activation: Look for buying opportunities at support 3330 – 3314 if there is a clear bullish reversal signal.
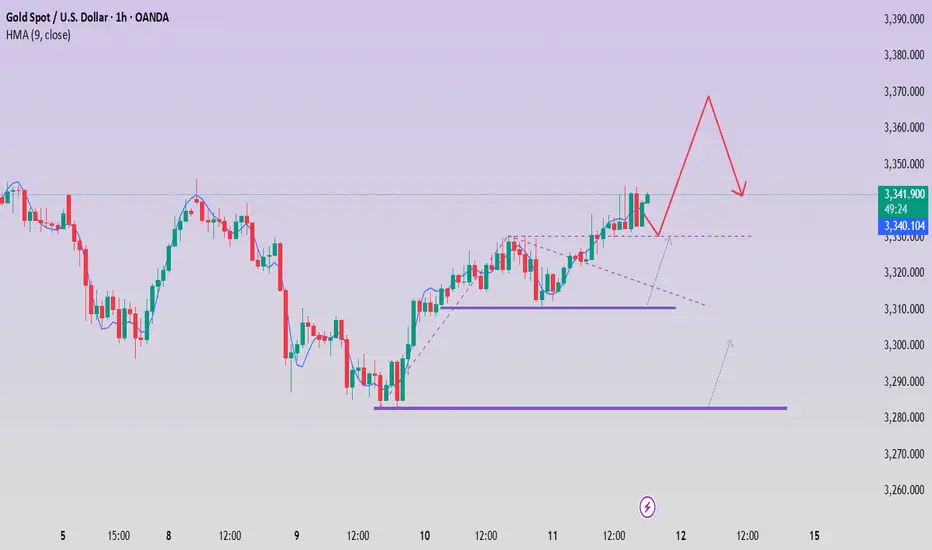
Gold Short Term OutlookGold has extended its recovery after reclaiming both the 50MA and 200MA, now trading just below the $3,341 resistance. Price has broken out of the short-term descending channel and is showing early signs of bullish continuation.
A confirmed break and hold above $3,341 would open the path toward the next resistance cluster at $3,356–$3,370, followed by $3,383.
If price rejects this resistance and pulls back, the $3,328–$3,313 area will be key to maintain the bullish structure. Below that, focus returns to the $3,300 level and the broader Support Zone.
📌 Key Levels to Watch
Resistance:
‣ $3,341
‣ $3,356
‣ $3,370
‣ $3,383
Support:
‣ $3,328
‣ $3,313
‣ $3,300
‣ $3,267
⚠️ It’s Friday! Stay sharp and manage your risk.
BTCUSD Heading Yesterday's Resistance Zone, Price Will React After a recovery to 107.500 BTCUSD is recovering to the upside again towards the resistance of 1.09500. This is the convergence zone between the trendline and yesterday's high. BTCUSD price may correct lower from this zone. Then find some new bullish momentum at strong support zones towards an all-time high.
Support 107.500 - 105.300
SELL Trigger: Break bellow 107.500
Resistance: 109.500- 110.500
Wish you successful trading, leave your comments about BTC.

Everybody loves Gold Part 7Great trading last week. Gold really pushing deep into blues.
This week takes a downturn with possibilities highlighted on the chart; all pointing towards LOS (Level of significance). This level is calculated based on previous week high-low values.
Trade parameters:
1. SL: 50-100pips
2. TP: 3-4x SL
3. double tops/bottom (around LOS) are direction changers.
As always price action determines trades

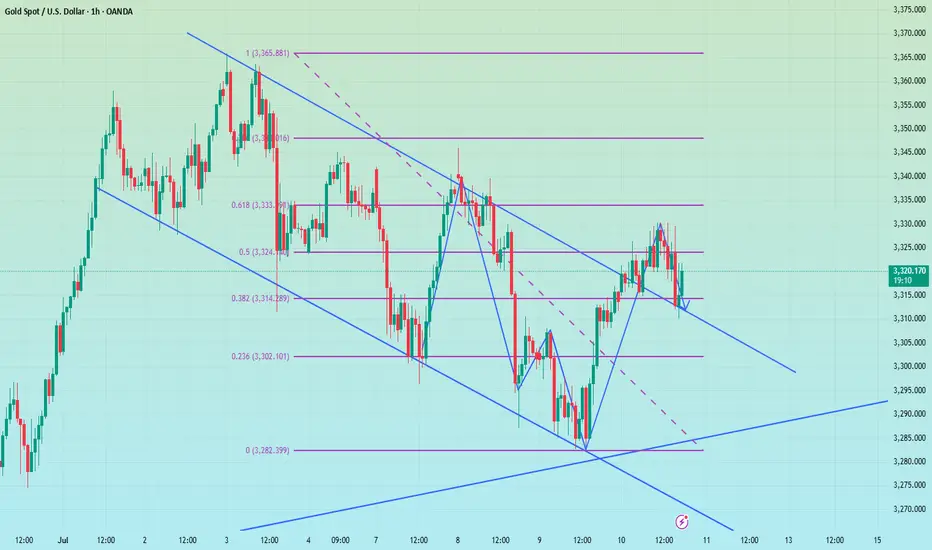
Gold price surge, today will have a decline✏️ OANDA:XAUUSD The recovery of the D1 candle and the closing candle above 3313 means that the market's downtrend has almost been broken.
The reaction at the current trendline 3284 is still very strong. The price is strongly supported by the buyers, causing gold to return to trading in a wide range.
The 3328 zone will be important in the near future. If it does not break, there will be a decline to the Gap price zone this morning. Trading according to the top-bottom method is suitable for the current market.
Support: 3312-3295-3279
Resistance: 3328-3339-3349-3363
Sell trigger: rejection from 3328–3,340 resistance block
Target: 3295 Support zone, followed by 3279 lower zone
Leave your comments on the idea. I am happy to read your views.

Gold Price Analysis July 10🔹 XAUUSD Analysis – D1
Yesterday's D1 candle showed a strong recovery, closing above 3313, thereby significantly weakening the previous downtrend structure. Currently, the price is reacting very strongly at the trendline around 3284. Buying pressure is clearly appearing, pushing gold back to trading in a wide range.
In the short term, the 3328 area will play an important resistance role. If the price cannot break this area, the possibility of a correction down to the Gap price area this morning is quite high. The peak-bottom trading method is still giving suitable signals in the current market context.
🔹 Important zones:
Support: 3312 – 3295 – 3279
Resistance: 3328 – 3339 – 3349 – 3363
💡 Strategy:
Confirm the trading signal when the price clearly rejects the resistance zones to ensure the highest winning rate.

Gold is fluctuating. Can it break through?Since the price of gold rose to 3500 on April 22 and encountered resistance and fell back, it has shown a triangular convergence and fluctuation trend so far. From the short-term trend, after the decline adjustment on Tuesday, it bottomed out and rebounded on Wednesday to close with a positive line, and on Thursday it completed the shock consolidation with a small positive line. The current moving average system is in an intertwined state, and the short-term market tends to fluctuate.
Today, we need to pay attention to the resistance of the 3340-3345 range. This position is a high point concentration area that has suppressed the upward movement of gold prices many times in the early stage. If the gold price breaks through this range, the bullish trend is expected to continue.
From the current trend, after the gold price bottomed out and rebounded, it formed a short-term support at 3310. Secondly, we need to pay attention to the support strength near the low point of 3282 on Tuesday. In terms of operation, it is still necessary to operate around the range.
Operation strategy:
Short when the price rebounds to around 3345, stop loss at 3355, profit range 3320-3300
Long when the price falls back to around 3310, stop loss at 3300, profit range 3320-3340

Gold is in the bullish direction after correcting the supportHello Traders
In This Chart GOLD HOURLY Forex Forecast By FOREX PLANET
today Gold analysis 👆
🟢This Chart includes_ (GOLD market update)
🟢What is The Next Opportunity on GOLD Market
🟢how to Enter to the Valid Entry With Assurance Profit
This CHART is For Trader's that Want to Improve Their Technical Analysis Skills and Their Trading By Understanding How To Analyze The Market Using Multiple Timeframes and Understanding The Bigger Picture on the Charts

Gold is in the Bearish direction from a Support levelHello Traders
In This Chart GOLD HOURLY Forex Forecast By FOREX PLANET
today Gold analysis 👆
🟢This Chart includes_ (GOLD market update)
🟢What is The Next Opportunity on GOLD Market
🟢how to Enter to the Valid Entry With Assurance Profit
This CHART is For Trader's that Want to Improve Their Technical Analysis Skills and Their Trading By Understanding How To Analyze The Market Using Multiple Timeframes and Understanding The Bigger Picture on the Charts

GOLD XAUUSD TODAYGOLD XAUUSD TODAY is still bearish.
I have to ways
1. Entry now and SL above today's high.
2. If break high. wait for next SSM reversal

GOLD ROUTE MAP UPDATEHey Everyone,
Another PIPTASTRIC day on the markets with our chart idea and levels playing out and being respected, as analysed.
After completing the swing range test and full swing into 3306, we stated yesterday that we will now look for ema5 cross and lock above 3306 to open 3330. This was locked and loaded and completed the 3330 target today.
We will now continue to look for ema5 lock above 3330 for a continuation into the bullish targets above or failure to lock will see rejections into the lower Goldturns for support and bounce inline with our plans to buy dips.
We will keep the above in mind when taking buys from dips. Our updated levels and weighted levels will allow us to track the movement down and then catch bounces up.
We will continue to buy dips using our support levels taking 20 to 40 pips. As stated before each of our level structures give 20 to 40 pip bounces, which is enough for a nice entry and exit. If you back test the levels we shared every week for the past 24 months, you can see how effectively they were used to trade with or against short/mid term swings and trends.
The swing range give bigger bounces then our weighted levels that's the difference between weighted levels and swing ranges.
BULLISH TARGET
3358
EMA5 CROSS AND LOCK ABOVE 3358 WILL OPEN THE FOLLOWING BULLISH TARGETS
3389
EMA5 CROSS AND LOCK ABOVE 3389 WILL OPEN THE FOLLOWING BULLISH TARGET
3416
EMA5 CROSS AND LOCK ABOVE 3416 WILL OPEN THE FOLLOWING BULLISH TARGET
3439
BEARISH TARGETS
3330 - DONE
EMA5 CROSS AND LOCK BELOW 3330 WILL OPEN THE FOLLOWING BEARISH TARGET
3306 - DONE
EMA5 CROSS AND LOCK BELOW 3306 WILL OPEN THE SWING RANGE
3283 - DONE
3254
As always, we will keep you all updated with regular updates throughout the week and how we manage the active ideas and setups. Thank you all for your likes, comments and follows, we really appreciate it!
Mr Gold
GoldViewFX

XAUUSD - 4H Bearish Rejection from Supply Zone | SMC AnalysisGold is showing signs of weakness after reacting strongly from a 4H Supply Zone around the 3331.72 level. Price tapped into the red supply zone, failed to break above, and is now forming lower highs — suggesting bearish momentum is building.
🔍 Key SMC Observations:
Supply Zone: Price rejected the 3331.72 level, which acted as a clear supply area based on past liquidity grabs and bearish institutional moves.
Change of Character (CHoCH): We saw a CHoCH around July 5th–6th, indicating a shift from bullish to bearish order flow.
Lower High Formation: Price failed to make a new high after tapping supply, showing signs of distribution.
Imbalance + Target Zone: Clean imbalance exists down to 3288.73 and potentially to the green demand zone around 3260–3270.
📍Trade Setup Idea:
Sell Opportunity: If price continues to reject the supply zone, look for bearish confirmation on the lower timeframes (e.g., 1H) to enter.
Target 1 (TP1): 3288.73 (near-term liquidity level)
Target 2 (TP2): 3260–3270 demand zone
Invalidation: A break and close above 3331.72 would invalidate the short-term bearish bias.
🔴 Watch for reaction around 3288.73 – if it holds, expect a possible bounce. If broken, further downside is likely.

Night range operation, technical outlook is still bearishGold fell as expected after repeated battles at 3330. Currently, gold has returned to around 3320. This shows that the rebound was mainly driven by short-term risk aversion. As market news calms down and sentiment stabilizes, the market will most likely return to the technical trend. If it unexpectedly breaks through 3330, it is expected to touch the 3345 line I mentioned this morning. The short-term 3310 line currently has certain support. From a technical point of view, I prefer to short. Once it falls below 3310, the subsequent support will move to 3295-3285. Therefore, I think it is a good choice to short again at 3320-3330.
OANDA:XAUUSD
Bearish is still the main trend, first test 3250 supportYesterday, as the market expected a trade agreement to be reached between the US and its trading partners, risk sentiment was boosted. The strengthening of DXY and the rise in US Treasury yields put some pressure on gold.
On Monday, gold rebounded to 3320, and on Tuesday it touched above 3320 and began to fall sharply. In the short term, 3320 is a key trading position that we need to pay attention to. From the daily chart, the support line of 3320 has been completely broken, and the two major support points below are 3250 and 3200 respectively. Judging from the 4H chart, the decline may have just begun. Next, we may first face a test of the 3250 support line. If the 3250 support can be maintained, gold will maintain a volatile consolidation in the short term. Otherwise, if it falls below 3250, it will test the 3200 mark.
OANDA:XAUUSD
Perfect prediction, pay attention to the high short entry pointTrump extended the tariff agreement to August 1 and began to collect tariffs again. Although it eased market tensions, his remarks will not be extended after the expiration, and he issued a tariff threat, which increased global trade uncertainty and pushed up risk aversion. There was no clear direction coming out of the Fed's meeting minutes last night, but the potential bias was bullish.
At the beginning of the Asian session this morning, I also indicated that gold would rise and then fall. At present, it has reached the highest point near 3325 and then began to retreat, but the 4H golden cross has just been formed. There is still a certain pressure above 3333. If the gold price repeatedly competes for this position, we can continue to short without hesitation. The second short position today is near 3340-3345. There is potential momentum for the bulls in the short term. If the European session continues to fluctuate below 3333, then the entry of short positions will be slightly more stable. Yesterday, short orders were given at the key points of 3321 and 3333, and TP looked at 3310. If the bulls re-emerge below 3310-3305, you can consider short-term long positions and target 3330-3335.

Gold rebounds as expected, NY focuses on the Fed meeting📰 News information:
1. Federal Reserve meeting minutes
📈 Technical Analysis:
Gold fell into a narrow range of fluctuations during the European trading session. As I said this morning, gold is expected to rebound in the short term and the bullish momentum needs to be released. From a technical perspective, the overall market is still in a volatile pattern. The support at the 3280 level below is still a key point that needs attention in the short term. The European session has repeatedly tested this area. If it falls below this support, it is expected to touch the 3250 level as I said. While guarding against gold diving during the NY session, the upper resistance of 3315-3321 cannot be ignored to prevent bullish retaliation.
🎯 Trading Points:
SELL 3315-3321-3333
TP 3300-3290-3280-3250
In addition to investment, life also includes poetry, distant places, and Allen. Facing the market is actually facing yourself, correcting your shortcomings, facing your mistakes, and exercising strict self-discipline. I share free trading strategies and analysis ideas every day for reference by brothers. I hope my analysis can help you.
OANDA:XAUUSD PEPPERSTONE:XAUUSD FOREXCOM:XAUUSD FX:XAUUSD FXOPEN:XAUUSD TVC:GOLD
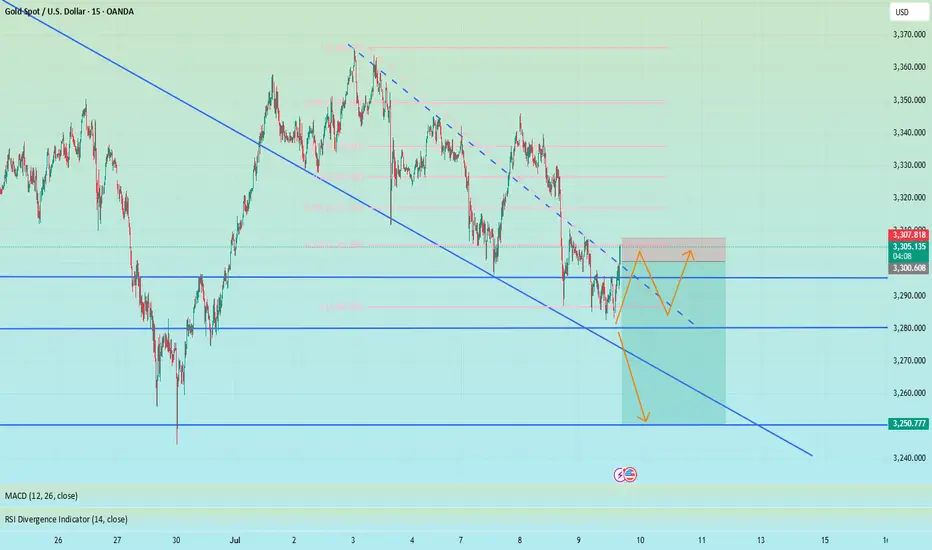
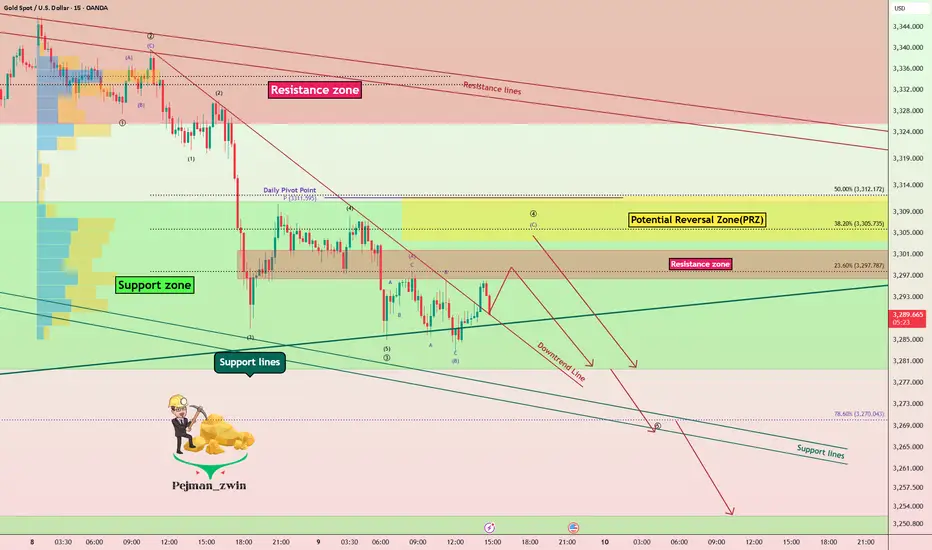
Support Under Siege – Is Gold Ready for Another Leg Down?As I expected in the previous idea , Gold ( OANDA:XAUUSD ) rose to $3,343 on the 1-hour time frame , but failed to break the Resistance zone($3,350-$3,326) and started to fall with relatively good momentum .
Do you think Gold can finally break the Support zone($3,312-$3,280) and Support lines , or will it rise again?
Gold is currently trading in the Support zone($3,312-$3,280) and near the Support line s. It has also managed to break the downtrend line .
In terms of Elliott Wave theory on the 15-minute time frame , Gold appears to be completing a main wave 4 . The main wave 4 appears to follow Double Three Correction(WXY) . Also, the main wave 3 is extended due to the high downward momentum.
I expect Gold to start falling again by entering the Potential Reversal Zone(PRZ) or Resistance zone($3,302-$3,296) and eventually breaking the Support zone($3,312-$3,280) and Support lines, Gold's falling targets are clear on the chart.
Note: Stop Loss (SL) = $3,313
Gold Analyze (XAUUSD), 15-minute time frame.
Be sure to follow the updated ideas.
Do not forget to put a Stop loss for your positions (For every position you want to open).
Please follow your strategy; this is just my idea, and I will gladly see your ideas in this post.
Please do not forget the ✅ ' like ' ✅ button 🙏😊 & Share it with your friends; thanks, and Trade safe.
XAUUSD:Wait for 3315-19 to go long.
The market is experiencing short-term narrow-range fluctuations. There is a certain level of pressure at 3330. I tend to view it more positively as a breakthrough.The trading range for today has narrowed.
Trading Strategy:
BUY@3315-19
TP3329-34
I will closely follow up on every trading strategy I develop. If you are unsure about how to conduct a trade, you can simply come to me for help.
More detailed strategies and trading will be notified here ↗↗↗
Keep updated, come to "get" ↗↗↗
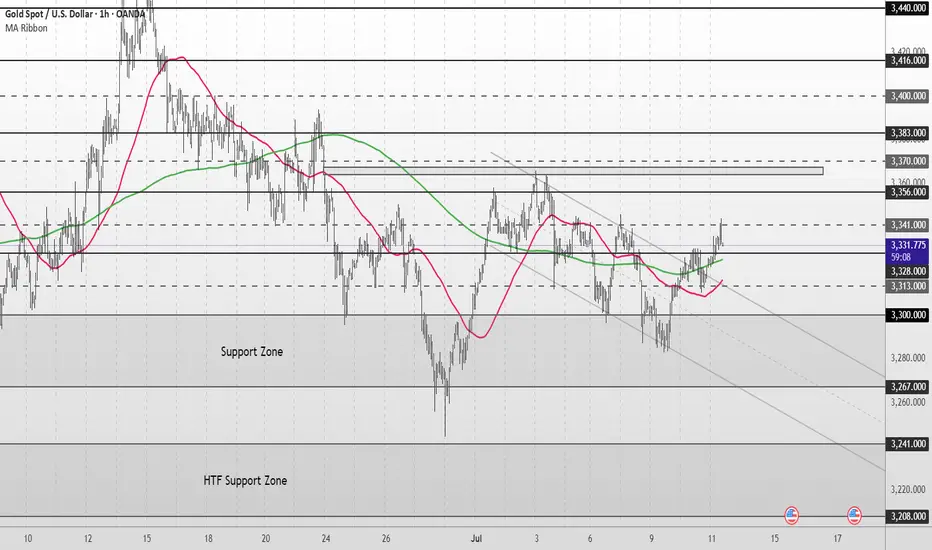
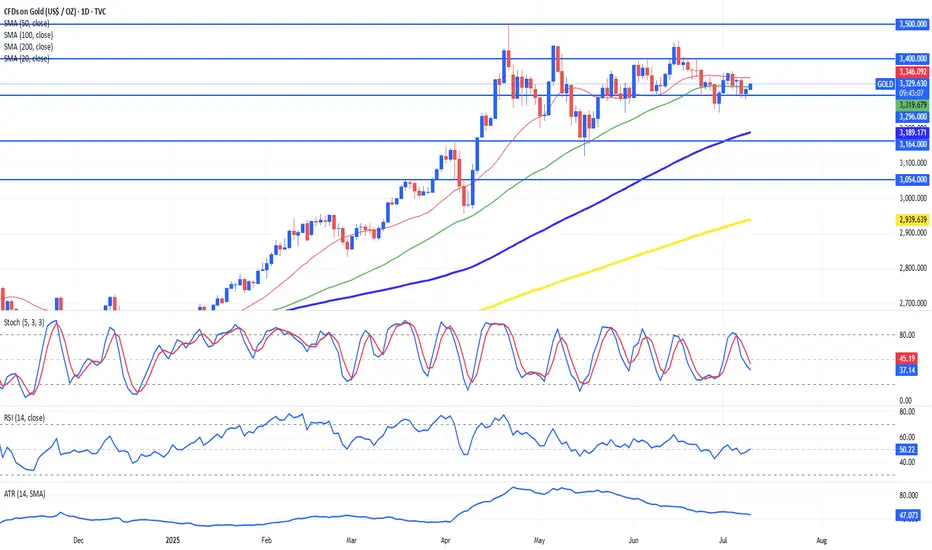
Gold Stuck in Neutral: Range Trading PersistsSince its impressive rally towards $3,500 earlier this year, Gold (XAUUSD) has settled into a consolidation phase, oscillating steadily between $3,250 and $3,400. Prices have consistently gravitated towards the 20-period SMA, reflecting a neutral sentiment among traders. Despite staying above key trend supports (50- and 200-period SMAs), gold has lacked sustained directional momentum.
Technically, indicators confirm this balanced outlook. RSI remains neutral around 49, indicating evenly matched bulls and bears, while the stochastic oscillator similarly shows neither oversold nor overbought conditions. A declining ATR highlights reduced volatility, signaling cautious market participation. Critical near-term support lies at $3,164 and $3,054, while resistance holds firm at $3,296 and $3,400. Traders should anticipate continued mean reversion and look to fade extremes within this established range.
Fundamentally, Gold faces competing drivers. Geopolitical uncertainties and central bank diversification away from the U.S. dollar provide bullish tailwinds. Conversely, resilient U.S. economic data periodically boosts the dollar, restricting gold’s upside potential. Traders should monitor this week's Fed minutes closely, as surprises here could trigger volatility or even a breakout scenario toward $3,500 or a deeper correction below $3,164. For now, expect gold to remain range-bound, reacting sensitively to headlines and macroeconomic cues.
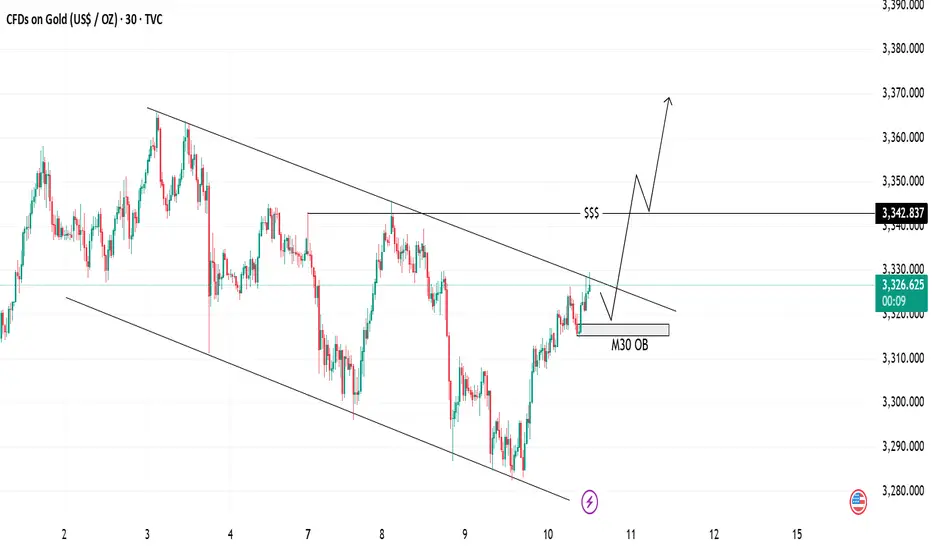
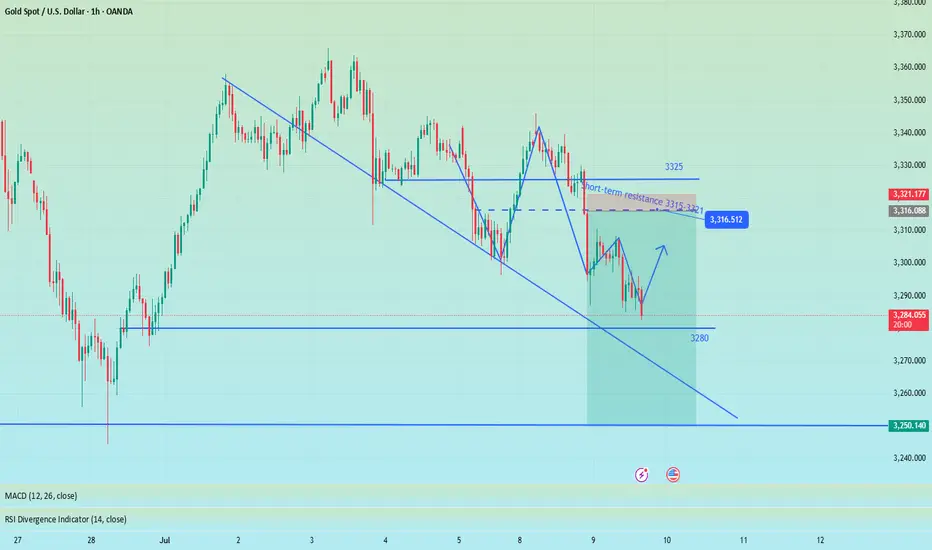
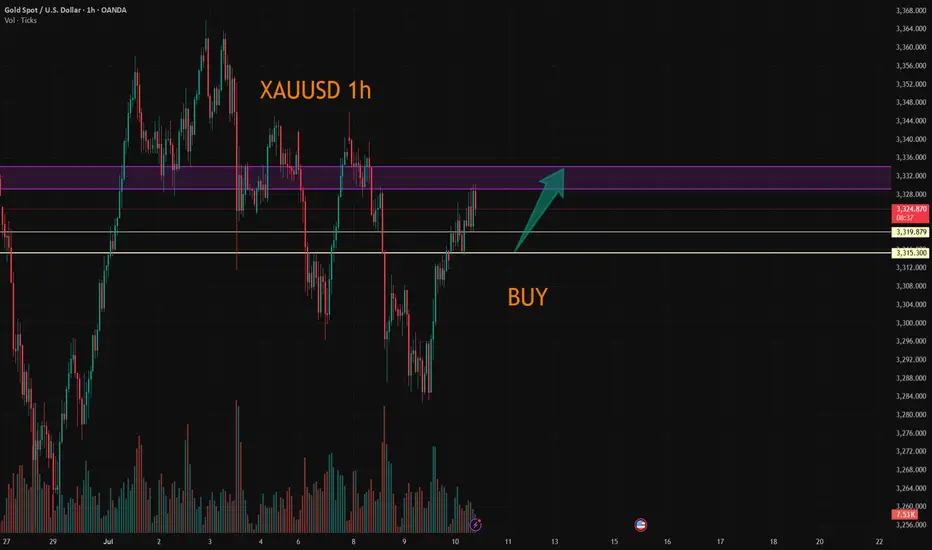
Gold Analysis Bullish Breakout | Trendline & OB Setup📈 Gold Analysis
We are currently seeing price action within a descending channel, testing key support at the M30 OB (Order Block). The price is pushing higher after bouncing off the support level, and the trendlines suggest a potential breakout to the upside.
💡 Key Levels:
Support Zone: 3326
Resistance Zone: 3342
The market is primed for a possible rally, indicated by the upward momentum and price breaking out above the trendline. Watch for confirmation as we approach the liquidity level for further bullish movement.
⚡ Trade Idea: Look for a long entry if price closes above the trendline for a continuation towards the next resistance.