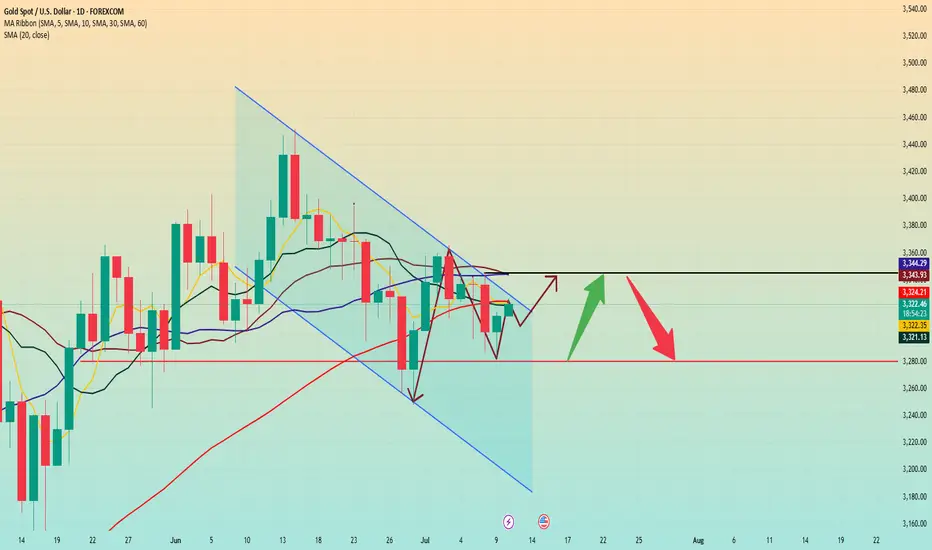
XAUUSD Idea: 4H Trendline First Breakout - Liquidity PlayFOREXCOM:XAUUSD
🔍 Analysis Overview:
Price has just broken above a 4H descending trendline for the first time. However, I remain cautious due to the following key observations:
📌 NOTES:
The broader market sentiment is still bearish due to recent tariff-related news, which often fuels risk-off behavior.
Historically, the first breakout of a strong trendline often fails, trapping early buyers.
This breakout is likely attracting buy-side liquidity, giving institutions an opportunity to hunt stops.
My observation shows buying interest started around the 3308–3313 range, suggesting smart money accumulation and a possible trap.
📉 I'm watching for a fake breakout and potential reversal targeting the liquidity zones marked below around 3307 and possibly lower.
The liquidity sweep below equal lows could offer a better risk-reward setup.
💡 Conclusion:
If price fails to hold above this breakout and shows signs of rejection, I will be anticipating a return towards the previous demand zone for a liquidity grab.
#XAUUSD #GoldAnalysis #SmartMoneyConcepts #LiquidityGrab #ForexTrading #TrendlineBreak #MarketPsychology #TradingSetup #SMC #PriceAction
Goldprediction

XAUUSD Loses Short-Term Support – Deeper Decline May FollowAt the current moment, gold (XAUUSD) has made a significant breakout, surpassing the key resistance zone at 3,326 USD and is now trading around 3,328.94 USD. This breakout confirms that the short-term bullish trend remains strong.
1. Short-Term Trend: Bullish Momentum Expands
After holding the key support zone around 3,311 – 3,315 USD (aligned with the 0.618 Fibonacci retracement), XAUUSD bounced back and broke above the previous high at 3,326 USD. The current uptrend is confirmed by higher lows and a clear breakout candle from the recent consolidation.
2. Updated Support and Resistance Zones:
Immediate Support: 3,318 – 3,320 USD, near the rising yellow trendline and breakout retest zone.
Next Resistance Target: No clear barrier on the 15-min chart, but psychological levels and Fibonacci extensions suggest 3,332 – 3,335 USD could act as the next upside targets.
3. Price Action Highlights:
The breakout candle closed strongly above the 3.618 Fibonacci extension level (3,326.26 USD), showing solid buying pressure.
A bullish signal ("B") from LuxAlgo was triggered near the minor pullback at 3,318 USD, adding further confirmation.
4. Key Technical Signals:
Price has broken out of the purple rectangle consolidation zone, expanding its trading range.
The 0.618 Fibonacci level at 3,311.78 USD continues to act as firm support.
The ascending yellow trendline remains intact, providing dynamic support to the bullish trend.
5. Suggested Trading Strategy:
Buy on Pullback: Consider long positions around 3,318 – 3,320 USD if price retests this zone with bullish confirmation.
Breakout Continuation Buy: A firm close above 3,330 USD with high volume could signal a move toward 3,335 – 3,340 USD.
If price falls below 3,315 USD and closes weakly, the bullish momentum may begin to fade.
XAUUSD is in an extended bullish phase after breaching the 3,326 USD resistance. As long as price holds above the 3,318 – 3,320 USD zone, there is room for the uptrend to continue.
Do you think gold will break above 3,330 USD? Drop your thoughts in the comments and let’s discuss trading strategies together!

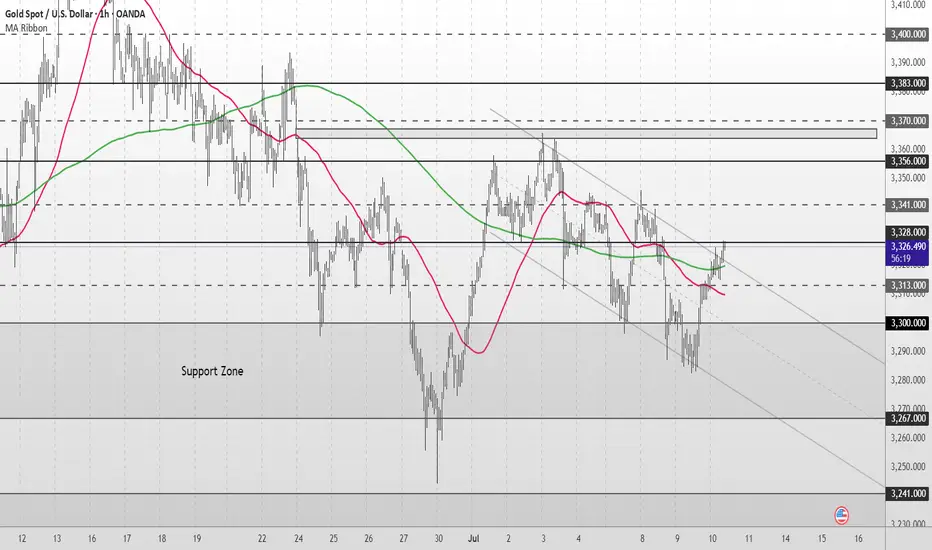
Gold Short Term OutlookGold continues its short-term recovery after bouncing from the Support Zone and reclaiming the $3,300 level. Price is now testing the $3,328 resistance zone, with both the 50MA and 200MA converging just below price.
A confirmed break and hold above $3,328 would open the door to higher resistance levels. However, failure to clear this zone could lead to a retest of the Support Zone. If that fails to hold, a deeper retracement toward the HTF Support Zone may follow.
📌 Key Levels to Watch
Resistance:
‣ $3,328
‣ $3,341
‣ $3,356
‣ $3,383
Support:
‣ $3,313
‣ $3,300
‣ $3,267
‣ $3,241
🔎 Fundamental Focus
All eyes on U.S. unemployment claims today
Expect volatility around the release – stay sharp.
XAUUSD Idea: 4H Trendline First Breakout - Liquidity PlayFOREXCOM:XAUUSD
🔍 Analysis Overview:
Price has just broken above a 4H descending trendline for the first time. However, I remain cautious due to the following key observations:
📌 NOTES:
The broader market sentiment is still bearish due to recent tariff-related news, which often fuels risk-off behavior.
Historically, the first breakout of a strong trendline often fails, trapping early buyers.
This breakout is likely attracting buy-side liquidity, giving institutions an opportunity to hunt stops.
My observation shows buying interest started around the 3308–3313 range, suggesting smart money accumulation and a possible trap.
📉 I'm watching for a fake breakout and potential reversal targeting the liquidity zones marked below around 3307 and possibly lower.
The liquidity sweep below equal lows could offer a better risk-reward setup.
💡 Conclusion:
If price fails to hold above this breakout and shows signs of rejection, I will be anticipating a return towards the previous demand zone for a liquidity grab.
#XAUUSD #GoldAnalysis #SmartMoneyConcepts #LiquidityGrab #ForexTrading #TrendlineBreak #MarketPsychology #TradingSetup #SMC #PriceAction

Waiting for the Perfect Entry: XAUUSD Market Structure Breakdown🔍 Taking a look at XAUUSD today: it’s clearly in a downtrend 📉 on the 4H chart, with consecutive lower highs and lower lows 🔽.
📌 My bias is bearish, and I’m patiently waiting for price action to set up for an entry 🎯.
If we get a break of market structure 🧱, followed by a retest and failure of the current range high 🚫, that could present an opportunity 👀 — not financial advice ⚠️.

Trump blasted Powell again. Interest rates remain unchanged.Information summary:
Trump blasted Powell on Wednesday, saying that the current interest rate is "at least 3 percentage points higher" and once again accused Fed Chairman Powell of "making the United States pay an extra $360 billion in refinancing costs each year." He also said that "there is no inflation" and that companies "are pouring into the United States," and urged the Fed to "cut interest rates."
During the U.S. trading session, gold also showed a significant rebound momentum, rebounding from a low of 3285 to above 3310 in one fell swoop. As of now, gold has stood above 3320.
Market analysis:
From the daily chart:
It can be seen that the first suppression position above gold is currently at 3325, followed by around 3345. Gold did not close above 3320 on Wednesday, which means that even if gold is currently above 3320, as long as today's daily line closes below 3320, it is still in a bearish trend. On the contrary, if the closing price today is above 3320, then the subsequent test of the suppression position near 3345 may be further carried out.
Secondly, from the 4-hour chart, the current suppression position above 4 hours is around 3330-3335. Therefore, today we should focus on this position. If we cannot stand firm and break through the range suppression here in the 4-hour chart, we may retreat again in the future. The key support position below is around 3310, which is the opening price today. If the price is to retreat, it is likely to fall below 3310. But it may also remain above 3310 for consolidation.
However, as long as it falls below 3310, I think the low point near 3285 may be refreshed, so pay attention to this.
Operation strategy:
Steady trading waits for 3310 to fall and break through to short, and the profit range is 3385 or even lower.
Aggressive trading can short near 3340, with a stop loss of 3350.

Market Structure Break & Bearish Reaction from Supply Zone.🔍 GOLD – Market Structure Break & Bearish Reaction from Supply Zone
Gold has recently broken its market structure (MSS), which is a significant shift in momentum and a potential indication of a change in the prevailing trend. Following this break, price retraced into a key supply zone, where it was rejected sharply—this rejection came in the form of a strong bearish engulfing candle, highlighting aggressive selling interest.
Interestingly, the market has now printed a second consecutive bearish engulfing from the same zone. This is a powerful signal that sellers are active and defending this level, making it a valid and confirmed short-term resistance zone. The repeated rejection suggests that smart money or institutional sellers may be positioned here.
Given this price action, we can anticipate a potential retracement from the current levels. The most probable downside target for this retracement would be the Fair Value Gap (FVG) that has been marked on the chart. If price respects the FVG and reacts bullishly from there, we may then see a resumption of the uptrend, possibly taking price higher again.
This setup presents a good opportunity for both short-term intraday traders and swing traders to watch for confirmation signals before entering the trade.
📌 Key Takeaways:
MSS indicates shift in trend
Consecutive bearish engulfing candles from supply zone
Sellers likely active in this area
Potential retracement toward marked FVG
Possible bullish continuation from FVG zone
🚨 As always, Do Your Own Research (DYOR) and manage your risk accordingly before making any trading decisions.

Gold (XAUUSD) Trade Setup – Valid Until July 10, 2025This 15-minute chart shows a clean technical breakout from a falling channel. Here's how to interpret and potentially trade this move:
🧠 Context: What Just Happened
Price was locked inside a descending channel (blue) for multiple sessions.
A breakout occurred above the channel, indicating a potential short-term bullish reversal.
The bounce aligns with recent tariff-related headlines easing off and short-covering momentum building.
I trade these support and resistance lines daily on micro gold futures.
What these lines represent:
Golden Line: Heavy Support or Resistance depending on the price direction towards the lines for major reversal or $10-$15 swings.
Silver Lines: Consolidation areas or mid way support and resistance for a scalping few touches.
Bronze dotted lines: Low volume days support and resistance for a quick $5 up or down.
Also, I can see a directional setup. Here is a hypothetical scenario that could play out:
📌 Key Zones to Watch
🔼 Resistance $3,342 Next major target / sell zone
🟧 Resistance $3,319 Current breakout level retest
⚪ Support $3,307–$3,316 Minor consolidation area
🔻 Support $3,295–$3,289 Strong demand / invalidation
🚨 Bear Pivot $3,272 Break below = bearish return
🧭 Trading Playbook
Bullish Bias (Preferred Scenario)
✅ Break and hold above $3,319 = potential move to $3,342
🎯 Target: $3,340–$3,342
🔒 SL below: $3,307
Optional re-entry on retest of $3,316 zone
Bearish Reversal (If Bulls Fail)
⚠️ If price fails $3,319 and breaks back below $3,307, sellers may reclaim control
📉 Look for short setups toward $3,295 and even $3,272
SL above: $3,319
📌 Key Tip
Watch for volume confirmation and 5m candle closes at each level. Don’t chase — let price come to your levels.
⏳ Validity
This setup remains valid through July 10, or until $3,342 target is hit or $3,272 is broken.
This is not financial advice; it's for educational purposes only.

Gold rose. Trend reversed.Gold rose slightly in early Asian trading on Wednesday, but fell under pressure near 3308. It fluctuated in the European trading range of 3296-3282. It broke through the US trading range and rose to around 3317 in the late trading. The daily line closed with a positive line with a lower shadow.
After a sharp drop on Tuesday, gold showed a downward recovery trend on Wednesday and closed positive. It rose slightly in early Asian trading today. From the daily level, in the short term, we should first pay attention to the resistance near 3325-3330. This area brings together the current positions of the 5-day moving average, the 10-day moving average and the 60-day moving average, which is an important gateway for the game between long and short forces in the short term. If the gold price continues to be under pressure in this area, it means that the short-term upward momentum is insufficient, and we need to be alert to the risk of a market decline.
If the above resistance area can be broken and the price continues to rise strongly, the next target will be the resistance near 3345, which is not only the high point on Tuesday, but also the current location of the 20-day moving average and the 30-day moving average, which has a strong technical resistance significance.
In terms of support below, first pay attention to the support near 3280, which is the current support level of the trend line formed by the low points of May 15 and June 30, which provides certain support for the gold price.
Operation strategy:
Short at price rebound near 3345, stop loss at 3355, profit range 3320-3300
Long at price drop near 3315, stop loss at 3305, profit range 3320-3340
Gold is in the Bearish direction from a Support levelHello Traders
In This Chart GOLD HOURLY Forex Forecast By FOREX PLANET
today Gold analysis 👆
🟢This Chart includes_ (GOLD market update)
🟢What is The Next Opportunity on GOLD Market
🟢how to Enter to the Valid Entry With Assurance Profit
This CHART is For Trader's that Want to Improve Their Technical Analysis Skills and Their Trading By Understanding How To Analyze The Market Using Multiple Timeframes and Understanding The Bigger Picture on the Charts

GOLD ROUTE MAP UPDATEHey Everyone,
Absolutely beautiful to see our 1h chart idea playing out perfectly. After completing the bearish targets earlier this week, we had the ema5 cross and lock below 3306 opening the swing range.
- This played out perfectly hitting the first swing range level and doing exactly what it say son the tin giving the full swing into 3306 just like we highlighted.
We will now look for ema5 lock above 3306 for a continuation into the bullish targets above or failure to lock will see rejections into the lower Goldturns for suport and bounce.
If it continues to fail breakout above, into the first Bullish target, then we are likely to see the full swing range tested on the rejections.
We will keep the above in mind when taking buys from dips. Our updated levels and weighted levels will allow us to track the movement down and then catch bounces up.
We will continue to buy dips using our support levels taking 20 to 40 pips. As stated before each of our level structures give 20 to 40 pip bounces, which is enough for a nice entry and exit. If you back test the levels we shared every week for the past 24 months, you can see how effectively they were used to trade with or against short/mid term swings and trends.
The swing range give bigger bounces then our weighted levels that's the difference between weighted levels and swing ranges.
BULLISH TARGET
3358
EMA5 CROSS AND LOCK ABOVE 3358 WILL OPEN THE FOLLOWING BULLISH TARGETS
3389
EMA5 CROSS AND LOCK ABOVE 3389 WILL OPEN THE FOLLOWING BULLISH TARGET
3416
EMA5 CROSS AND LOCK ABOVE 3416 WILL OPEN THE FOLLOWING BULLISH TARGET
3439
BEARISH TARGETS
3330 - DONE
EMA5 CROSS AND LOCK BELOW 3330 WILL OPEN THE FOLLOWING BEARISH TARGET
3306 - DONE
EMA5 CROSS AND LOCK BELOW 3306 WILL OPEN THE SWING RANGE
3283 - DONE
3254
As always, we will keep you all updated with regular updates throughout the week and how we manage the active ideas and setups. Thank you all for your likes, comments and follows, we really appreciate it!
Mr Gold
GoldViewFX

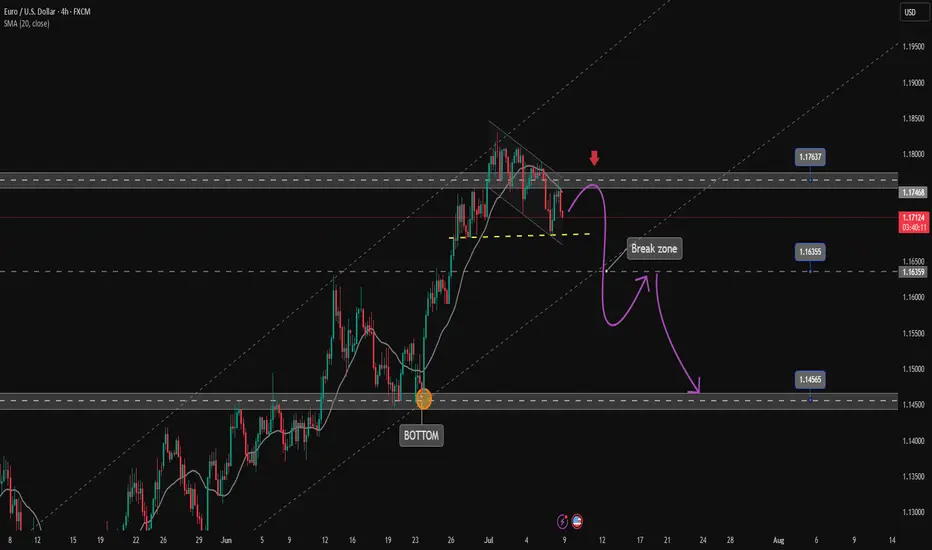
Confirming EURUSD corrective downtrend✏️EURUSD is trading in a downtrend channel. SELL signal is triggered at the current price around 1.172 as the H4 candle failed to break 1.176 and confirmed the Sellers' entry into the market clearly. Target for the downtrend is at 1.145, the Sellers' strength needs to overcome the Break out zone of 1.163 first.
📈 Key level
Support 1.163-1.146
Resistance 1.176
SELL DCA Trigger: Break 1.163
BUY Trigger: The price trades about 1.163.

GOLD - at resistance ? Holds or not??#GOLD.. .market perfect dropped below our area that was around 3320
Now market bounced back and just near to his resistance area 3295 96
That will be market final area and only holdings of that region means another drop expected.
Note: we will plan for cut n reverse above that region.
Good luck
Trade wisely
XAUUSD Trade Setup Short📉 Trade Idea: Sell XAU/USD
Entry Zone: 3290–3293
Stop Loss (SL): 3300 (tight risk cap above resistance)
Take Profit (TP): 3270 (next support level)
🔍 Explanation:
🟠 Trade Logic:
Expecting price to reject 3290–3293, possibly a minor resistance zone or lower high in a downtrend.
A break below 3290 signals weakness continuation, with sellers in control.
TP at 3270 targets the next meaningful support area, offering a decent reward.

Data is about to be released. Where will gold go?Yesterday, the market expected a trade agreement between the United States and its trading partners, which boosted risk sentiment, and the strengthening of the US dollar and the rise in US bond yields further added pressure on gold prices. Gold fell 1% during the day and once lost the $3,300 mark during the session.
After gold bottomed out and stabilized at 3,320 on Monday, it fell sharply above 3,320 again on Tuesday and has now completely fallen below 3,320. The position of 3,320 is very important. In the 3,320-50 range, it chose to break down at 3,320 again.
Today, the Federal Open Market Committee of the United States will release the minutes of the June monetary policy meeting. Although Federal Reserve Chairman Powell remained neutral on the June interest rate decision, many Federal Reserve officials released dovish signals. Federal Reserve Board member Bowerman has turned to support the possibility of a rate cut in July.
From a technical point of view, the market has penetrated into the area around the lower support of 3,275-3,295.
The rhythm of the entire market is still a process of oscillating decline. From the perspective of pressure position, the daily MA5 average line has not fallen below, and may fall again to around 3270. Once the market falls too fast and approaches this position, there is a high probability that there will be a rebound demand.
Operation strategy:
Buy near 3375, stop loss at 3365, profit range 3315-3320.
Continue to hold position after breakthrough.

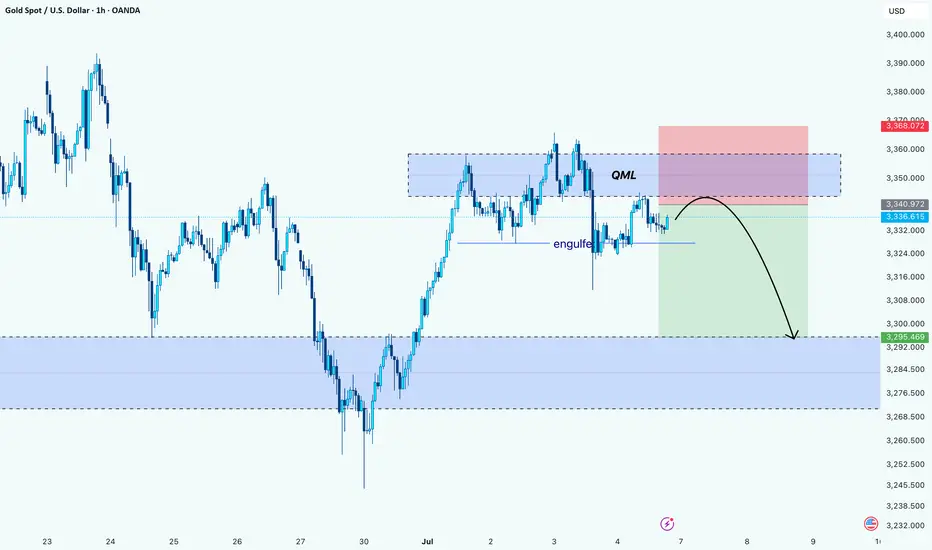
Gold’s Trap Above QML: Bearish Play UnfoldingHello Guys!
Gold appears to be forming a textbook Quasimodo reversal setup after printing a lower high into a key supply zone. Price aggressively tapped into the QML area (around 3,350–3,360), where sellers previously stepped in, and we’re now seeing signs of rejection.
The engulf zone marked earlier confirms bearish intent. It broke structure and flipped momentum. Price is currently retesting below that engulf level, likely as a last attempt to grab liquidity before heading down.
The projected move suggests a drop toward the next significant demand zone around 3,295–3,285, where the price previously found a strong bullish reaction.
Bias: Bearish below QML
Target: 3,295 zone
Invalidation: Above 3,368 (high of supply zone)
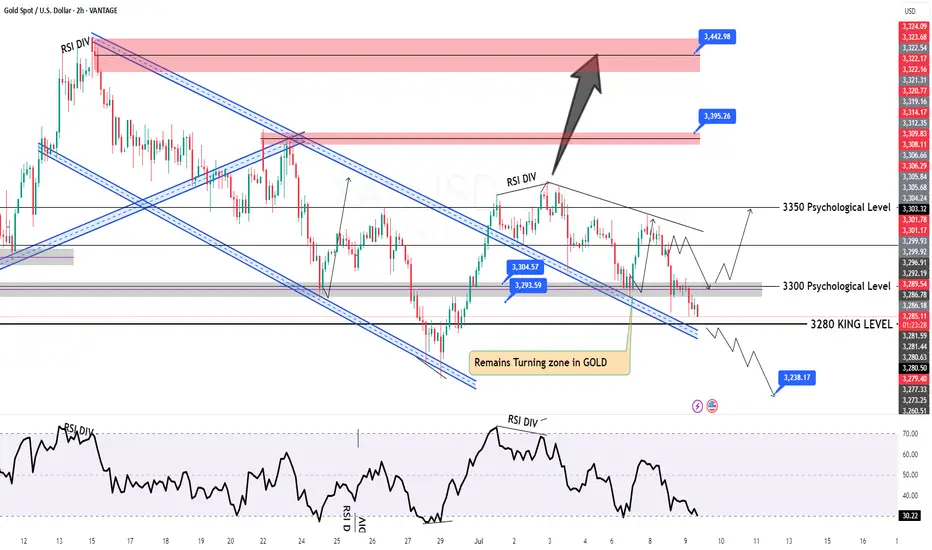
Gold (XAU/USD): Playbook in ActionHello guys!
We’ve seen a textbook QML (Quasimodo Level) setup play out beautifully on gold. Price pushed into a key supply zone and formed a QML structure, followed by a clean engulfing of the previous demand. confirming smart money involvement. As expected, the target of that QML has now been hit, tapping into the major demand zone below.
After the deep sweep and reaction from demand, price retraced upward into a potential lower high area. Based on structure and liquidity dynamics, two potential scenarios are in play:
We’re executing a two-step plan here:
Step 1: Short position from the QML + supply area, aiming for the next blue demand zone. Liquidity has been taken above the high, confirming the setup.
If we get a clean reaction near the blue area, that’s our signal to flip long. We expect a pullback toward $3310 area.

GOLD Intraday H2 Chart update for 9 July 2025Hello Traders
as you can see that we have strong resistance on 3310 level only break above that level will consider bullish move
Below 3300 Psychological level market remains Bearish and move towards 3245 level
FOMC Meeting minutes dues today
Disclaimer: Forex is Risky
XAUUSD SELL ANALYSIS SETUP READ (CAPTION)hi trader's. what do you think about gold
current price: 3293
gold is breakout low 3289 in (H1) candle pettran and now gold resistance zone 3295 and 3308 and gold is reject this area and create sell candle then gold fall down
resistance zone: 3295-3308
target : 3270-3250
stop loss: : 3310
please don't forget to like comment and follow thank you

Buy Gold! The short-term bottom may have appeared!Gold continued to retreat yesterday and hit a recent low, reaching around 3287. Then gold gradually rebounded to above 3300. Relatively speaking, the rebound momentum was weak. It is expected that the long and short sides will fight fiercely around 3300. However, from the recent characteristics of gold operation, it can be seen that although the short position of gold is strong, it is difficult to continue in the short term, and I think the short-term decline of gold is basically in place, so at this stage, in terms of short-term trading, I do not advocate shorting gold directly;
As gold did not continue to fall after reaching around 3287, on the contrary, it gradually rebounded to above 3300, which may strengthen the market's consensus on the short-term bottom, thereby attracting the favor of off-site funds; from the current gold structure, if gold can maintain above 3300-3295, it may be combined with the 3287 low to build a "W" double bottom structure, which is conducive to supporting the rebound of gold.
However, as gold fell below 3300 again, the bearish trend is relatively strong, so we need to moderately lower our expectations for a gold rebound. In the short term, gold is under pressure in the 3315-3325 area, so we can temporarily look to this area for the rebound target. Therefore, in short-term trading, I do not advocate shorting gold directly, and you can first consider going long on gold in the 3300-3295 area, TP: 3310-3320-3330.

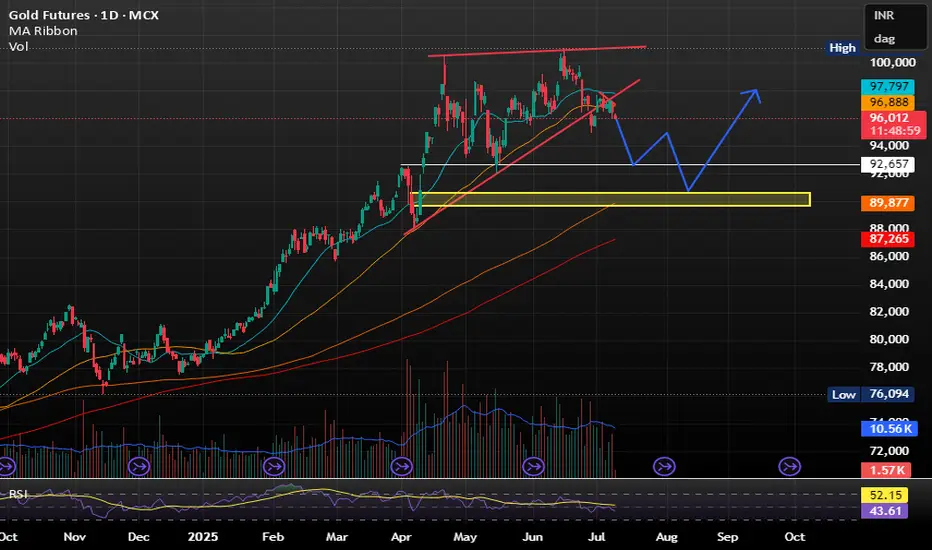
GOLD IS MELTING LIKE A ICEGOLD IS MELTING LIKE A ICE -
Trading below 20SMA and 50SMA making it less attractive at current price level.
ALSO RELATIVE STRENGH IS WEAKNING .
As per my view Sell on rise will be profitable for short term .
DOWNSIDE TARGET SHOULD BE WITHIN 92000 TO 90000 .
A High-Probability Play Unfolding!🌟 GOLD MARKET OUTLOOK – A High-Probability Play Unfolding! 🟡📉
Gold was riding a solid uptrend recently, showing strength across the board. But over the past few days, things have started to shift. We've seen a clear Market Structure Shift (MSS) followed by a Break of Structure (BOS) to the downside — signaling the start of a short-term bearish trend.
📍 What’s Happening Now?
Gold is currently trading lower after the BOS, but the market is now approaching a critical phase...
We’re expecting a retracement move to the upside — a temporary pullback that could trap early buyers (this is called inducement). This is where things get interesting!
🎯 What to Watch For:
Once the retracement plays out, we’ll be watching closely for:
🔻 Bearish Fair Value Gaps (FVGs)
🔻 Supply Zone Order Blocks
These areas could offer us high-probability sell entries aligned with the overall bearish momentum.
📉 The Target?
We’ll be aiming for the previous swing low, where liquidity is likely resting — a classic price magnet in such setups.
⚠️ Be Patient. Let the Market Come to You.
Wait for the retracement, let price fill the gaps, and only then look for confirmation to enter. Rushing in now means going against smart money flow.
🧠 DYOR – Do Your Own Research!
This is a market roadmap, not a signal.
