Gold fell under pressure, and the watershed is 3321.
⭐️Gold Information:
During the Asian session on Wednesday, gold prices (XAU/USD) continued to be under pressure, falling below the $3,300 mark, hitting the lowest point in more than a week. The decline in gold prices comes as the market generally believes that the Federal Reserve (Fed) will maintain high interest rates for a longer period of time, especially as the market expects that tough U.S. tariffs may exacerbate inflation in the coming months.
Such expectations have pushed up U.S. Treasury yields and stabilized the U.S. dollar (USD) near a two-week high hit on Tuesday - a key resistance for the non-yielding precious metal, which continues to face downward pressure.
⭐️Personal comments:
Gold price fell below support, Dow Jones H1 pattern, gold price fell below 3300
⭐️Set gold price:
🔥Sell gold area: 3344-3446 SL 3351
TP1: $3335
TP2: $3320
TP3: $3302
🔥Buy gold area: $3256-$3254 SL $3249
TP1: $3268
TP2: $3280
TP3: $3298
⭐️Technical analysis:
Set reasonable sell orders based on technical indicators EMA 34, EMA89 and support and resistance areas.
Goldprediction

XAU/USD) bearish Trand analysis Read The captionSMC trading point update
Technical analysis of (XAU/USD) on the 3-hour timeframe, projecting further downside after rejection from a resistance zone aligned with a descending trendline.
---
Analysis Summary
Trend Bias: Bearish
Current Price: ~$3,301.96
Structure: Price is respecting a descending channel, with multiple rejections from the upper boundary and key resistance zone.
---
Key Technical Insights
1. Resistance Zone & Downtrend Line:
Price was rejected from a resistance block near the EMA 200 (~$3,331) and descending trendline.
This level has repeatedly triggered strong downside moves (highlighted with red arrows).
2. EMA 200 Reaction:
The EMA 200 at $3,331.10 is acting as dynamic resistance.
Each time price reaches or crosses above this line, selling pressure increases.
3. Bearish Price Projection:
After recent rejection, the chart anticipates a pullback to the support zone between $3,248.26 and $3,245.71.
A deeper drop toward $3,159.13 is projected as a next major target, consistent with previous price moves.
4. RSI Indicator:
RSI at 40.24 suggests bearish momentum is still in play but not yet oversold—indicating room for more downside.
---
Bearish Trade Idea
Element Level / Description
Entry Zone Below resistance: $3,310–$3,320
Target 1 $3,248.26–$3,245.71 (support zone)
Target 2 $3,159.13 (channel base / next support)
Stop-Loss Above $3,335 (above resistance zone)
---
Risk Considerations
Fundamental catalysts: Gold is sensitive to USD strength, interest rate decisions, and macroeconomic data.
Invalidation: A strong breakout and close above the descending trendline and EMA 200 would negate the bearish outlook.
---
Summary
This analysis outlines a bearish setup for XAU/USD, supported by trendline resistance, EMA rejection, and RSI momentum. If current structure holds, a move toward the $3,245 and $3,159 levels is likely.
Please support boost 🚀 this analysis)

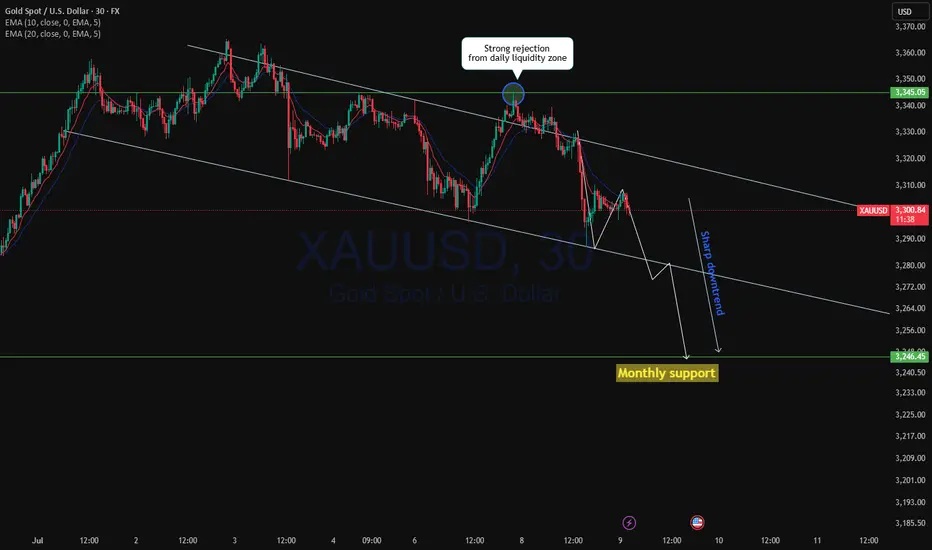
XAUUSD Continue to drop?XAUUSD from daily resistance of 3345.00 after strong liquidity grab price started to fall with strong momentum to the daily support level. Yesterday we have seen a long daily doji formed with a long wick at the bottom followed by wick fill as expected with long bearish engulfer with both cross over of 10ema and 20ema.
Currently price in sharp downtrend and possibility to drop to monthly support below 3250.00
A bearish trade is high probable.
Gold shocks and alternating long and short ideas
💡Message Strategy
As we mentioned before, the upper 3345-50 is the suppression position after the non-agricultural data last week. We can short at the 45-50 line when it rebounds. Yesterday, we also gave the idea of going long at the 3295-3301 line. At midnight, gold rebounded perfectly above the 3330 line and closed at the 3336 line.
Today we continue to pay attention to the short-term suppression of the 3345-50 line. If the rebound does not break, we will intervene in the short order. After all, the technical side needs to be adjusted and repaired during the day. We try to grasp the good entry position for operation. If your current gold operation is not ideal, welcome to communicate!
📊Technical aspects
From the 1-hour analysis, the short-term support of 3290-3295 is concerned below, the short-term resistance above is concerned about the 3345-50 line, and the suppression of 3365-70 is focused on. The overall main tone of high-altitude low-multiple cycle participation remains unchanged. In the middle position, watch more and do less, and follow orders cautiously, and maintain the main tone of participation in the trend. Wait patiently for key points to participate. Pay attention to the specific operation strategy in time.
💰Strategy Package
Long Position:3290-3300,SL:3275,Target: 3320-3340

XAUUSD h4 buying target levelsGOLD (XAU/USD) - 4H Analysis
Price is currently reacting from a well-defined support zone (demand area) near $3,250–3,270, which previously acted as strong resistance and now flipped to support.
🔍 I'm watching for bullish confirmation from this zone for a potential upward move toward the next resistance levels.
🎯 Targets:
Target 1: $3,400 (First key resistance)
Target 2: $3,460 (Major resistance & previous high)
📉 If price fails to hold above the support area, this setup will be invalidated. Risk management is key.
This idea is based on structure breakout and price respecting previous resistance turned support zone.
📊 Levels:
Support (Entry Area): $3,250 – $3,270
Target 1: $3,400
Target 2: $3,460
Invalidation Below: $3,240
#GOLD #XAUUSD #PriceAction #TradingSetup #BuySetup #4HChart #ForYou #BreakoutTrade #SmartMoney #ForexAnalysis #LiquidityGrab
CAPITALCOM:GOLD

Short-term gold bulls and bears are anxious,3330 becomes the keyAt present, the market has been fluctuating narrowly in the range of 3330-3320, and both bulls and bears are in a stalemate. However, gold has formed a double-layer head and shoulders bottom pattern, so the short-term bullish trend is definitely unchanged. In the previous post, I also mentioned that if the rebound in the European session is weak and gold continues to be below 3345, then the short-term NY session may usher in a retracement and a second bottom. Therefore, I still hold a long order of 3325-3315, and temporarily modify the TP to the 3335 line. I expect that there may be a retracement here, but there may also be a direct retracement. No matter what the situation is, we need to stabilize before entering the market.
In addition to investment, life also includes poetry, distant places, and Allen. Facing the market is actually facing yourself, correcting your shortcomings, facing your mistakes, and exercising strict self-discipline. I share free trading strategies and analysis ideas every day for reference by brothers. I hope my analysis can help you.
PEPPERSTONE:XAUUSD FOREXCOM:XAUUSD FX:XAUUSD FXOPEN:XAUUSD OANDA:XAUUSD TVC:GOLD

How to solve the problem of order being trapped in a loop📊 Gold Day Trading Strategy (Recommendation index ⭐️⭐️⭐️⭐️⭐️)
📰 News information:
1. The lasting impact of new tariffs
2. The impact of geopolitical conflicts
3. The Fed’s interest rate cut
📈 Technical Analysis:
The recent market conditions have been volatile. Many brothers have reported that they have been trapped recently. They have just been released from short positions, but have fallen into the situation of being trapped by long orders again. I have also encountered such a situation recently. Brothers who follow me must know that I have been trapped, but in the process of being trapped, I still share my trading ideas for the brothers who are trapped to check, so that we can all get out of the trap.
Gold fell as expected and hit the lowest point of 3287 before rebounding. The current 3300-3290 range given at the bottom has certain support. At present, I have answered it. As long as it does not fall below 3285, we can still go long and look for rebound correction. TP can temporarily look at 3305-3310. At present, the short-term upper watershed is near the 3321 line. As time goes by, the medium-term point can be seen at 3345. Only when the price stands above 3345 can the upward momentum continue to touch the 3380 line, or even 3400. In the short term, you can go long if you look at the support below. In the short term, pay attention to the resistance above 3315-3320. If it encounters resistance under pressure, it will fall back. On the contrary, after breaking through the first level of resistance, the upward trend will continue.
🎯 Trading Points:
BUY 3300-3290-3285
TP 3305-3315-3320-3345
SELL 3315-3321
TP 3300-3290
In addition to investment, life also includes poetry, distant places, and Allen. Facing the market is actually facing yourself, correcting your shortcomings, facing your mistakes, and exercising strict self-discipline. I share free trading strategies and analysis ideas every day for reference by brothers. I hope my analysis can help you.
TVC:GOLD OANDA:XAUUSD FXOPEN:XAUUSD FX:XAUUSD FOREXCOM:XAUUSD PEPPERSTONE:XAUUSD
Gold: Potential Correction on the Horizon?Gold has long been regarded as a safe haven asset, drawing the attention of investors during periods of economic uncertainty. In recent years, gold prices have reached historic highs, fueled by inflation concerns, geopolitical tensions, and shifts in monetary policy. However, as with any asset experiencing a prolonged rally, the question arises: Is a correction in gold prices imminent?
Understanding the Recent Gold Rally
Several factors have contributed to gold’s impressive performance:
Inflation Hedge: Persistent inflation has driven investors toward gold as a store of value.
Geopolitical Risks: Ongoing conflicts and global tensions have increased demand for safe haven assets.
Monetary Policy: Central banks’ dovish stances and low interest rates have made non-yielding assets like gold more attractive.
Several scenarios could catalyze a correction in gold prices:
Unexpected Economic Recovery: Stronger-than-expected economic data could reduce demand for safe haven assets.
Aggressive Rate Hikes: Faster-than-anticipated interest rate increases could shift investor preference away from gold.
Resolution of Geopolitical Tensions: Any de-escalation in major geopolitical hotspots may dampen gold’s appeal.
#gold #commodity #commodities #metals #trading #portfolio

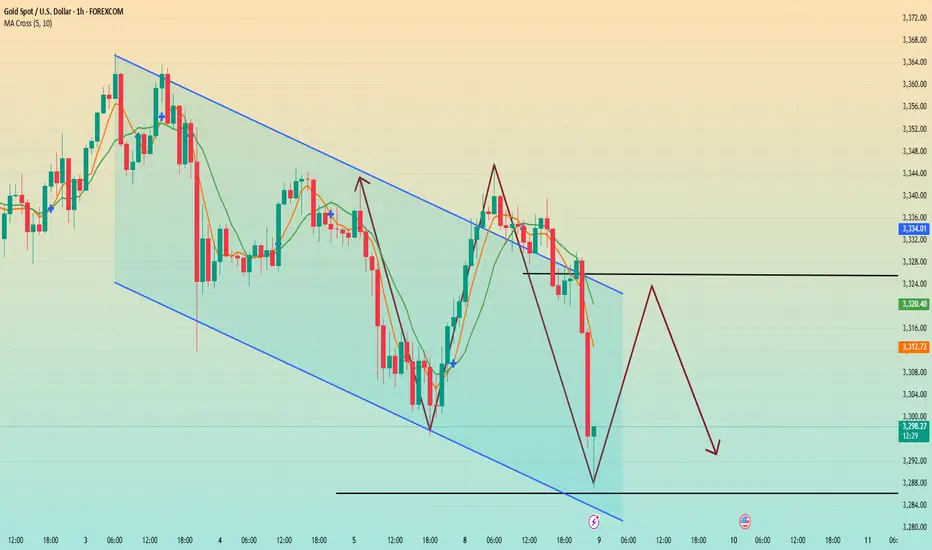
GOLD 4H CHART ROUTE MAP UPDATEHey Everyone,
Please see update on our 4H Chart route map, also playing out perfectly with our levels being respected, as analysed.
We have our bearish target hit at 3295 and currently testing for support and bounce. Ema5 cross and lock below this level will open the swing range and failure to lock will see price reject and head up for the Bullish target. The 1h chart route map from yesterdays update also has the swing range open, which we need to keep in mind when planning to buy dips.
We will keep the above in mind when taking buys from dips. Our updated levels and weighted levels will allow us to track the movement down and then catch bounces up.
We will continue to buy dips using our support levels taking 20 to 40 pips. As stated before each of our level structures give 20 to 40 pip bounces, which is enough for a nice entry and exit. If you back test the levels we shared every week for the past 24 months, you can see how effectively they were used to trade with or against short/mid term swings and trends.
The swing range give bigger bounces then our weighted levels that's the difference between weighted levels and swing ranges.
BULLISH TARGET
3364
EMA5 CROSS AND LOCK ABOVE 3364 WILL OPEN THE FOLLOWING BULLISH TARGETS
3429
EMA5 CROSS AND LOCK ABOVE 3429 WILL OPEN THE FOLLOWING BULLISH TARGET
3499
EMA5 CROSS AND LOCK ABOVE 3429 WILL OPEN THE FOLLOWING BULLISH TARGET
3499
EMA5 CROSS AND LOCK ABOVE 3499 WILL OPEN THE FOLLOWING BULLISH TARGET
3561
BEARISH TARGETS
3295 - DONE
EMA5 CROSS AND LOCK BELOW 3295 WILL OPEN THE SWING RANGE
3242
3171
EMA5 CROSS AND LOCK BELOW 3171 WILL OPEN THE SECONDARY SWING RANGE
3089
3001
As always, we will keep you all updated with regular updates throughout the week and how we manage the active ideas and setups. Thank you all for your likes, comments and follows, we really appreciate it!
Mr Gold
GoldViewFX

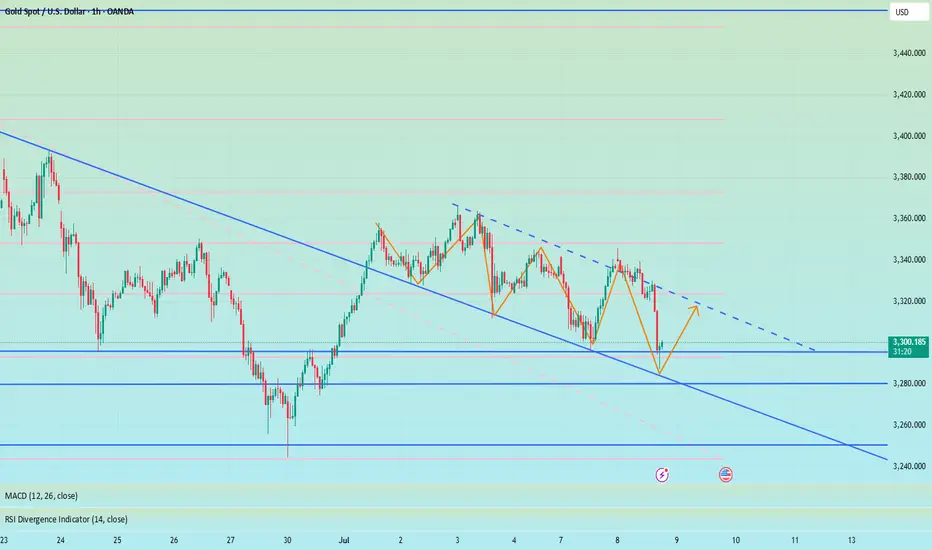
Gold is going down without any signs. Will it continue?Yesterday's seemingly strong rise in gold's safe-haven market may make people mistakenly think that gold is going to rise sharply, but the recent safe-haven market has poor sustainability and poor upward momentum, and cannot maintain the continuation of the upward trend.
Looking at gold in 1 hour, after the price surged, it continued to fall under pressure at 3345. 3345 is also the recent key position for long and short positions. The 1-hour moving average of gold is still in a short position and continues to diverge downward. The short-term short momentum of gold still exists. I think the price will still fall after the rebound. Gold started to fall directly at 3330, and 3330 formed a strong resistance for gold in the short term. The downward low point did not continue after touching 3288. The current price rebounded and fluctuated around 3295. So we can sell high and buy low around 3385-3325.
Gold Setup Expected Move📈 Bullish Scenario (Upside Move)
✅ Conditions:
Price holds above $3,327 support
EMA50 acts as dynamic support
RSI stays above 50
MACD shows bullish crossover
🔼 Targets:
TP1: $3,342 (Resistance 1)
TP2: $3,360 (Resistance 2)
Potential Breakout Zone: Above $3,360 could open path to $3,375+
🔒 Invalidation:
Bullish bias invalid if price breaks below $3,327 and EMA50
📉 Bearish Scenario (Downside Move)
✅ Conditions:
Price breaks below $3,327 support
EMA50 is broken to the downside
RSI drops below 45–40
MACD shows bearish crossover or negative histogram
🔽 Targets:
TP1: $3,308 (Support 2)
TP2: $3,295–$3,285 (next demand zone
🔒 Invalidation:
Bearish bias invalid if price reclaims above $3,335–$3,342 quickly with volume
🧭 Summary Table
Scenario Trigger Target(s) Invalidation
Bullish Holds above $3,327, EMA50 support $3,342 → $3,360+ Break below $3,327
Bearish Breaks below $3,327 + EMA50 fails $3,308 → $3,295 Regain above $3,342

Gold Price Setup: Bullish Continuation or Rejection? 🧠 Chart Analysis (XAU/USD – 1H):
Key Structure Highlights:
CHoCH (Change of Character) zones marked both up and down indicate a battle between bulls and bears.
Recent bullish CHoCH followed by a fair value gap (FVG) retest suggests potential continuation to the upside.
Price recently bounced strongly from demand zone, shown by the green arrows and strong candle reaction.
Ichimoku Cloud:
Price is trying to break back above the Kumo (cloud), a sign of bullish momentum building.
However, resistance is still present with the Kijun and Tenkan lines converging.
FVG (Fair Value Gap):
The current price is attempting to fill and break above the FVG zone.
A successful breakout above this area confirms bullish intention.
Fibonacci Levels:
Price is hovering around the 0.5 - 0.618 retracement zone, often a strong reversal or continuation point.
Upside targets lie near the 0.786 retracement (3352) and ultimate target at 3391, a major resistance level.
Risk Management:
Trade setup shows an excellent Risk:Reward ratio.
Stop-loss placed just below the last structure low.
Potential downside to 3290–3258 if breakout fails.
🟢 Possible Next Move:
Bullish Scenario: If price clears the FVG and breaks above 3353, expect continuation to 3391.
Bearish Rejection: If rejected at FVG/0.618 level, watch for a drop back to 3290 or even 3259.

Gold is bullish and needs more momentum at 3320The buying pressure in the US session pushed the price up and formed a bullish hammer candle on D1. Today's bearish recovery is seen as a buying opportunity to head towards the uptrend again.
3344 is the immediate resistance zone in the European session that Gold faces. Breaking this resistance zone will head towards 3365. According to the wave structure, it would be great to have a retest of 3320 to find some buying momentum and then break 3344.
SUPPORT: 3320-3297
RESISTANCE: 3345-3352-3365
SELL Trigger: Break 3320 ( Trendline & break zone)
Do you have any comments on the trading plan? I would love to hear your views.
The shock continues, and the retracement continues to go long📊 Gold Day Trading Strategy (Recommendation index ⭐️⭐️⭐️⭐️⭐️)
📰 News information:
1. The lasting impact of new tariffs
2. The impact of geopolitical conflicts
3. The Fed’s interest rate cut
📈 Technical Analysis:
From the hourly chart, gold has formed a head and shoulders bottom. At present, 3320 below has formed a certain support in the short term. For now, the daily line still cannot close below 3320. If the daily line closes below 3320, the decline may open further. On the contrary, the current upper suppression position of gold is near 3350. If the daily line stands above 3350 again, it will be a bull-dominated trend and may test 3380-3390 above. In the short term, pay attention to the support line of 3325-3315 below. If it retreats to the support level, you can consider going long. Look to the resistance range of 3340-3350 above, and pay special attention to the suppression line of 3365-3370. At the same time, if the European session is always suppressed below 3345 and sideways, there is no performance, so you should consider selling it, and there may be further retreat in the evening.
🎯 Trading Points:
BUY 3330-3325-3315
TP 3340-3350-3365
In addition to investment, life also includes poetry, distant places, and Allen. Facing the market is actually facing yourself, correcting your shortcomings, facing your mistakes, and exercising strict self-discipline. I share free trading strategies and analysis ideas every day for reference by brothers. I hope my analysis can help you.
TVC:GOLD OANDA:XAUUSD FXOPEN:XAUUSD FX:XAUUSD FOREXCOM:XAUUSD PEPPERSTONE:XAUUSD

Gold Finds Supports – Is the Rebound About to Begin?Gold ( OANDA:XAUUSD ) declined to the Support zone($3,312-$3,290) and Support lines as I expected in the previous idea .
Gold is currently trading in the Support zone($3,312-$3,290) and near a set of support lines .
In terms of Elliott Wave theory , it seems that Gold has completed the Zigzag Correction(ABC/5-3-5 ) and we should wait for the next 5 impulse waves . One of the confirmation signs of the end of these corrective waves could be the break of the resistance line .
I expect Gold to trend higher in the coming hours and rise to at least $3,343 AFTER breaking the Resistance line .
Second Target: $3,364
Note: Stop Loss (SL) = $3,287
Gold Analyze (XAUUSD), 1-hour time frame.
Be sure to follow the updated ideas.
Do not forget to put a Stop loss for your positions (For every position you want to open).
Please follow your strategy; this is just my idea, and I will gladly see your ideas in this post.
Please do not forget the ✅ ' like ' ✅ button 🙏😊 & Share it with your friends; thanks, and Trade safe.

Gold's rise is consistent with my analysis
Today's market analysis and interpretation:
First, the weekly gold level: Last week, it closed with a positive K, and the closing price just returned to the lower track of the upward channel, and the 10-day moving average stood on it again; this does not rule out that the negative line break last week was an illusion; this week, the corresponding channel lower track resistance is just last week's high of 3365. Once it stands on the channel again, it is expected to gradually strengthen in the medium term
Second, the daily gold level: Yesterday, it closed with a long lower shadow cross K, so 3296 has a stabilization signal, and the wave of shocks after closing negative last week may end here; today, after filling the shadow line, it has to continue to try to be bullish, and when it breaks through and stands on the middle track, it can try to test 3400-3430
Third, the hourly gold level: Yesterday, the opening jumped and pulled up sharply, and then fell back immediately, falling from 3342 to 3296 under pressure, and the US market directly rose from 3296 to 3340; Today is exactly the same, with a gap up and a sharp pull, and it immediately fell back after touching the 3346 line. The Asian and European sessions fluctuated and stepped back to 3320; due to the loss of the middle track, there may be further room for decline before it breaks through again. The resistance is the middle track of 3330 and the upper track of the yellow channel at 3337. The support is 618 split support 3315, and further down is 3307 and 786 split support. If the support is stabilized, it will continue to be bullish. The short-term double top is 3345-46. If it breaks through and stands above, it can hit around 3365, or even 3400 and above.

GOLD BUY ZONES Gold Buy Zone We Have
Bullish Engulfing Area ( 3317 - 3311 )
Order Block Area ( 3304 - 3295 )
Target We Are Expect Previous High Lets Gooo

XAUUSD Outlook: How Risk Sentiment Could Shape the Next MoveI’m currently analysing XAUUSD (Gold) 🟡, which has come under bearish pressure 📉, showing signs of downside momentum. In the video 🎥, we also explore the inverse correlation between Gold and risk assets like the NASDAQ 📊.
Keep a close eye on NASDAQ movements—if risk assets break bullish 🚀, we may see further weakness in Gold. On the other hand, if risk sentiment shifts and risk assets break bearish 🛑, Gold could attract safe-haven demand and gain strength 💪.
We also dive into the price action, market structure, and pull up the volume profile 🧩. Gold is currently trading around the Point of Control (POC) ⚖️—a key level where significant volume has accumulated. A clean break above or below this area could act as a technical trigger for the next move 📈📉.
As always, this is not financial advice ⚠️—just my market view.

XAUUSD Analysis todayHello traders, this is a complete multiple timeframe analysis of this pair. We see could find significant trading opportunities as per analysis upon price action confirmation we may take this trade. Smash the like button if you find value in this analysis and drop a comment if you have any questions or let me know which pair to cover in my next analysis.

Gold price analysis July 8In the previous US session, strong buying pressure pushed gold prices up and formed a bullish hammer candlestick pattern on the D1 chart - a potential sign for an uptrend recovery.
🔄 Today's scenario: The correction in the early session is considered a good opportunity to buy, expecting the price to continue the uptrend.
📍 Nearest resistance zone:
The price is currently facing the resistance zone of 3344 in the European session. If gold breaks 3344, the next target will be 3365 - the gap zone that has not been filled.
However, according to the wave structure, it would be more optimal if the price has a retest to the 3320 zone, accumulates more buying momentum and then breaks out strongly through 3344.
📉 Bearish scenario:
If 3320 is broken, especially with a trendline and support zone breakout signal, a sell strategy can be activated with a lower target.
🔸 Support: 3320 – 3297
🔸 Resistance: 3345 – 3352 – 3365
🔸 Sell is triggered if: Price breaks 3320, confirms breaking trendline & support zone.
💬 Do you have any comments on this trading plan? Leave a comment!

Gold fluctuates. Beware of highs.On Monday, the U.S. dollar index rose sharply, reaching an intraday high of 97.65 as Trump announced that he would impose new tariffs on a series of countries including Japan and South Korea on August 1.
Spot gold fell first and then rose. It once fell below the $3,300 mark during the session, but then rebounded strongly in a V-shaped manner by nearly $40. As of now, it has stabilized above 3,330.
From the current daily line:
3,320 is the absolute support position for gold at present. Although it fell below 3,320 yesterday, Monday, it then reversed and stabilized above 3,320. For now, the daily line still cannot close below 3,320. If it closes below 3,320, the decline may open further. On the contrary, the current upper suppression position of gold is around 3,350. That is to say, it is basically maintained at 3,320-50 for rectification.
If the daily line stabilizes at 3350 again, the bulls may rise again.
From the 4-hour chart, gold currently shows signs of a head and shoulders bottom. If the 4-hour chart stabilizes above 3340 again, the suppression level of 3350 may be directly broken. Next, it may directly touch the high level of 3380-90. Therefore, in terms of operation, I suggest that you can maintain long positions at 3320-30.
The first target is 3340-50. As long as the 4-hour chart stabilizes above 3340, you can continue to look at 3380-90.

Trend Continuation After NonfarmToday's D1 candle started to continue the trend of NF with a decrease to 3306 in the Asian session this morning.
The bearish structure of Gold Price will continue in today's trading session towards important support zones.
The downtrend of Gold was only broken with a candle closing back above 3324. And the downtrend may reach support 3275 today.
Support 3297-3275
Resistance 3324-3343-3364
SELL Trigger: Break support 3296

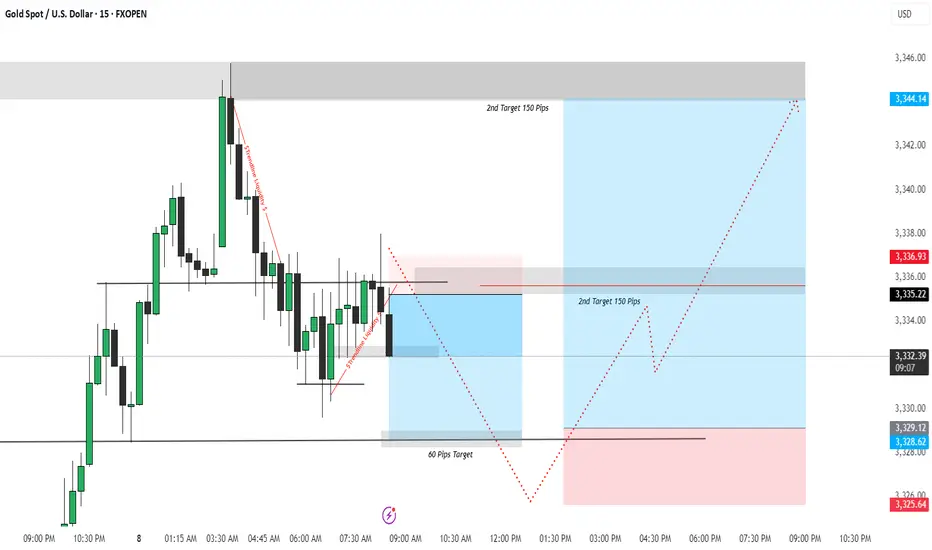
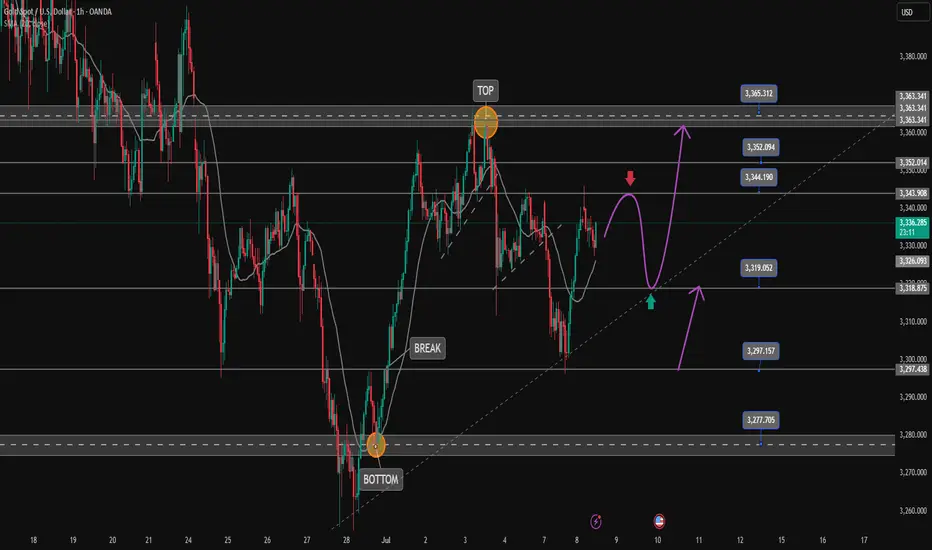
XAUUSD - Liquidity Sweep & Smart Money Play | Dual Setup BreakdoFOREXCOM:XAUUSD
Liquidity Sweeps
Smart Money Concepts (SMC)
Trendline Liquidity
Demand/Order Blocks
Risk-Reward Structure
🔻 First Trade Idea – Short Position (Sell Setup)
🧠 Psychology & Liquidity Insight:
The market formed equal lows before a sudden rally which attracted retail traders.
Price created a bearish structure with lower highs, signaling weakness.
A strong liquidity sweep occurred by breaking trendline liquidity twice (as shown by red lines), targeting early buyers' stop losses.
A supply zone (red box) was respected near 3337, providing an ideal entry point for shorting.
📉 Trade Logic:
Entry: Near 3336.93 (Supply Zone)
SL: Above 3344.14 (Liquidity Sweep zone)
TP: 3328.62 / 3325.64 (Targeting demand imbalance & internal liquidity)
R:R: Approx. 1:2+
🔺 Second Trade Idea – Long Position (Buy Setup)
🧠 Psychology & Liquidity Insight:
After the initial selloff, price taps into the demand zone (blue box) created by the last impulsive move.
Internal liquidity is built again near 3328–3330, where retail traders expect a continued fall — ideal for smart money to reverse.
Price is expected to accumulate and reverse with a strong rally toward the upper liquidity resting above 3344.
📈 Trade Logic:
Entry: Near 3328.62 (Demand Zone Tap)
SL: Below 3325.64
TP: 3344.14 (Major Liquidity Target)
R:R: Over 1:3 – a high-quality reversal play.
🎯 Why This Trade Setup is Powerful:
✅ Both trades are liquidity-driven, not just indicator-based.
✅ Incorporates smart money logic and price structure.
✅ Clear risk-to-reward, validated by price behavior and institutional order flow.