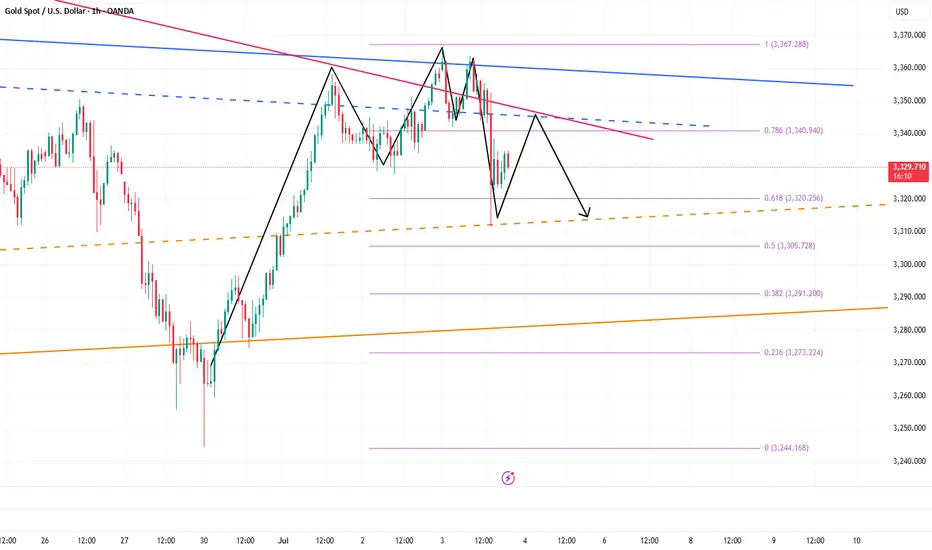
Continue to short gold, bears will exert force againAffected by the NFP market, gold fell precipitously, almost giving back 50% of the gains in the previous wave, and the short-selling performance was particularly strong; technically, gold successfully built a double-top structural resistance in the 3365-3363 area in the short term, which played a technical suppression role in the short term. As gold fell, the current short-term resistance moved down to the 3340-3350 area;
On the other hand, although gold began to rebound after falling to around 3312, it clearly showed the characteristics of weak rebound, and it did not even stand above 3340 once, and the long forces were insufficient; and technically, a single lower shadow line was not enough to support the continued rebound of gold, so gold still had the need to retrace the support below from a technical perspective; and once gold fell again, it was very likely to test the 3305-3295 area again.
So I think we can take advantage of the rebound of gold to short gold again. We can still short gold with the 3340-3350 area as resistance and look at the target area: 3315-3305-3295.
Goldprediction
Gold new ATH soon?🟡 GOLD LONG SETUP: Buying the Fear at Key Support 📈
ICMARKETS:XAUUSD
"Be fearful when others are greedy, and greedy when others are fearful" - Warren Buffett
The oscillator we developed is showing some compelling signals on gold right now, and the market sentiment couldn't be more perfect for a contrarian play. 💎
Technical Analysis:
Our custom oscillator is painting a clear picture at the bottom - we're seeing those beautiful green zones emerging after extended red periods
Price action has found solid support around the 3,300 level, creating a strong foundation for the next leg up
The fear in the market is palpable, which historically has been an excellent buying opportunity for precious metals
Volume profile suggests accumulation is happening at these levels
Why This Setup Works: 🎯
The beauty of this oscillator lies in its ability to identify when institutional money starts flowing back into gold during periods of maximum pessimism. When retail traders are panicking and selling, smart money is quietly accumulating.
Key levels to watch:
• Support: 3,300 (current zone)
• First target: 3,350
• Extended target: 3,400+
Risk Management: ⚠️
• Stop loss below 3,275
• Position sizing: Never risk more than 2% of account
• Trail stops as momentum builds
The oscillator's fear signals have been remarkably accurate in identifying these reversal points. When fear reaches extremes, that's typically when the best opportunities present themselves.
This is not financial advice - always do your own research and manage risk appropriately.
What are your thoughts on this setup? Are you seeing similar signals on your charts? 🤔
#Gold #XAUUSD #TechnicalAnalysis #BuyTheFear #Oscillator

GOLD swing longPlacing bids for potential 1-2 setup to the upside, grey box is ideal target for this setup to trigger however scaling in on spot won't hurt

XAUUSD – Gold at a Key AreaGold is now in a crucial zone with short potential.
If the market provides a valid bearish signal, I’ll take the short.
But if this zone breaks and confirms with a pullback, I’ll switch bias and go long.
💡 Remember:
We don’t control the market — we just try to profit using structure, setups, and solid risk management.
📌 Always risk max 1% per trade.
If the market goes against your bias, you only lose 1% — not your whole account.
🧠 One trade won’t make you rich,
But one reckless trade can destroy everything.
No gambling.
Just discipline, structure, and smart execution.

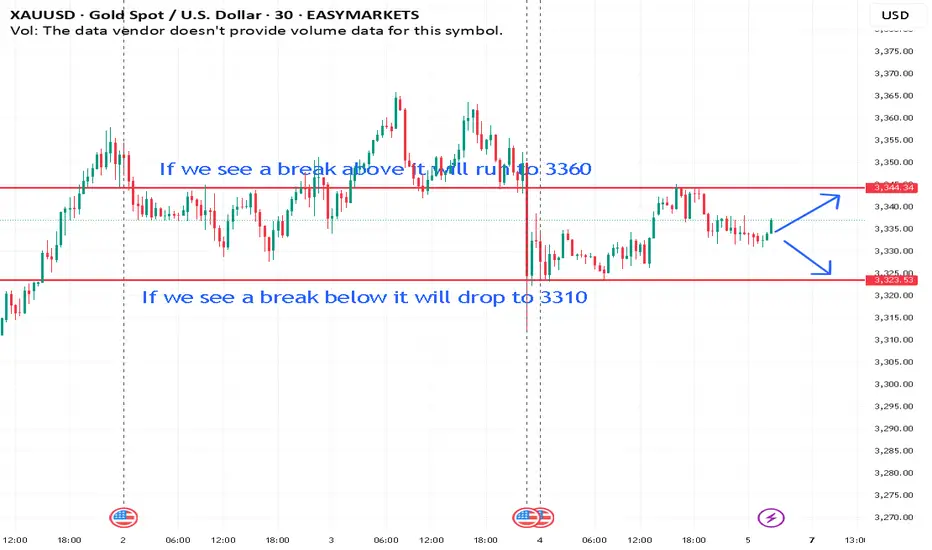
The bill was introduced; the price did not rise but fell.Due to the implementation of the US bill, most traders in the market are bullish on gold and believe that gold will soar on Monday. As a result, it jumped up and fell sharply this morning. This is the uncertainty of the market. Although the short position given near 3340 last Friday was late, it fell to the low point of 3306 at the opening of the Asian market today.
In addition, the key to this sharp drop is the high point before the rebound, that is, the starting point or the position of the top and bottom conversion. Once it is broken, you have to change your mindset. The volatile market is like this, just get used to it. The turmoil caused by Trump's bill will not appear for a while. It takes a process and cannot be unilaterally considered as bullish or bearish.
In the early Asian market, the price fell all the way from 3342 US dollars to 3306. How to judge the end of the decline? It is to stare at the high point of the rebound before the last decline of 3320 US dollars. The loss of 3300 US dollars in the early trading indicates that the gap-up opening is a lure for more.
Today, I think that 3325 above 3320 can be used as the dividing point between long and short positions. You can short with a light position near 3315, and pay attention to the 3295-3290 line below. After the upward breakthrough is confirmed, consider adjusting the position and making other arrangements. For the time being, we will look at the weak adjustment during the day.

GOLD CONFIRM TRADE🔍 Chart Analysis Summary:
Current Price: ~3,336
Key Resistance (Supply Zone): 3,340 – 3,353
Major Resistance Above: 3,388 – 3,395
Key Support (Demand Zone): 3,320 – 3,330
Major Support Below: 3,294 – 3,305
⚔️ Trade Setup Ideas:
📉 Sell Setup (High Probability Intraday Short)
Scenario: Price is near the lower supply zone (3,340–3,353), showing rejection.
Entry: 3,340 – 3,345 (on bearish candle confirmation or rejection wick)
Stop Loss: Above 3,353 (zone high or recent swing high)
Take Profit Targets:
TP1: 3,330 (first minor support)
TP2: 3,320 (demand zone)
TP3: 3,295 (major support)
📌 Confirmation Tips:
Look for bearish engulfing / rejection candles
RSI divergence or weakness
Break of 3,330 support confirms continuation
📈 Buy Setup (If Price Drops to Demand)
Scenario: Price drops back into demand zone 3,320–3,330 with bullish reaction.
Entry: 3,322 – 3,328 (bullish wick or engulfing candle)
Stop Loss: Below 3,320
Take Profit Targets:
TP1: 3,340
TP2: 3,353 (supply)
TP3: 3,388 (major resistance)
📌 Confirmation Tips:
Bullish price action near 3,322 zone
Momentum buildup from demand
Use M15/M30 for refined entry

Current outlook for XAUUSD for the july 7th -11th 2025Support and resistance tells us to watch for price action around $3325 - $3345. Either a possible short at 3345 if rejected, or possible further downside if it breaks below 3325.
Big changes begin. Dominant trend?Event summary:
The United States passed the Big and Beautiful Act; how to get this part of the tax after the massive tax cut? Then it can only be obtained through other means, and the tariff war initiated by Trump is one of them. At the same time, the bill will increase the federal debt by trillions of dollars, further widening the gap between the rich and the poor.
Immediately after the bill was signed and took effect, Musk announced the establishment of the "American Party". He wrote: We live in a one-party state, not a democratic country. Today, the American Party is established to return your freedom to you. At the same time, Musk posted on July 6, when and where should we hold the first congress of the "American Party"? This will be very interesting.
This event is likely to support the trend change of gold bulls in the short term.
Market analysis:
From the daily chart, after bottoming out and rebounding this week, the weekly line closed higher, and there is still upward momentum next week; short-term focus on the pressure of the 3345-3365 range, which is likely to become a key area for long and short competition. Before breaking upward, focus on the high and fall. Pay attention to the support rebound of 3320-3325 area below. Once the upper pressure range is broken, the bullish space will expand, and it is not ruled out that it will hit above 3400 and then go down.
In terms of operation, the price falls back and buy on dips in the 3315-20 area, and pay attention to the profit range of 3345-3365 on the upside.

Gold continues to fluctuate, where will it go next week?Fundamental analysis:
With the Trump administration's massive tax cut and spending bill officially implemented, the U.S. Treasury may start a "supply flood" of short-term Treasury bonds to make up for the trillions of dollars in fiscal deficits in the future. The market has begun to respond to future supply pressures. Concerns about the oversupply of short-term Treasury bonds have been directly reflected in prices - the yield on 1-month short-term Treasury bonds has risen significantly since Monday this week. A closer look at non-agricultural new jobs exceeded expectations, but nearly half came from government departments, which is likely to reverse in July. Slowing wage growth, declining total working hours, stagnant wage income growth, and worrying consumer spending are all signs of support for gold.
Gold bottomed out and rose from the low of 3245 this week, and then soared all the way to 3365. Finally, the weekly line closed with a positive line with an upper shadow. From the overall trend, after the data is digested, next week will still be treated with a volatile mindset. The large range will focus on the 3280-3393 area. If it does not break, it will still be mainly a sweeping operation. On the daily line, it also closed with a positive line with a long upper shadow, and closed firmly above 3323. It repeatedly tested the pressure of 3345 and did not break and fell back. The structure still maintained an oscillation rhythm within a small range. From the 4-hour cycle, the Bollinger Bands closed significantly. If it opens normally next week, pay attention to the 3325-3315 and 3311 areas when it falls back to support, and pay attention to the 3357 and 3365 positions when it hits the high pressure. It is recommended to maintain the strategy of selling high and buying low in operation and respond to the trend.For more specific operational details and strategy updates, please pay attention to the notifications at the bottom 🌐 and follow them in time.

Trump's new tariffs are coming, will gold soar?
✏Hello everyone, let's comment on the gold price next week (July 7, 2025-July 11, 2025)
. ⭐️Gold Information:
This week, the spot gold price showed a trend of rising first and then falling. From Monday to Wednesday, driven by safe-haven demand and the weakness of the US dollar, the gold price recorded three consecutive increases, climbing rapidly from US$3,271/ounce to the intraday high of US$3,365/ounce on Wednesday afternoon, showing strong upward momentum. However, on Thursday, before the release of the June non-farm payrolls data, market sentiment turned, and the gold price plummeted to US$3,312/ounce, the largest single-day drop in the week. On Friday, affected by the light trading during the US Independence Day holiday, the gold price fluctuated between US$3,330 and US$3,355/ounce, closing at around US$3,337/ounce, up about 1.91% for the week.
U.S. President Donald Trump announced that the U.S. will begin sending formal letters to trading partners on Friday, ahead of a July 9 deadline, outlining new tariffs ranging from 10% to 70%, which will take effect on August 1. Treasury Secretary Scott Bessant added that a series of trade agreements are expected before the deadline, with an estimated 100 countries facing reciprocal tariffs of at least 10%. He also hinted that some agreements will be announced soon.
⭐️Labaron personal comment:
Gold prices continue to consolidate sideways, fluctuating in the 3242-3450 range
The following important key areas have been identified:
Resistance: $3362, $3393, $3446
Support: $3312, $3279, $3241

Gold opening market strategy analysis
💡Message Strategy
In the case of all negative non-agricultural data, gold did not fall below the support of 3300, which shows that gold bulls are still the main trend. The current daily pattern of gold is three positives, one negative and one positive. The trend of the opening next Monday is also very important. Once it continues to rise and rebound to break through the suppression, the bulls will open the door to regain the 3400 mark.
At present, the short-term pressure is still maintained at 3345-50, which is also the first point for the bulls to break through. Once the breakthrough is successful, the next target will be around 3365-3370.
📊Technical aspects
From the 4-hour analysis, the support at 3330 is concerned, and the support at 3320 is concerned. The short-term resistance at 3345-50 is concerned, and the suppression at 3365-70 is concerned. The overall low-multiple cycle participation is maintained. In the middle position, watch more and do less, and be cautious in chasing orders, and wait patiently for key points to participate. Pay attention to the specific operation strategy in time.
💰Strategy Package
Long Position:3320-3330,SL:3305,Target: 3370

GOLD/USD Bearish Rejection From Resistance Zone – Potential DropGOLD/USD Bearish Rejection From Resistance Zone – Potential Drop Ahead! 🎯
📊 Technical Analysis Summary:
The chart illustrates a bearish setup forming after multiple rejection points near a key resistance zone around 3,360–3,380 USD.
🔍 Key Observations:
🔴 Double Rejection Pattern:
Red arrows highlight strong bearish rejections from resistance.
Indicates sellers are defending this zone aggressively.
🟠 Support Turned Resistance:
The previous support (labelled as "SUPPOT") is now acting as resistance.
Classic bearish retest behavior.
🔷 Bearish Flag Formation:
Price consolidates in a descending flag pattern.
Breakdown below the flag suggests continuation to the downside.
🎯 Target Zone:
If breakdown confirms, price may drop towards target area near 3,275–3,280 USD (marked as “TARGET FAXS”).
🟧 Important Reaction Zones:
Multiple orange circles indicate zones of high reaction – historically significant for both buyers and sellers.
📌 Conclusion:
Unless bulls reclaim the 3,360–3,380 resistance zone convincingly, the bias remains bearish, and the next leg down may target the 3,280 USD area.
🔔 Traders should watch for a clean break below 3,320 to confirm bearish continuation.

GOLDGOLD needs more upside after this correction, next reaction will be coming above 3345 and if consolidates it's a push up further towards 3380 otherwise drop from 3345 above and push up again from below 3300.
Disclosure: We are part of Trade Nation's Influencer program and receive a monthly fee for using their TradingView charts in our analysis.

GOLD 1H CHART ROUTE MAP UPDATE & TRADING PLAN FOR THE WEEKHey Everyone,
Please see our updated 1h chart levels and targets for the coming week.
We are seeing price play between two weighted levels with a gap above at 3358 and a gap below at 3330. We will need to see ema5 cross and lock on either weighted level to determine the next range.
We will see levels tested side by side until one of the weighted levels break and lock to confirm direction for the next range.
We will keep the above in mind when taking buys from dips. Our updated levels and weighted levels will allow us to track the movement down and then catch bounces up.
We will continue to buy dips using our support levels taking 20 to 40 pips. As stated before each of our level structures give 20 to 40 pip bounces, which is enough for a nice entry and exit. If you back test the levels we shared every week for the past 24 months, you can see how effectively they were used to trade with or against short/mid term swings and trends.
The swing range give bigger bounces then our weighted levels that's the difference between weighted levels and swing ranges.
BULLISH TARGET
3358
EMA5 CROSS AND LOCK ABOVE 3358 WILL OPEN THE FOLLOWING BULLISH TARGETS
3389
EMA5 CROSS AND LOCK ABOVE 3389 WILL OPEN THE FOLLOWING BULLISH TARGET
3416
EMA5 CROSS AND LOCK ABOVE 3416 WILL OPEN THE FOLLOWING BULLISH TARGET
3439
BEARISH TARGETS
3330
EMA5 CROSS AND LOCK BELOW 3330 WILL OPEN THE FOLLOWING BEARISH TARGET
3306
EMA5 CROSS AND LOCK BELOW 3306 WILL OPEN THE SWING RANGE
3283
3254
As always, we will keep you all updated with regular updates throughout the week and how we manage the active ideas and setups. Thank you all for your likes, comments and follows, we really appreciate it!
Mr Gold
GoldViewFX

GOLD 4H CHART ROUTE MAP UPDATE & TRADING PLAN FOR THE WEEKHey Everyone,
Please see our updated 4h chart levels and targets for the coming week.
We are seeing price play between two weighted levels with a gap above at 3301 and a gap below at 3242. We will need to see ema5 cross and lock on either weighted level to determine the next range.
We will see levels tested side by side until one of the weighted levels break and lock to confirm direction for the next range.
We will keep the above in mind when taking buys from dips. Our updated levels and weighted levels will allow us to track the movement down and then catch bounces up.
We will continue to buy dips using our support levels taking 20 to 40 pips. As stated before each of our level structures give 20 to 40 pip bounces, which is enough for a nice entry and exit. If you back test the levels we shared every week for the past 24 months, you can see how effectively they were used to trade with or against short/mid term swings and trends.
The swing range give bigger bounces then our weighted levels that's the difference between weighted levels and swing ranges.
BULLISH TARGET
3364
EMA5 CROSS AND LOCK ABOVE 3364 WILL OPEN THE FOLLOWING BULLISH TARGETS
3429
EMA5 CROSS AND LOCK ABOVE 3429 WILL OPEN THE FOLLOWING BULLISH TARGET
3499
EMA5 CROSS AND LOCK ABOVE 3429 WILL OPEN THE FOLLOWING BULLISH TARGET
3499
EMA5 CROSS AND LOCK ABOVE 3499 WILL OPEN THE FOLLOWING BULLISH TARGET
3561
BEARISH TARGETS
3295
EMA5 CROSS AND LOCK BELOW 3295 WILL OPEN THE SWING RANGE
3242
3171
EMA5 CROSS AND LOCK BELOW 3171 WILL OPEN THE SECONDARY SWING RANGE
3089
3001
As always, we will keep you all updated with regular updates throughout the week and how we manage the active ideas and setups. Thank you all for your likes, comments and follows, we really appreciate it!
Mr Gold
GoldViewFX

GOLD DAILY CHART ROUTE MAP Hey Everyone,
Please see update and plans for the coming week on our Daily chart idea that we have been tracking.
After wrapping up last week and actively tracking the 1h and 4h structures throughout last week within the daily chart overall structure. This brings everything together and reminds us how the broader structure has continued to evolve in our favour.
The bounce off at 3272 that we outlined has now fully played out, showing yet again how critical these Goldturn levels are in guiding our strategy.
Following the clean rejection at the channel top near 3433, price moved precisely into the 3272 support, where we were focused on structure to hold. That level held beautifully, giving us a strong technical base for upward continuation.
As we head into the new week, we’ve once again seen price find support at 3272, with a clean bounce that opens up the potential for price to fill the gap back toward 3433, as long as EMA5 remains above 3272. This dynamic will be a key technical trigger for us to monitor in the coming sessions.
There was no EMA5 cross and lock breakdown, which confirmed that buyers maintained control at this level. That absence of breakdown was our confirmation that the bounce structure was not only valid, but likely to continue unfolding into the new week.
As price grinds its way back up the channel, we’ll keep watching for reactions at key resistance zones, with special attention to 3433, the channel top. The measured structural reaction from 3272 has been perfect and supports our method of trading level to level, always with patience and discipline.
Key Levels to Watch This Week:
🔼 Resistance: 3433 (channel top, gap target)
🔽 Support: 3272 (confirmed bounce zone)
Thanks again for all the support, likes, comments, and follows are always appreciated.
Wishing you all a strong start to the week ahead!
Mr Gold
GoldViewFX

GOLD MONTHLY CHART LONG TERM/RANGE ROUTE MAPHey Everyone,
We’ve just released our new Monthly Chart idea, which we’ll now be tracking following the successful completion of our previous long term monthly chart idea. That one played out beautifully, and now it’s time to shift focus to the next big setup.
Currently, price is trading above the channel midline, and we’ve also seen an important EMA5 cross and lock above 3099, with a candle body close confirming a long term gap above at 3557.
While this confirms the bullish long term structure, we’re also mindful of the potential for a short term retracement, particularly around the EMA5 detachment zone (highlighted with a circle on the chart). This would offer a healthy dip opportunity, aligning perfectly with our strategy to buy into weakness on the way up.
For the bigger structure to remain intact, we’ll be looking for 3099 to continue holding as key structural support. As long as that level is respected, the long term gap toward 3557 remains firmly in play.
This is a higher timeframe idea that we’ll be building on as structure continues to unfold.
We will continue to use all support structures, across all our multi time frame chart ideas to buy dips also keeping in mind our long term gaps above. Short term we may look bearish but looking at the monthly chart allows us to see the bigger picture and the overall long term Bullish trend.
As always, we will keep you all updated with regular updates throughout the week and how we manage the active ideas and setups. Thank you all for your likes, comments and follows, we really appreciate it!
Mr Gold
GoldViewFX

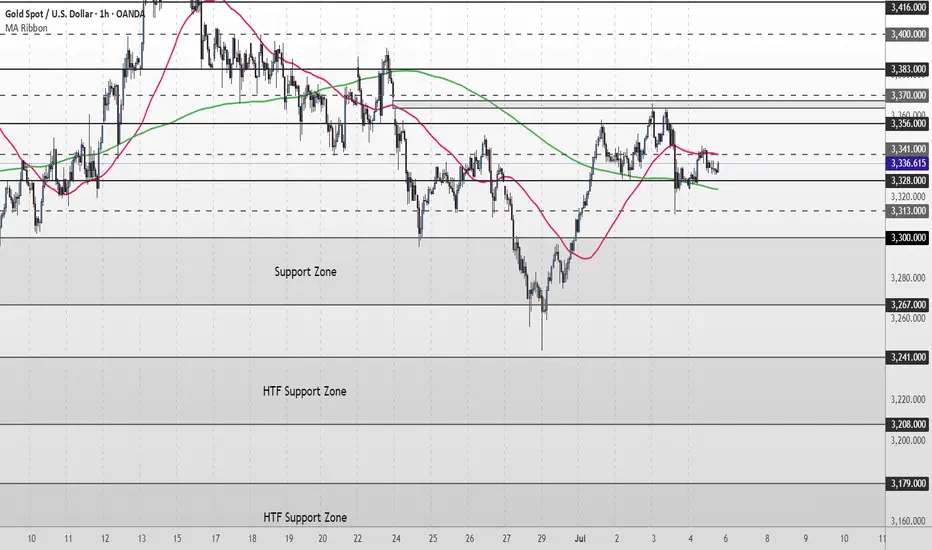
XAU/USD Weekly & Daily Outlook | What’s Next for Gold?Gold starts the new trading week still locked in a consolidation range, holding just above the $3,328–$3,327 support zone. Despite multiple attempts, price continues to struggle at the $3,356 resistance.
The 50MA and 200MA are now compressing, suggesting the market is preparing for a breakout. Until then, structure remains neutral and range-bound.
📌Key levels to watch:
Resistance:
$3,356 ‣ $3,383 ‣ $3,400 ‣ $3,416 ‣ $3,440
Support:
$3,328 ‣ $3,313‣ $3,300 ‣ $3,267 ‣ $3,241
‣ $3,208 / $3,179 – Deeper downside if bearish pressure builds
🔎 Fundamental Focus
The key risk event this week is Wednesday’s FOMC Meeting Minutes. Markets will be looking for clues on the Fed’s internal stance regarding future rate cuts and inflation expectations.
🔗 Follow for live updates and intraday chart setups.
Gold continues to fluctuate. The direction is uncertain.Gold prices did not have a large continuation breakthrough on Friday due to the impact of the US Independence Day holiday; although the non-agricultural data on Thursday fell rapidly under the unfavorable conditions and formed a bottoming-out situation, the short-term bulls and bears were once again in a deadlock. After a small sideways movement on Friday morning, it rose again. Although it did not break through the upper pressure line of 3345, it still closed in the form of a positive line, which also gave the bulls hope to dominate next week.
At present, the upper key pressure is still maintained at the 3345 line, which is also the first point for the bulls to break through. Once the upper breakthrough is successful, the next target will be maintained at around 3365-3380. The support below is maintained at around 3325. If this position is broken down on Monday, the support of 3325 will not be maintained, and the bears will continue to open the downward channel.
But overall, the market direction is still unclear, and we can conduct trial transactions. Go long when the price falls back to 3325 on Monday in the Asian market, the profit range is 3340-3350, and the stop loss is 3315. If the European market continues to strengthen, you can still go long. If the European market continues to strengthen, we can still continue to go long. Otherwise, we still need to adjust our thinking in a timely manner.

XAUUSD (Upcoming Plan with 2 Scenarios) Analysis for the upcoming week (InShaaAllah) (2 Scenarios)
Breaking: Trump says tariff letters to 12 countries signed, going out Monday...
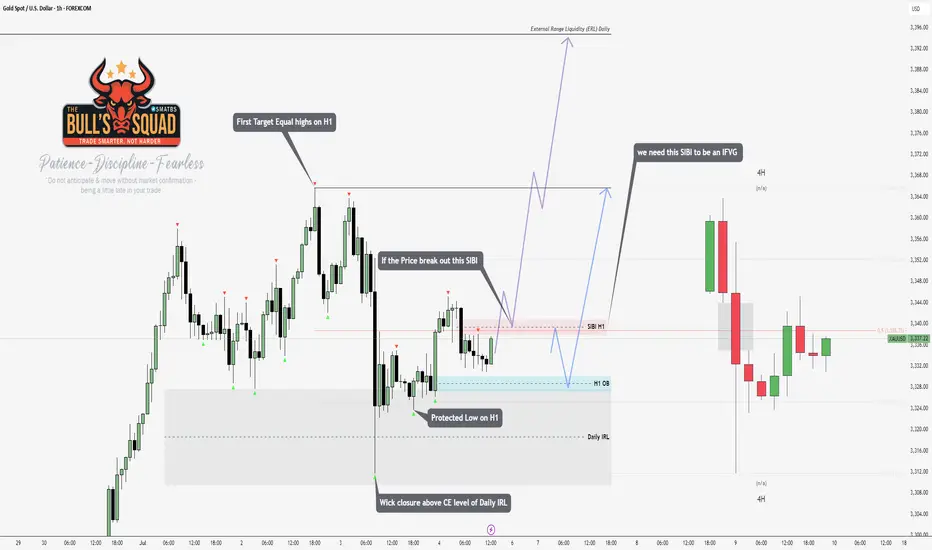
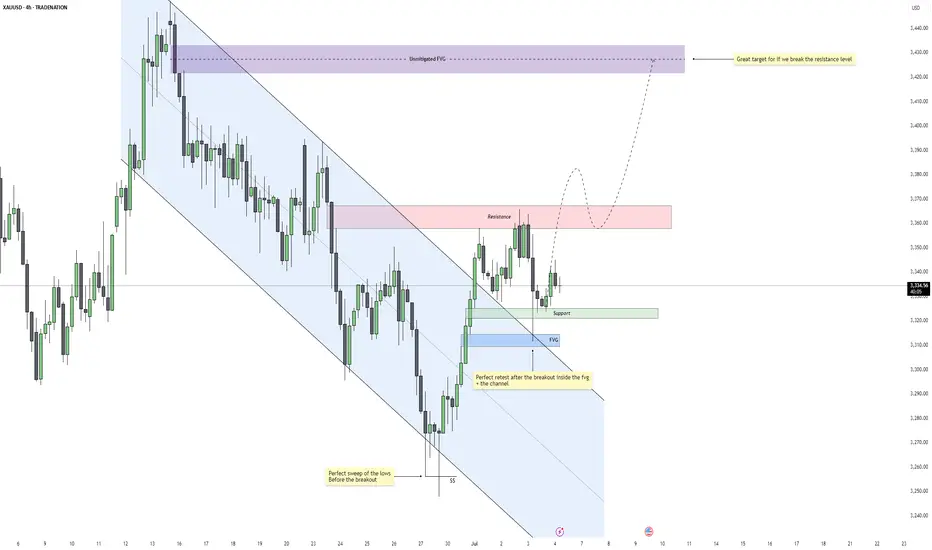
Gold – Is $3430 the Next Target After This Breakout?Gold recently completed a clean sweep of the 4H swing lows, taking out downside liquidity just before breaking out of a well-defined descending channel. This move marked a shift in momentum and structure, suggesting that the bearish leg may have concluded and the market is now transitioning into a more bullish phase.
Breakout Confirmation and Retest Zone
Following the breakout, price retraced and tapped directly into a confluence area where a fair value gap aligns with the upper boundary of the broken channel. This acted as a high-probability retest zone, and the reaction was strong. The market respected this structure perfectly, adding conviction to the breakout's validity.
Support and Resistance Dynamics
Currently, price is hovering between a nearby support level and a short-term resistance zone above. The support is holding firm after the retest, while the resistance is capping upward momentum for now. This is a healthy consolidation following the breakout, and it provides a clear structure for monitoring continuation.
Imbalance Target and Flow Outlook
Should the market gain enough strength to break through the overhead resistance, there is a large unmitigated imbalance further above that stands as a strong magnet. It represents a clean fair value gap left behind during the previous selloff and could be the next major draw if bullish momentum continues.
Overall Flow and Trade Logic
The sequence is very clean: sweep of liquidity, bullish breakout, efficient retest, and now consolidation above support. As long as price continues to form higher lows and respect the current structure, the probability of further upside remains favorable. Patience around the resistance area will be key for confirmation.
Conclusion
Gold is displaying a textbook reversal setup driven by liquidity and structure. If the current support continues to hold and buyers reclaim control above resistance, the path toward the upper imbalance becomes highly probable. The market is aligned for continuation, with bullish momentum building gradually.
Disclosure: I am part of Trade Nation's Influencer program and receive a monthly fee for using their TradingView charts in my analysis.
___________________________________
Thanks for your support!
If you found this idea helpful or learned something new, drop a like 👍 and leave a comment, I’d love to hear your thoughts! 🚀
This week's market review and next week's market strategy analys
Gold trading has ended this week. This week can be said to be very exciting. It closed with a positive line this week, with the lowest point near 3247, and then rebounded to 3365 and then retreated. When the non-farm data were all negative, the lowest point fell to 3311 and rebounded. Gold did not fall below the support of 3300. This shows that the gold bulls are still there. We also went long at the bottom many times after the non-farm data. I believe that traders who follow me can see that we have publicly gone long at 3324 many times and exited with all profits. We firmly believe that the retracement is an opportunity to go long, and the market result is just as I analyzed. The bulls returned to the range before the non-farm data. Since the market is closed on Friday for Independence Day, the overall fluctuation of gold will not be large. We will continue to be bullish on gold next week, and the operation will continue to be mainly based on retracement and long. If your current gold operation is not ideal, I hope I can help you avoid detours in your investment. Welcome to communicate with me.
From the 4-hour analysis, pay attention to the 3324 support line below, focus on the 3316 support line, and pay attention to the 3345-50 short-term resistance above, and focus on the 3365-70 line suppression. The overall low-multiple cycle participation main tone remains unchanged. In the middle position, watch more and do less, be cautious in chasing orders, and patiently wait for key points to participate. I will release signals on the free channel for specific operation strategies, and pay attention in time.
Gold operation strategy:
Gold 3324-30 line long, stop loss 3315, target 3365-70 line, continue to hold if broken

XAU/USD possible shorts from 3,350 towards 3,290 longsThis week, my focus is on a potential sell setup that could form within the 4-hour supply zone, which is currently near price. I’ll be patiently watching for signs of Wyckoff distribution within this point of interest (POI), which could confirm a short opportunity.
Given that price action has been bearish, this would be a pro-trend setup, especially with the visible liquidity resting below that we can look to target. Additionally, there is an 8-hour demand zone further below, which may provide a potential long opportunity once price reaches that level.
Confluences for GOLD Sells:
- Bearish market structure: Gold has been trending downward and has recently left behind a clean, unmitigated 4-hour supply zone, which could prompt a bearish reaction.
- Liquidity targets below: There's significant liquidity under recent lows, including Asia session lows and the 8-hour demand zone, which can be targeted.
- DXY correlation: The dollar has reacted strongly from a notable demand zone, suggesting potential upside for DXY, which may add bearish pressure on gold.
- Higher timeframe Wyckoff: A Wyckoff distribution pattern has also formed on the higher timeframe, which may indicate temporary bearish order flow.
P.S. If price disrespects the current 4-hour supply zone, I will shift focus to an extreme 3-hour supply zone above. Until price reaches that level, I may look for short-term buy setups to trade the move up.
Wishing everyone a great and profitable trading week! Stay disciplined and manage risk accordingly.
