XAU/USD 11 August 2025 Intraday AnalysisH4 Analysis:
-> Swing: Bullish.
-> Internal: Bullish.
You will note that price has targeted weak internal high on three separate occasions which has now formed a triple top, this is a bearish reversal pattern and proving this zone is a strong supply level. This is in-line with HTF bearish pullback phase.
Remainder of analysis and bias remains the same as analysis dated 23 April 2025.
Price has now printed a bearish CHoCH according to my analysis yesterday.
Price is now trading within an established internal range.
Intraday Expectation:
Price to trade down to either discount of internal 50% EQ, or H4 demand zone before targeting weak internal high priced at 3,500.200.
Note:
The Federal Reserve’s sustained dovish stance, coupled with ongoing geopolitical uncertainties, is likely to prolong heightened volatility in the gold market. Given this elevated risk environment, traders should exercise caution and recalibrate risk management strategies to navigate potential price fluctuations effectively.
Additionally, gold pricing remains sensitive to broader macroeconomic developments, including policy decisions under President Trump. Shifts in geopolitical strategy and economic directives could further amplify uncertainty, contributing to market repricing dynamics.
H4 Chart:
M15 Analysis:
-> Swing: Bullish.
-> Internal: Bullish.
H4 Timeframe - Price has failed to target weak internal high, therefore, it would not be unrealistic if price printed a bearish iBOS.
The remainder of my analysis shall remain the same as analysis dated 13 June 2025, apart from target price.
As per my analysis dated 22 May 2025 whereby I mentioned price can be seen to be reacting at discount of 50% EQ on H4 timeframe, therefore, it is a viable alternative that price could potentially print a bullish iBOS on M15 timeframe despite internal structure being bearish.
Price has printed a bullish iBOS followed by a bearish CHoCH, which indicates, but does not confirm, bearish pullback phase initiation. I will however continue to monitor, with respect to depth of pullback.
Intraday Expectation:
Price to continue bearish, react at either M15 supply zone, or discount of 50% internal EQ before targeting weak internal high priced at 3,451.375.
Note:
Gold remains highly volatile amid the Federal Reserve's continued dovish stance, persistent and escalating geopolitical uncertainties. Traders should implement robust risk management strategies and remain vigilant, as price swings may become more pronounced in this elevated volatility environment.
Additionally, President Trump’s recent tariff announcements are expected to further amplify market turbulence, potentially triggering sharp price fluctuations and whipsaws.
M15 Chart:
Goldprediction

Market trend forecast and layout at the beginning of the week#XAUUSD
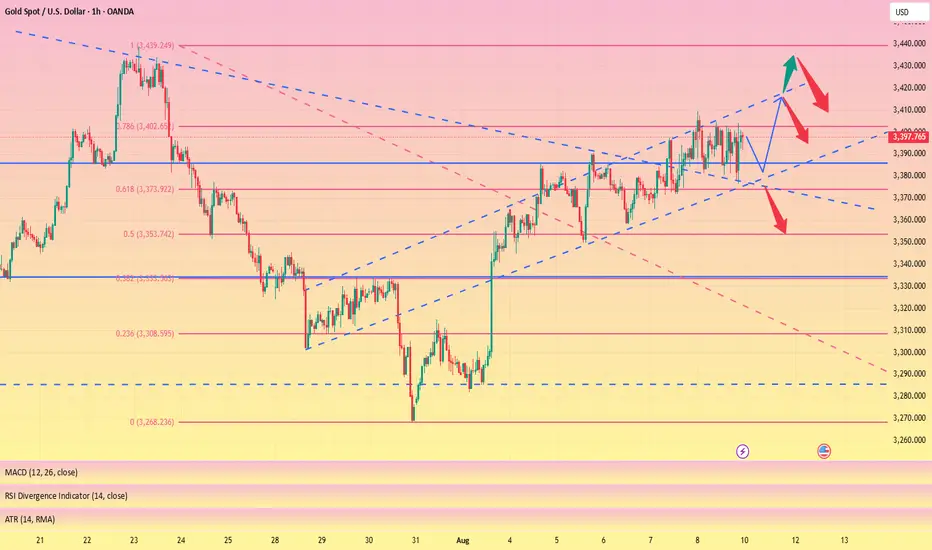
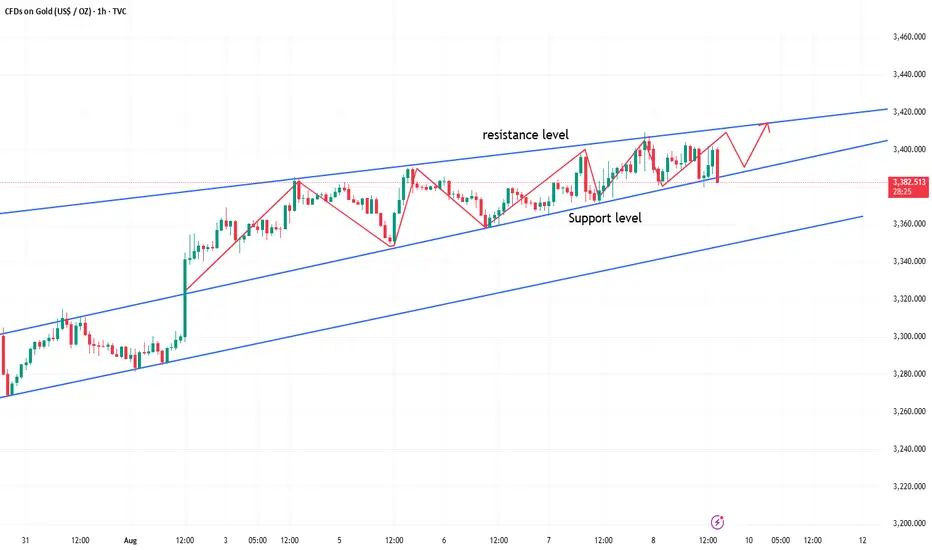
On Friday night, gold prices fluctuated rapidly before closing due to news, and finally closed near 3397. Currently, gold is fluctuating and consolidating in the 3400-3380 range. This pattern not only reflects the fierce game between bulls and bears, but also suggests that the market may be brewing a new breakthrough direction. Therefore, we need to be particularly vigilant about potential breakouts next week.
Judging from the market alone, gold is still in an upward trend channel, so at the beginning of the week we can focus on the effectiveness of the support between 3390-3380. If the support level of 3390-3380 below remains solid and the hourly line breaks through and stabilizes above 3400, then the gold price may test the key resistance level of 3410 again. Once it breaks through, it is expected to reach 3420-3430.
Gold continues to rise. Is there a chance of a decline?There were reports that Trump intended to classify imported gold under a customs code subject to taxation, but the White House later responded by dismissing the rumors. However, it seems that Trump's obsession with increasing prices remains.
Gold is likely to remain in a high-level, volatile pattern next week, with a low probability of a direct break below the 3375 support level. Despite last Friday's bearish candlestick pattern, the key support level of 3375 has been repeatedly tested without a significant break, and the market has remained firmly above it, demonstrating the resilience of bulls.
Currently, the moving average system is pointing upward, but the trend is relatively flat, making it difficult for bulls to launch a strong breakthrough in the short term. The 3410 level has formed a strong resistance level, with repeated attempts to break through it failing effectively. The upward momentum is currently showing signs of slowing. If bulls truly strengthen, the retracement should narrow and the upward trend can continue. The current trend lacks new catalysts, and the market needs time to digest the pressure.
On the whole, the price will continue to fluctuate in the narrow range of 3375-3410 at the beginning of next week, and both the upward and downward movements are waiting for new catalysts. Quaid believes that at the beginning of the week, the price may tend to try to go long first and then short at the 3375 support, but the upward space should be at the suppression position of 3410.

Be Ready ! The Price of GOLD will Rise.Gold (XAUUSD) is on a strong upward trajectory, with signs pointing to higher prices ahead. The market momentum suggests that gold is preparing to break past its previous all-time high (ATH).
The demand for gold as a safe-haven asset is increasing, and key resistance levels are under pressure. If the breakout happens, we could see gold reaching new heights.
Stay prepared, as this move has the potential to offer significant opportunities. Trade with caution and follow your risk management plan!

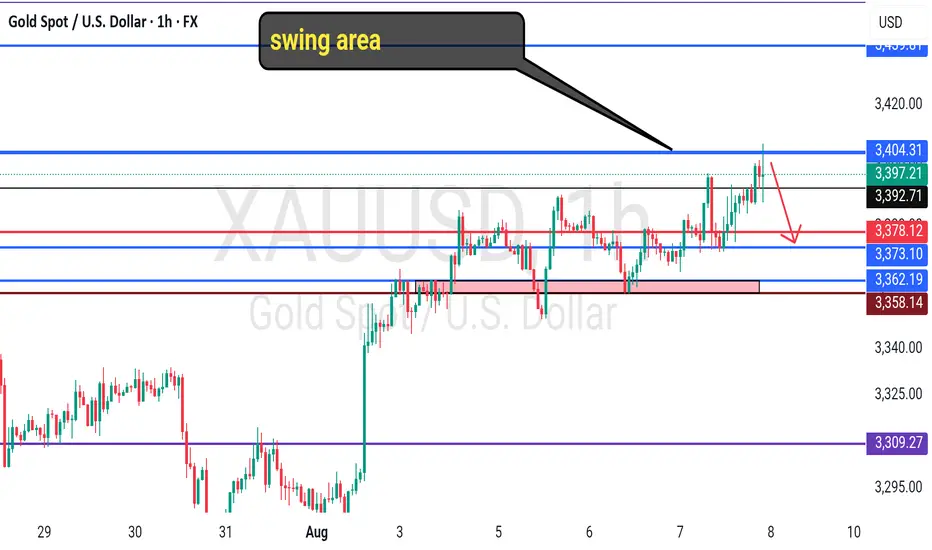
Gold & DXY Analysis 09/08/2025Support Zone: 3276
Resistance Zone: 3400
With CPI and PPI failing to meet forecasts repeatedly and Trump's direction to tariff 100-ounce gold bar imports, the US Dollar Index (DXY) will continue its bearish downtrend structure. We can confirm this through the 1-hour and 4-hour failed change of character to create new highs inside the bullish structure.
Gold formed higher lows (HL) and lower highs (LH) however, failed to break higher highs (HH) and lower lows (LL) while in a consolidation range in the lower timeframes. This gives me confidence that price has a high probability of continuing the bullish trend structure to the upside.
Added support to push past 3400 is through the daily timeframe where we can see a double top and bottom formed on 13 June to 31 July between our support and resistance zone creating higher highs but failing to break our lower lows.
This suggests that Spot Gold will move towards 3441 pips or 3499 pips through the week with the coming news and current chart patterns.

Roadmap to 3982: Key Long Entries and Profit ZonesThe initial long entry zone is between 3290 and 3275 .
From this range, an uptrend is expected to begin, targeting 3416 , which is our first exit point to close the initial long position.
After that, we wait for the next long entry , ideally around 3333 to 3319 . A new upward movement from this range is expected to reach 3455 . At this level, we continue to hold the position while placing the stop loss at the entry level to protect profits.
The next take profit target is 3650 , which may be reached by the end of 2025 or in 2026.
The final target is 3982 , which is likely to be hit in 2026, as the market may not have enough strength to reach it in 2025.

XAUUSD – Is Gold Ready for Its Final Rally? 📈 Elliott Wave Analysis on XAUUSD – Is Gold Ready for Its Final Rally? 💥
On the daily chart of XAUUSD, we’re observing the completion of a wave 4 triangle correction (ABCDE), which seems to be setting the stage for the beginning of wave 5 in the larger bullish cycle.
✅ Wave 3 showed a strong impulsive structure, and now the wave 4 triangle suggests consolidation before an explosive breakout toward the $3900 zone.
📍Key Resistance: 3900
🌀 We're anticipating a breakout above the upper channel line, potentially launching a sharp move as wave 5 unfolds.
💬 Share your thoughts in the comments! Do you think gold is ready to break its all-time high?
🔥 Save this idea & follow for future updates!
------------------------------------------------------------------------------------------------------
🚀 Who am I?
I'm Mahdi, a prop firm trader with 7+ years of experience in technical analysis, mainly focusing on Smart Money Concepts and Elliott Wave theory.
I specialize in delivering high-quality trading signals, market insights, and educational content tailored for serious traders and investors.
📊 My Tools: SMC, Elliott Wave, Fibonacci, Liquidity Grabs, Order Blocks
💼 Prop Challenge Passed: Yes | Funded Account: In Progress
🔗 Follow for consistent updates and trading insights.

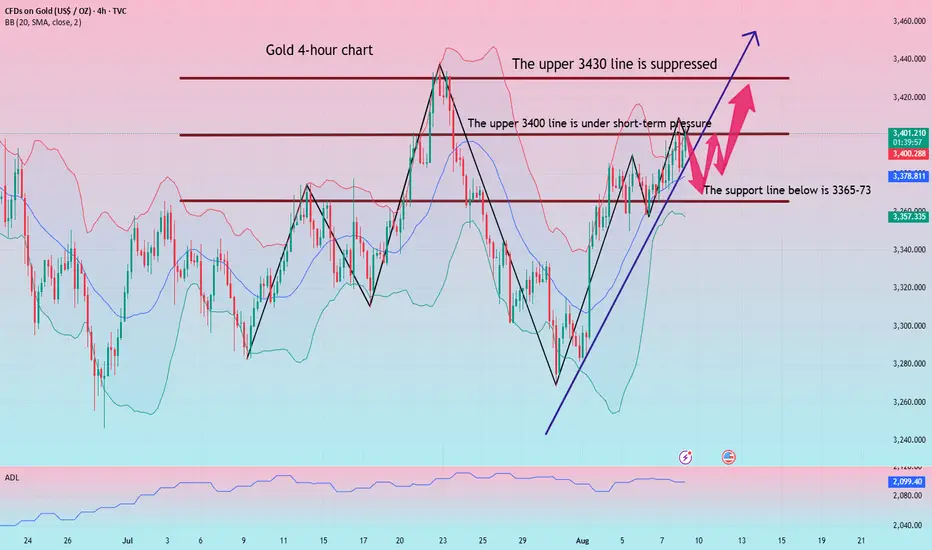
If gold holds steady at 3400, the impact on 3430 may be greater
Gold's pullback today also coincided with the 5-day moving average near 3380 on the daily chart. This level is crucial for bullish momentum and is crucial for the European session. If the European session continues to break through the upper resistance, the US market is likely to rise further. Conversely, if the European session experiences a weak and pressured pullback, and the magnitude is too large, the US market may lose its momentum to reach new highs. If your current trading is not ideal, I hope I can help you avoid investment pitfalls. Welcome to discuss your options!
Based on the 4-hour chart, support remains at 3365-73 today. If the price retraces to this level during the day, the bullish trend remains unchanged. The short-term bullish stronghold is at 3360. If the daily chart stabilizes above this level, the bullish trend remains unchanged. I will provide detailed trading strategies during the trading session, so stay tuned.
Gold Trading Strategy:
Go long on gold if it retraces to the 3375-83 level. Cover on a dip to the 3365 level. Set a stop-loss at 3353. Target: 3400-3410. Hold if it breaks through.
GOLD: Buy Dips Into DemandBuy the dip!
(H4) ✅ Bullish
Formed HL at 3355, strong displacement up from that zone
Current leg is targeting buy-side liquidity above 3432 and 3445
Unmitigated H4 demand: 3380–3388
(H1)
Series of HHs & HLs
Key Zone: 3380–3388
Next liquidity target / short-term resistance: 3432-3445
Wait for pullback into key zone or momentum break above 3405
(M15)
Micro bullish structure intact
Current short-term demand:3390–3395
Deeper demand: 3380–3388
Execution Triggers
Pullback Buy: Sweep 3380, M15 BOS above 3392, enter on retest
Breakout Buy: Break & close above 3405 with displacement, retest 3395–3400
❌ Invalidation
Break below 3355 = bullish structure compromised
Break below 3322 = trend shift to bearish

Grasp the trend accurately and have a crazy weekend!After testing the 3380 support level several times in a row today, gold maintained an oscillating upward trend. Today's layout of 3380 repeatedly went long, and 3400 shorts were all successfully closed with profits, with a total profit of 580pips. Currently, gold is oscillating at a high level in the 3404-3380 range. The possibility of a direction choice cannot be ruled out in the evening. If the market continues to be bullish in the evening, it is necessary to pay attention to whether the price will fall below 3380 when it tests the support level for the third time. If the support level is effectively broken, it is expected to fall to the key support level of 3370. If the price firmly stands above the 3400 mark, it may continue to test 3410. If there is no breakthrough either above or below, it will still maintain a range of oscillations, and the idea of selling high and buying low will be the main focus.

Excellent selling trades Delivered [550 pips]As I mentioned throughout Today's commentary session:
My strategy is sell from 3402-3405
Very happy with the profits so far multiple attempts after Back to back Tps HIT.
TODAY'S PROFITABLE TRADES 💰🙌
GOLD SELL 3400 60 PIPS BE
GOLD SELL 3402 200 PIPS TP
GOLD SELL 3401 130 PIPS TP
GOLD SELL 3400 190 PIPS TP
•4 consecutive WIN
•1 SETUP
Always follow your Setup & your path with Paitence and Discipline
My medium-term targets remain sucessfully delivered which is achieved alhumdullilah.
All I say thanks to those who followed us and made profits.

True or false? How to Decide Between Long and ShortInfluenced by the news related to tariffs, gold has just completed a fluctuation of nearly $20 in a very short period of time, breaking the silence of the gold market in one fell swoop. Separately, news indicates that the White House is planning to clarify the misinformation surrounding gold bar tariffs.
If there were traders who had rashly entered the market before, in the absence of strict trading system constraints and strict trading discipline, they would inevitably suffer certain losses regardless of whether they chose to go long or short.
This is also the reason why after giving my daily trading strategies, I will repeatedly emphasize the importance of strictly adhering to trading planning and discipline.
For ordinary traders, it's difficult to discern the authenticity of this news. After all, the Trump administration has a history of denying its own statements. Therefore, sometimes it's wise to remain on the sidelines.
This is also what I specifically reminded you to do when publishing my trading strategy this morning: be sure to trade with a small position today and be vigilant to potential unforeseen circumstances.
Next Stop 3420? Gold Bulls Push the Limit!Gold has shown a step-by-step rise in the short term, and has stood above 3,400 many times, and the bullish force is relatively strong. However, correspondingly, after gold stood above 3400, it fell under pressure several times, so the shape was not particularly good, which increased the risk of pullback in the short term.
However, we do not need to worry. Gold is still running in an ascending wedge structure. Although it has been under pressure and fallen back several times during the attack on 3400, the bullish structure has not been effectively destroyed so far. Moreover, with the sharp increase in gold buying, the 3380-3370 area below has become an obvious intensive trading area, which has greatly limited the gold retracement space.
In addition, after gold broke through 3340, market sentiment tended to be optimistic. If gold experiences a short-term pullback, more funds will flow into the gold market, especially for those who have missed out on long trades before, who will rush into the gold market even more frantically. Under the resonance of the current technical structure and market optimism, gold still has the potential to hit 3400, and bulls are even expected to stand firm at 3400 and make further efforts.
So in terms of short-term trading, I still advocate that gold pullbacks are buying opportunities. And I cherish the opportunity to enter the market and go long in the 3385-3375 area, and am optimistic that gold will hit 3400 again, and may even continue the bull trend to the 3420-3430 area.
OANDA:XAUUSD FOREXCOM:XAUUSD TVC:GOLD FX:XAUUSD CAPITALCOM:GOLD

GOLD ROUTE MAP UPDATEHey Everyone,
Great finish to the week with our chart idea playing out as analysed.
We complete dour Bullish target 3370 followed with cross and lock confirmation opening 3392 also completed this week. We now also have a cross and lock above 3392 opening 3416.
We will keep the above in mind when taking buys from dips. Our updated levels and weighted levels will allow us to track the movement down and then catch bounces up.
BULLISH TARGET
3370 - DONE
EMA5 CROSS AND LOCK ABOVE 3370 WILL OPEN THE FOLLOWING BULLISH TARGETS
3392 - DONE
EMA5 CROSS AND LOCK ABOVE 3392 WILL OPEN THE FOLLOWING BULLISH TARGET
3416
We will now come back Sunday with a full multi timeframe analysis to prepare for next week’s setups, including updated views on the higher timeframes, EMA alignments, and structure expectations going forward.
Thanks again for all your likes, comments, and follows.
Wishing you all a fantastic weekend!!
Mr Gold
GoldViewFX

XAUUSD Gold Intraday Setup 8 Aug 2025Price is currently respecting the ascending trendline and a nearby demand zone around 3385. If price holds above this level, a potential long setup may develop.
Entry: Around 3385 (upon confirmation of support holding)
Stop Loss: Below 3375 (invalidate if this low breaks)
Target: Previous swing high near 3409
The setup aligns with the ongoing bullish structure. Monitor price action near the trendline for confirmation before entering.

Gold is currently rising graduallyUp to now, the 1 long and 1 short position has earned a total profit of 400pips. First, I clearly positioned myself in the 3400 area for a short position. As expected, gold fell back under pressure, hitting a low near 3391. However, the decline lacked continuity, and after rebounding, it hit a stop-loss at 3395, exiting the position with a small profit-taking stop. I managed my risk and exited the position with a small profit-taking stop, earning 50 pips on each trade. I then re-introduced the long position strategy in the 3385-3380 area. As expected, gold fell to the target area and rebounded strongly, smoothly rising to the 3400 target. Both trades yielded a profit of 350 pips, a perfect execution of my plan. At a certain level in trading, technology is merely a tool; the true determinants of success or failure are mindset and execution. In this market where most people are destined to lose money, a reliable trading system is essential, but even more crucial is absolute execution. Ultimately, we trade not price, but conviction. We trade 2-5 trades daily, with a high win rate and high execution. We provide transparent profit reports daily. We maintain a steady pace and avoid blindly chasing orders. We share our strategies only occasionally, so please monitor the bottom of the market for specific entry tips and analysis of trading strategies. Choice is more important than effort. Only by identifying the direction can you make continuous profits.
In the short term, gold prices continued their upward trend in the previous trading day, relying on the support levels of 3370-3375. Gold prices finally broke through the 3400 mark, closing with a medium-sized bullish candlestick on the daily chart. Today's gold trend saw a rapid rise followed by a decline. This is particularly important to note: a surge often signals negative trends, a market principle we have repeatedly emphasized. Even if such a surge and decline doesn't directly trigger a decline, it will limit subsequent price gains. Therefore, it's not advisable to rush into the market. Even if considering a long position, wait for a sufficient correction before making a decision. The key support area below is 3385-3370, with 3370 being the intraday dividing line between long and short positions. If the upward trend continues, the correction should not fall below the previous low support level of 3370. If this support level is effectively broken, the upward trend structure will be disrupted, and a timely adjustment of the position is necessary.
The current market is still experiencing a large-scale, cyclical, and volatile pattern, rather than a completely unilateral trend. The reason for maintaining a long position this week is that after stabilizing at the 3268 support level, the market entered a period of relatively strong volatility. The mid-term bullish trend following the release of the non-farm payroll data failed to develop into a long-term bullish breakout. The upward trend was accompanied by periodic pullbacks, indicating an overall upward trend rather than a strong, one-sided market. Therefore, we maintain a bullish outlook, but we must not be blindly optimistic in our operations!
Gold Trading Strategy: We recommend buying gold in batches around 3385-3370, with a target of 3400-3410.

Gold Trading Strategy August 8XAUUSD – Bullish Breakout from Triangle Pattern
Gold has officially broken the upper boundary of the triangle accumulation pattern, confirming the continuation of the uptrend. This bullish momentum is heading directly towards the 3430 area, and if the buying pressure is maintained, the 3445 level is completely within reach.
Today is Friday, the closing day of the weekly candle, so the oscillation amplitude is usually stronger and the price can easily approach new peaks. Observation shows that the buying pressure in the US session has been maintained continuously in recent days - this supports the strategy of BUYing now and holding until the US market opens.
Support zone: 3385 – 3365 – 3333
Resistance zone: 3419 – 3431 – 3445
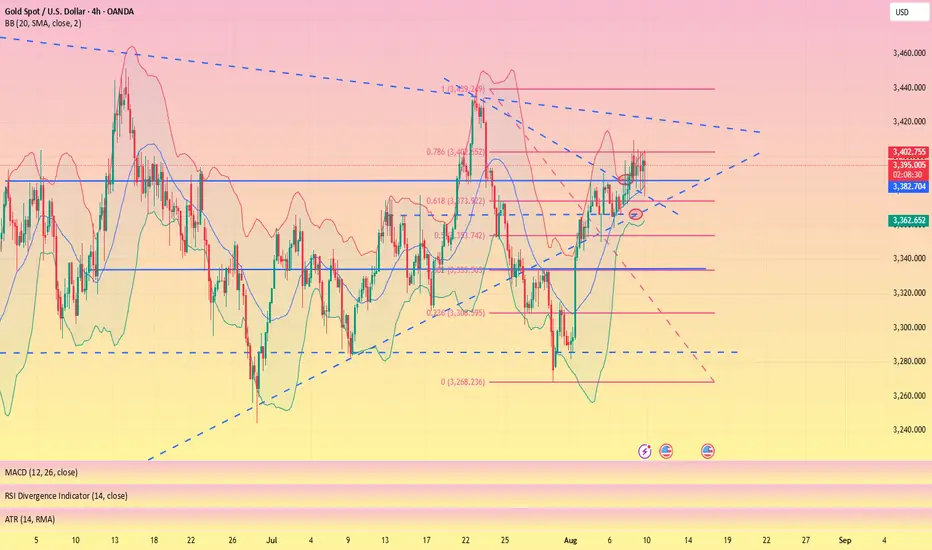
Gold once again fell into range consolidation, how to operate inToday, Friday, gold finally closed above 3380 after Thursday's close. It initially surged to a high near 3408 on Friday's opening.
Gold is currently consolidating above 3380.
Over the past two days, gold has largely fluctuated between 3360 and 3360. After closing above 3380 yesterday, the current range has shifted to 3380-3400.
The hourly chart also shows the current range between 3380 and 3400.
Of course, 3380 is currently a significant support level.
If it falls below 3380 again, the range could fall back to 3380-60.
On the other hand, the current resistance above is around 3400 points.
If it stabilizes above 3400 (based on today's high, a new high would essentially indicate stability), the subsequent range would become 3400-3450.
This means that after stabilizing at 3400, there's a possibility of continued higher highs.
Of course, gold is currently trading between 3380 and 3400, depending on where it breaks in the US market.
Whichever way the breakout occurs, follow the trend.
Another possibility is that it could continue to consolidate between 3389 and 3400.
If this is the case, then you can simply buy low and sell high within the range.
Gold next move (Read Description). Hello, Traders.
As you see gold has changed its direction after the NFP News. It was in down trend after the NFP News its flying to the my moon.
Gold is just flying and making breakouts of resistance areas. In my view gold wants to fly and it wants to hit buy side liquidity and then we can see the waterfall.
Gold can continue the trend and if price pullbacks it can touch the area 3365 - 3353 and then can fly.
Don’t trade against the trend, analyse the market before opening the trades.

How to correctly plan gold trading opportunitiesExpectations for Federal Reserve policy remain dovish, providing bullish support for gold prices. Weak US non-farm payroll data for July, coupled with a second consecutive week of rising jobless claims, suggests a weakening labor market. According to data released by the US Department of Labor, initial jobless claims rose to 226,000 in the week ending August 2nd, the highest level since early July, reflecting a significant slowdown in employment momentum.
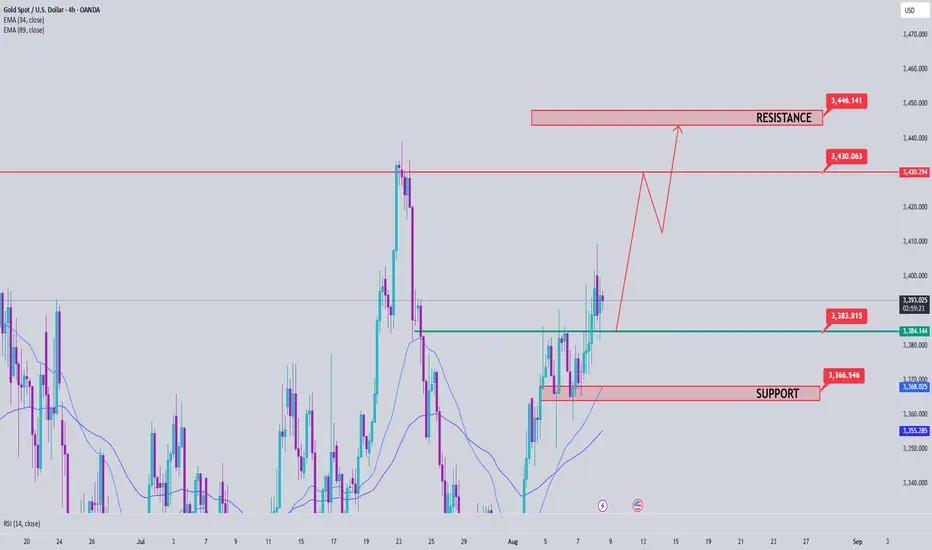
Technically, gold continued its upward trend, reaching an intraday high of 3409 before quickly retreating to around 3380, mirroring yesterday's trend. The market remains volatile, with the 3410-3420 range as the key resistance level. Avoid blindly chasing higher prices in the short term. Support is currently in the 3380-3365 range, with a potential dip buy opportunity if it stabilizes.

GOLD - Cut n Reverse Area? Holds or not??#GOLD... market perfect moved as per our analysis and now m
It's just reached at his current ultimate area that is 3404
Keep close with and holding of that area means drop...
NOTE: we will cut n reverse above althat area on confirmation.
Good luck
Trade wisely
Risk aversion is intensifying. Is gold poised for a breakout?Gold prices fell slightly in Asian trading on Friday, retreating from a two-week high of $3,409 hit the previous day as most investors chose to take some profits before the weekend.
Nevertheless, trade-related uncertainties continue to support gold. US President Trump announced this week that he would impose additional tariffs on Indian imports as a "punishment" for its purchase of Russian oil, raising the total tariff to 50%. He also plans to impose additional tariffs on semiconductors and pharmaceutical products next week.
In addition, the Federal Reserve’s policy expectations are also positive for gold prices. US non-farm payroll data for July was weak, with unemployment claims rising for the second consecutive week, signaling a weakening labor market. Data from the US Department of Labor showed that initial jobless claims rose to 226,000 in the week ending August 2, the highest level since early July.
Technically, gold prices encountered resistance near the upper limit of the daily rising channel and retreated after testing $3,410. Previously, the price of gold effectively broke through the resistance area of $3,380, showing that bulls still have momentum.
The momentum indicators in the daily chart: MACD and RSI remain upward, but the short-term rise has slowed down, indicating that the market has entered a consolidation phase.
If the gold price can regain its footing above $3,409, it is expected to test the $3,420 resistance area, and further targets will point to the historical highs of $3,434 or even $3,500.

XAUUSD GOLD BUYS Gold hit all take profits and now will be taking more trades into the correct direction for the rest of the trend , keep the trading simple and straightforward
