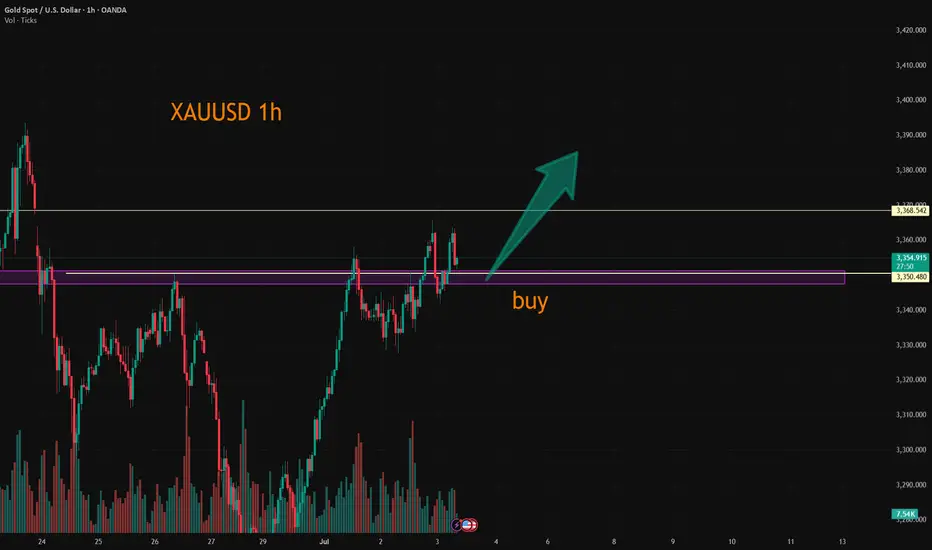
XAUUSD:A long trading strategy
The highest gold price in the Asian session reached 3365.4, which is already our mid-line target range. If you have completed and left the market, congratulations, because I personally set the TP point of 3368, so it did not touch, the trend of the past two days is appropriate rewithdrawal after strengthening, the high is also gradually rising, the overall long trend has not changed. For today's data, the probability will make gold prices continue to rise, trading ideas or to do the main.
Trading Strategy:
BUY@3347-51
TP:3365-70
This TP range is also the target range of the median trader, for friends who do not have automatic stop profit, you can take a profit manually at that time.
More detailed strategies and trading will be notified here ↗↗↗
Keep updated, come to "get" ↗↗↗
Goldprediction
Gold Breakout Retest – Will PRZ Trigger the Next Rally?Gold ( OANDA:XAUUSD ) attacked the Resistance lines and Resistance zone($3,350-$3,326) as I expected in yesterday's idea .
Gold seems to have broken the Resistance zone($3,350-$3,326) and Resistance lines and is pulling back to this zone.
In terms of Elliott Wave theory , Gold appears to have completed wave 3 and is currently completing wave 4 .
I expect Gold to have a chance to rise back to the Resistance zone($3,394-$3,366) after entering the Potential Reversal Zone(PRZ) .
Note: Stop Loss (SL) = $3,297=Worst SL
Gold Analyze (XAUUSD), 1-hour time frame.
Be sure to follow the updated ideas.
Do not forget to put a Stop loss for your positions (For every position you want to open).
Please follow your strategy; this is just my idea, and I will gladly see your ideas in this post.
Please do not forget the ✅ ' like ' ✅ button 🙏😊 & Share it with your friends; thanks, and Trade safe.

XAUUSD:Today's Trading Strategy
Gold retreated in the sub-session, I have personally increased my long position near 3331, the overall trend is bullish unchanged, the median strategy is patient to rise. If you are trading short, you can go long at 3325-3330 and leave at 3340-45. The same can be said if you want to solve the problem; Trade according to your trading preferences and risk tolerance.
More detailed strategies and trading will be notified here ↗↗↗
Keep updated, come to "get" ↗↗↗

Gold trend analysis and layout before NFP data📰 News information:
1. Initial jobless claims and NFP data
2. The final decision of the Federal Reserve
📈 Technical Analysis:
Due to the Independence Day holiday this week, the NFP data was released ahead of schedule today, while the policy differences within the Federal Reserve have brought uncertainty to the market. Judging from the market trend, the 4H level shows that the gold price tested the upper track yesterday and then turned to high-level fluctuations after coming under pressure. In the short term, the structure still has bullish momentum after completing the accumulation of power. Although there was a correction in the US market yesterday, it stopped falling and rebounded near 3335, further confirming the strength. At present, the upper resistance in the European session is at 3365-3375, and the short-term support is at 3345-3335 below. Intraday trading still requires good SL to withstand market fluctuations. In terms of trading, it is recommended to mainly go long on callbacks
🎯 Trading Points:
SELL 3365-3375
TP 3350-3340-3335
BUY 3335-3330-3325
TP 3350-3360-3375
In addition to investment, life also includes poetry, distant places, and Allen. Facing the market is actually facing yourself, correcting your shortcomings, confronting your mistakes, and strictly disciplining yourself. I hope my analysis can help you🌐.
FXOPEN:XAUUSD PEPPERSTONE:XAUUSD FOREXCOM:XAUUSD FX:XAUUSD OANDA:XAUUSD TVC:GOLD

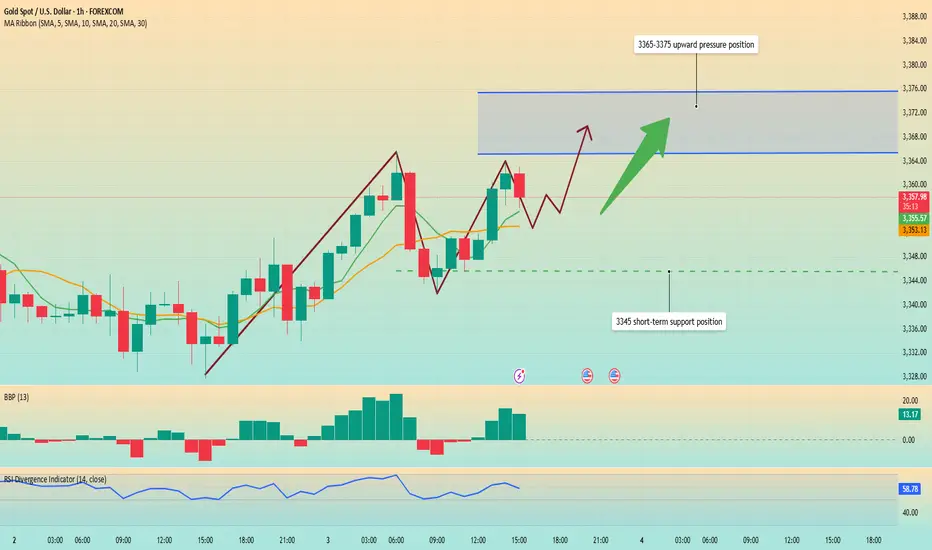
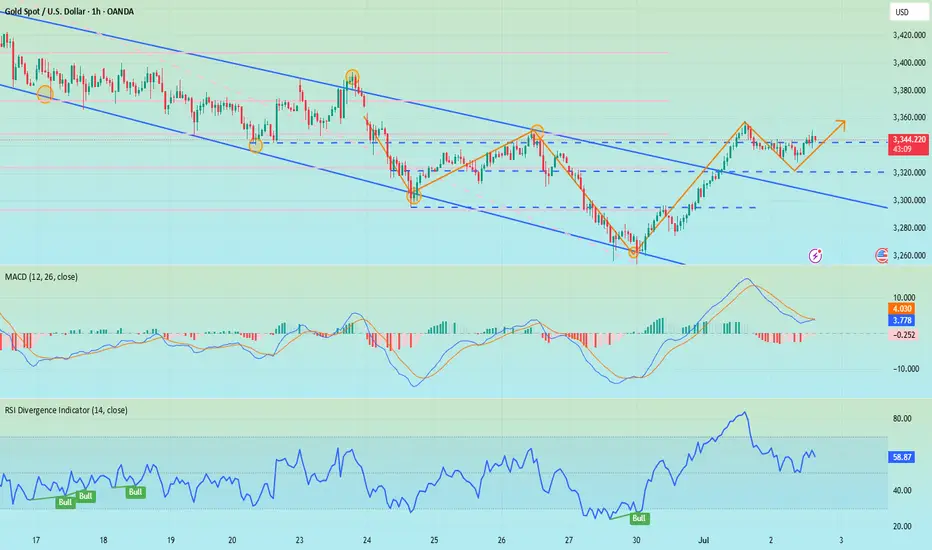
Data is about to be released. Trend change?Affected by the ADP employment data, gold prices broke through 3345 and continued to fluctuate upward to 3365 US dollars. This trend fully shows that the position of 3345 US dollars is the watershed between long and short.
From the 1-hour chart, the overall market is still fluctuating upward. Although it has fallen slightly, I think it is accumulating momentum for a second rise. ADP employment data is negative for the first time. Non-agricultural employment data will be released in 3 hours. The market expects 110,000 jobs. I think the data that may be released will be worse. The number of jobs will decrease and the unemployment rate will also increase, which will drive gold prices to continue to rise.
From a technical perspective, the RSI indicator is currently hovering around 58.7, showing strong upward momentum. MA5-day and 10-day moving averages form a golden cross and continue to rise. The current upward high has not appeared. The gold price may refresh the intraday high of 3365 again.
At present, the upward pressure focuses on 3365-3375 US dollars. The support level is around 3345, which is also the turning point for the upward movement of the MA5 daily moving average.
Operation strategy:
Buy near 3350, stop loss at 3340, and profit range 3370-3375.
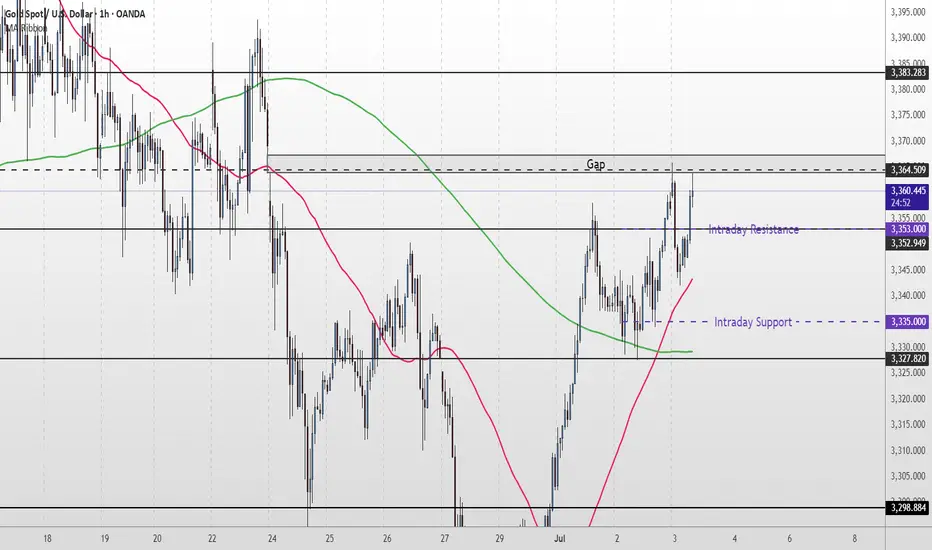
Gold Short Term OutlookYesterday, we highlighted that gold had reclaimed the 200MA and that the $3,327 support level needed to hold for further upside. Since then, price has steadily climbed and is now testing the $3,364 resistance — a level that also aligns with an unfilled gap.
Price action remains bullish for now, with price holding firmly above both the 50MA and 200MA.
If buyers manage to clear and hold above $3,364, we could see further upside toward $3,383 and $3,400, with possible extension into $3,418.
However, if price fails to break above $3,364, we may see a pullback into the $3,335–$3,327 zone. A break below there could open the door for a deeper drop into $3,298 or even $3,270.
📌 Key Levels to Watch:
Resistance:
$3,364 • $3,383 • $3,400 • $3,418
Support:
$3,352 •$3,335 - $3,327 • $3,298 • $3,270
🧠 Fundamental Focus:
📌 ADP Non-Farm Employment Change
📌 Initial Jobless Claims
📌 ISM Services PMI
📌 ISM Non-Manufacturing PMI
⚠️ With multiple red folder events on the calendar, expect elevated intraday volatility. Manage risk accordingly.
GOLD H2 Intraday Chart Update For 3 July 2025Hello Traders,
Main event of is day NFP and all eyes on 3400 Psychological for now, right now market sustains around 3350 Psychological level for downward move GOLD still need to break 3324 level in order to go further down above 3324 LEVEL GOLD is still remains Bullish
Remember: It's NFP day
Disclaimer: Forex is Risky
GOLD LOND TRADE IDEA We Are Looking Gold Bullish Today ,
TL BUY AREA : 3347 💡
1ST SUPPORT BUY : 3336, 3333 💡
2ND SUPPORT BUY: 3329, 3325 💡
If Gold Break The Trendline Then We See Gold Bearish Price Then We Buy At Support The Target Will Be ATH Liquidity 3390
If Gold Breaks Also 2nd Support Then Continue Bearish Trend Then We Trade Sell On a2nd Support Break
Manage Trades Properly Dont Forget To Follow Us For More Free Trades

Non-farm data is coming. Upward breakthrough?Information summary:
ADP data supports the rise of gold. Secondly, the weaker-than-expected non-farm data has triggered people's hope that the Federal Reserve will cut interest rates earlier. The gold price hit the 3360 mark, then fell back slightly, and is currently fluctuating around 3350.
This Friday is the Independence Day holiday in the United States. The non-farm data will be released on Thursday. Today, we will focus on this data, which will trigger a new trend.
Market analysis:
From the 4-hour chart, gold is currently in a suppressed state. However, it is not ruled out that it will be supported at the bottom as before, and then break through the upper suppression position again with the help of non-farm data.
Therefore, the most critical position today is not above, but near the support of 3325 below. On Wednesday, the support near 3325 was tested many times but did not break down. If the price remains above this position today, the probability of an upward breakthrough is very high.
Based on the current market conditions and the data to be released soon, Quaid recommends that everyone wait and see for a while and wait for the new trend to come. Of course, according to the current forecast data, this will support the rise of gold. A radical approach can also try a long strategy around 3345.

GOLD - it's breakout? What's next??#GOLD... perfect move as per our last analysis and now market just broke his current resistance area that was 3348-49 and 3353-54
So keep close and if market hold these areas then upside further bounce expected.
Good luck
Trade wisely

ADP data has been released, how to position gold in the future📰 News information:
1. ADP data, for reference of tomorrow's NFP data
2. Interest rate cuts and Powell's dovish comments
3. Geopolitical impact on the gold market
📈 Technical Analysis:
The ADP data was significantly bullish after it was released, but gold did not rise sharply in the short term. Instead, it touched the resistance of 3350 that we gave and then fell back. I also saw a lot of fake traders in the market who immediately told their brothers to go long and look towards 3380 after the ADP data was released. To be honest, I think these people are typical hindsight experts. If everyone is like this, then anyone can be called a trader, right?
Back to the topic, I still hold short orders at 3340-3350. In the short term, gold will fluctuate and be bearish to seek restorative support, so the best place to go long is to look at the retracement below, which will at least touch 3333-3323. If it falls below this support, it will go to 3315-3305. On the contrary, if it gets effective support at 3333-3323, then gold will rebound as expected to form a head and shoulders bottom.
🎯 Trading Points:
SELL 3340-3350-3355
TP 3333-3323-3315-3295
BUY 3335-3325
TP 3345-3355-3375
In addition to investment, life also includes poetry, distant places, and Allen. Facing the market is actually facing yourself, correcting your shortcomings, confronting your mistakes, and strictly disciplining yourself. I hope my analysis can help you🌐.
FXOPEN:XAUUSD PEPPERSTONE:XAUUSD FOREXCOM:XAUUSD FX:XAUUSD OANDA:XAUUSD TVC:GOLD
#XAUUSD: +2000 Swing Sell In Making! Get ReadyGold has dropped to the 3330 region but has now reversed and is currently trading at 3350. The next potential move could be at 3380, followed by 3400. Our sell entry is at 3400, where we believe the price will reverse. Our long-term view is that gold will head towards 3100, but our first target will be 3200. Please use accurate risk management when trading gold, as it can cause serious financial issues if not planned properly. This analysis does not guarantee any price movement.
Good luck and trade safely!
Team Setupsfx!

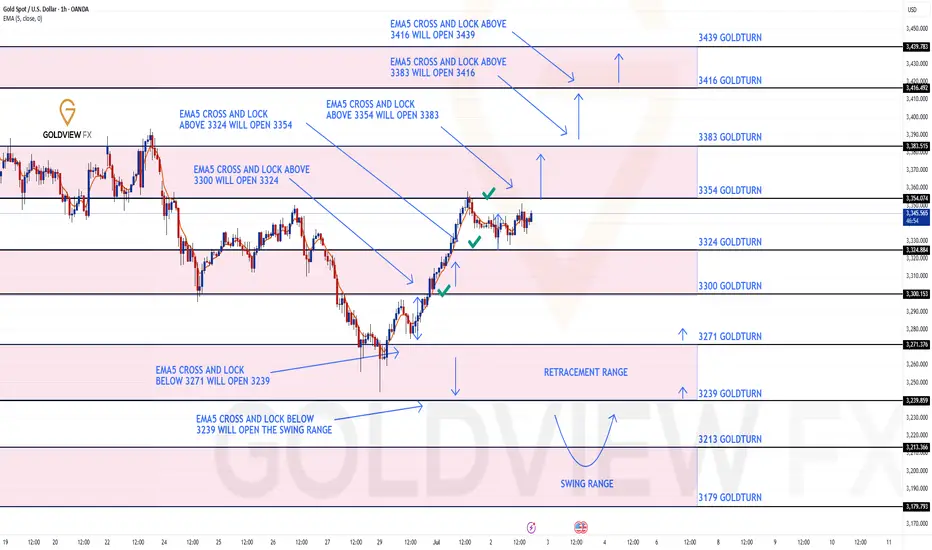
GOLD ROUTE MAP UPDATEHey Everyone,
Once again our chart idea and levels are being respected and playing out to perfection, allowing us to confirm continuations and rejections.
After completing our targets, 3324 and 3354 yesterday, we had no further cross and lock above 3354, confirming the rejection.
We are now seeing price play and consolidate between 3324 and 3354 and will need ema5 cross and lock on either level to confirm our next direction.
We will keep the above in mind when taking buys from dips. Our updated levels and weighted levels will allow us to track the movement down and then catch bounces up.
We will continue to buy dips using our support levels taking 20 to 40 pips. As stated before each of our level structures give 20 to 40 pip bounces, which is enough for a nice entry and exit. If you back test the levels we shared every week for the past 24 months, you can see how effectively they were used to trade with or against short/mid term swings and trends.
The swing range give bigger bounces then our weighted levels that's the difference between weighted levels and swing ranges.
BULLISH TARGET
3300 - DONE
EMA5 CROSS AND LOCK ABOVE 3300 WILL OPEN THE FOLLOWING BULLISH TARGETS
3324 - DONE
EMA5 CROSS AND LOCK ABOVE 3324 WILL OPEN THE FOLLOWING BULLISH TARGET
3354 - DONE
EMA5 CROSS AND LOCK ABOVE 3354 WILL OPEN THE FOLLOWING BULLISH TARGET
3383
BEARISH TARGETS
3271
EMA5 CROSS AND LOCK BELOW 3354 WILL OPEN THE FOLLOWING BEARISH TARGET
3239
EMA5 CROSS AND LOCK BELOW 3239 WILL OPEN THE SWING RANGE
3213
3179
As always, we will keep you all updated with regular updates throughout the week and how we manage the active ideas and setups. Thank you all for your likes, comments and follows, we really appreciate it!
Mr Gold
GoldViewFX
Gold Trading Strategy February 7✏️As expected from the analysis, after the D1 candle showed buying pressure again, the price continued its uptrend yesterday and reached 3357.
Currently, the price is consolidating within a relatively wide sideways range, extending from 3328 to 3344.
A trend-following trading strategy will be set up when the price breaks out of this range.
The BUY signal is expected to bring good profits if the price retests the support.
The SELL signal at resistance is considered to look for rebound points in an uptrend.
📈 Key Levels
Breakout Range: 3344-3328
Support: 3310-3298
Resistance: 3368-3386
📊 Recommended Trade Setups
BUY: 3310-3308 | SL: 3305
SELL: 3368-3370 | SL: 3373

Gold price analysis July 2As expected, after the D1 candle showed the return of buying power, yesterday's trading session saw the price continue its upward trend and reach 3357.
Currently, the market is in an accumulation phase with a fairly wide range, fluctuating from 3328 to 3344. This is an important price zone, acting as a "sideway box" waiting for a breakout.
The priority strategy at this time is still trend trading - activated when the price breaks out of the above accumulation zone.
BUY orders will have a high probability of success if the price adjusts and retests the Support or Resistance zones that have just been broken, then forms a confirmation signal.
Meanwhile, SELL orders around resistance should only be considered a recovery strategy in an uptrend - requiring strict risk management and short-term profit expectations.
Breakout Range: 3328 – 3344
Support: 3310 – 3298
Resistance: 3368 – 3386

As expected, it will fall and form a head and shoulders bottom📰 News information:
1. ADP data, for reference of tomorrow's NFP data
2. Interest rate cuts and Powell's dovish comments
3. Geopolitical impact on the gold market
📈 Technical Analysis:
Yesterday we expected gold to retreat to the 3330-3320 area. Today, gold hit a low of around 3328 during the Asian session, which is in line with our judgment of the market trend. In the short term, gold may still fall. First, it may test the 3323 support line. If it falls back to this position during the day, you can try to go long. In the short term, focus on the 3315-3305 long-short dividing line below. If gold gets effective support below, it is expected to form a head and shoulders bottom pattern. The short-term decline will accumulate momentum for the future rise. Pay attention to the ADP data during the NY period
🎯 Trading Points:
BUY 3323-3315-3305
TP 3340-3350-3360-3375
In addition to investment, life also includes poetry, distant places, and Allen. Facing the market is actually facing yourself, correcting your shortcomings, confronting your mistakes, and strictly disciplining yourself. I hope my analysis can help you🌐.
FXOPEN:XAUUSD PEPPERSTONE:XAUUSD FOREXCOM:XAUUSD FX:XAUUSD OANDA:XAUUSD TVC:GOLD

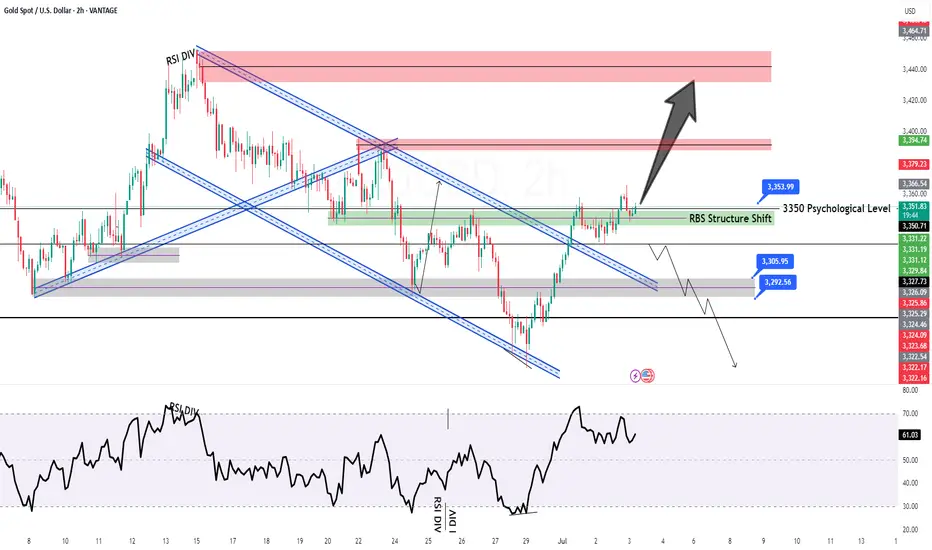
GOLD/USD Bullish Reversal and Breakout Target GOLD/USD Bullish Reversal and Breakout Target 🎯 ✨📈
🔍 Technical Analysis Overview:
The chart illustrates a clear bullish reversal pattern following a strong downtrend, with price reacting from a key support zone (highlighted in blue).
Multiple bullish rejection wicks and confirmation candles (green arrows) indicate buying interest at this support.
The recent higher low formation confirms shift in market structure towards bullish bias.
📌 Key Zones:
🟦 Support Zone: Around 3,280 – 3,320 USD
Price respected this zone multiple times (marked with orange circles), confirming its strength.
🟥 Resistance Zone / Target: 3,430 – 3,460 USD
This area aligns with previous swing highs and is the projected target for this bullish move.
📈 Chart Structure:
Break of descending trendline and bullish momentum above support suggests potential continuation towards the marked target.
Falling wedge breakout also aligns with reversal logic.
🎯 Price Target:
3,438.515 USD (resistance area), as labeled on chart with arrow and breakout projection.
🛑 Invalidation Level:
A sustained break below the support zone (3,280 USD) would invalidate this bullish outlook.
📌 Conclusion:
Gold is exhibiting strong bullish behavior with confirmation from price action and structure break. As long as price sustains above support, the path toward 3,438 remains

How do we plan before ADP and NFP?📰 News information:
1. ADP data, for reference of tomorrow's NFP data
2. Interest rate cuts and Powell's dovish comments
3. Geopolitical impact on the gold market
📈 Technical Analysis:
The market will continue to fluctuate before the ADP data, and the market will continue to rise after the adjustment. In the 4H cycle, the upper rail of the pressure is temporarily suspended, and the Bollinger Bands also close. This is why I emphasize the need to pay attention to the 3323 support line below. At present, gold rebounded, I think it will touch 3348 at most, that is, it rebounded to 50%. Therefore, before the ADP data, I still hold the position of 3340-3350 for shorting, and find support for long at 3325-3315 below. I have marked the pattern of head and shoulders bottom in the figure. I have been engaged in spot, futures, foreign exchange and other transactions for many years. My analysis ideas can be referred to by brothers
🎯 Trading Points:
SELL 3340-3350
TP 3330-3325-3315-3295
BUY 3323-3315-3305
TP 3340-3350-3360-3375
In addition to investment, life also includes poetry, distant places, and Allen. Facing the market is actually facing yourself, correcting your shortcomings, confronting your mistakes, and strictly disciplining yourself. I hope my analysis can help you🌐.
TVC:GOLD OANDA:XAUUSD FX:XAUUSD FOREXCOM:XAUUSD PEPPERSTONE:XAUUSD FXOPEN:XAUUSD

GOLD - Range bound, Need to stay calm??#GOLD.. .be ready for a headache range bound move guys,
It will be very choppy so don't be panic and dont expect too much.
It will be messy.
Good luck
Trade wisely

Gold prices have risen sharply. How should we trade gold?
📣Gold news:
US Senate passes Trump tax reform bill. Trump wins major victory
Trump's signature tax and spending cuts bill passed the Senate on Tuesday. Republican leaders finally convinced dissenting lawmakers after a hard fight, helping Trump win another political victory.
Trump refuses to extend July 9 tariff deadline
US President Trump reiterated on Tuesday that he has no intention of extending the 90-day suspension of reciprocal tariffs on most countries after it expires on July 9.
When asked whether he would extend the suspension of tariffs, Trump replied on Air Force One: "No, I haven't thought about it. I will write to many countries to notify them of the tariff rates they will face."
Gold (XAU/USD) struggled to extend its two-day rally, fluctuating narrowly in the Asian session on Wednesday, just below Tuesday's one-week high. The dollar's slight rebound - from its lowest level since February 2022 - put pressure on gold. Moreover, improving market sentiment continues to weaken demand for safe-haven assets such as gold, further limiting its upside.
⭐️Technical Analysis:
Trend lines are steadily picking up, and continued buying could move towards 3383 based on today's ADP-NF data
💰Set Gold Price:
💰Sell Gold Zone: 3375-3385 SL 3395
TP1: $3370
TP2: $3360
TP3: $3350
💰Buy Gold Zone: $3315-$3310 SL $3305
TP1: $3320
TP2: $3330
TP3: $3340
⭐️Technical Analysis:
Set reasonable buy orders based on technical indicators EMA 34, EMA89 and support resistance areas.
Gold Price Analysis – Bullish Momentum Holds Above FVGs🧠 Chart Breakdown:
Instrument: Gold Spot (XAU/USD)
Timeframe: 1H
Current Price: $3,340
Trend: Short-term uptrend intact
🔑 Key Observations:
Ch.o.Ch Confirmed (Change of Character):
The break above the previous structure high confirmed a bullish market structure shift.
Fair Value Gaps (FVG):
Multiple FVGs exist between $3,320 – $3,335, acting as potential demand zones and support levels.
Fibonacci Retracement:
Price is respecting the 0.382–0.5 levels ($3,336 – $3,330) well so far.
Below this, the 0.618 level at $3,325 is the next strong confluence zone.
Trendline Support:
The price is testing a rising trendline, adding dynamic support around the current level.
Ichimoku Cloud:
Price is above the cloud, which supports the bullish bias.
Conversion line (blue) and base line (red) are bullishly aligned.
📉 Possible Next Moves:
✅ Bullish Scenario:
Price bounces from current levels or slightly lower ($3,336–$3,330) and retests the recent high (~$3,355).
Breakout above $3,355 could open the door to $3,370+.
⚠️ Bearish Scenario:
If price breaks below $3,330 and the trendline, expect deeper pullbacks to:
$3,325 (0.618 Fib)
Then possibly $3,308 FVG support or $3,258 major demand zone.
📌 Conclusion:
Gold is still respecting bullish market structure with healthy pullbacks into support zones. As long as the price stays above $3,325, the bullish outlook remains valid. Watch for bullish reaction near the FVGs or a break above $3,355 to confirm upside continuation.

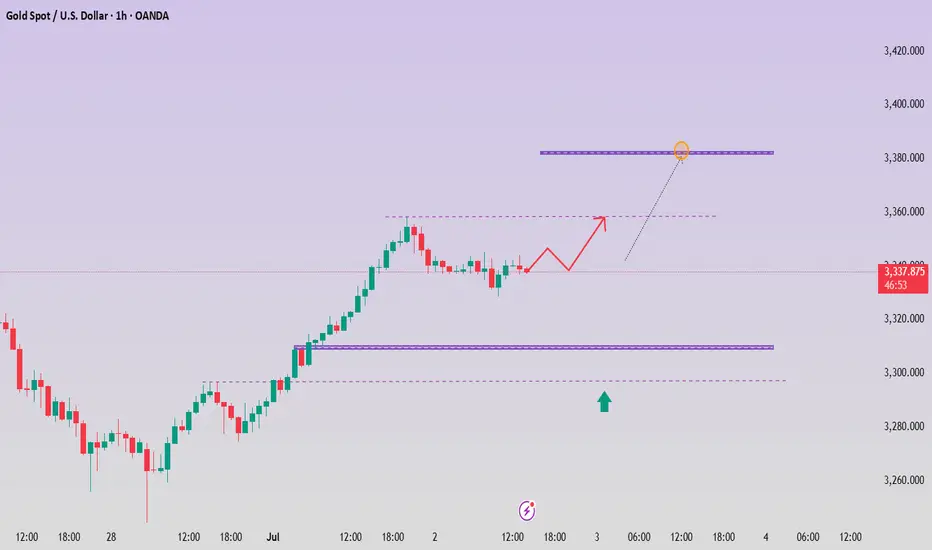
XAUUSD Free Signal: Bullish Breakout!!!Hello everyone.
I’m sharing a trade setup for GOLD.
Gold has shown strong bullish momentum this week. Picture is simple, The setup is straightforward: I’m following the gold uptrend, targeting last week’s high.
Type: Buy (Long)
Entry: $3,343 (after price breaks resistance at $3,340)
Stop Loss (SL): $3,328 (below the recent swing high)
Take Profit (TP): $3,393 (targeting last week’s high)
Risk-Reward Ratio: 1:3.3 (risking $15 to gain $50)
This trade offers a high reward, low risk (1:3 risk-reward ratio). Gold shows buyers dominating and sellers weakening. Additionally, the US dollar index (DXY) is in a strong bearish trend. On higher timeframes (1W, 1D), gold’s recent move appears to be a slow correction, supporting my long position.
What do you think of this gold setup? Share your thoughts in the comments! Follow for more free signals, and like if you’re taking this trade!
Disclaimer: This is not financial advice. Trading involves risks. Always do your own research and manage your risk carefully.

Gold(XAU/USDT) Analysis - Targeting 4H Liquidity VoidOANDA:XAUUSD
**Gold (XAUUSD) Trade Idea 🚀**
**🔍 Setup:**
- Price bounced from **Daily FVG (red)** & is now in **4H FVG (green)** ✅
- Targeting **4H liquidity void at 3400** 🎯
**⚡ Key Levels:**
- **Support:** 3338 / 3320
- **Resistance:** 3360 / 3380 / **3400 (main target)**
**🎯 Plan:**
- **Entry:** Hold above 3341 or pullback to 4H FVG
- **Stop:** Below 3320
- **Target:** 3400
*(Chart attached 👆)*
Liquidity Void: Its an imbalance which has high probability of getting filled
