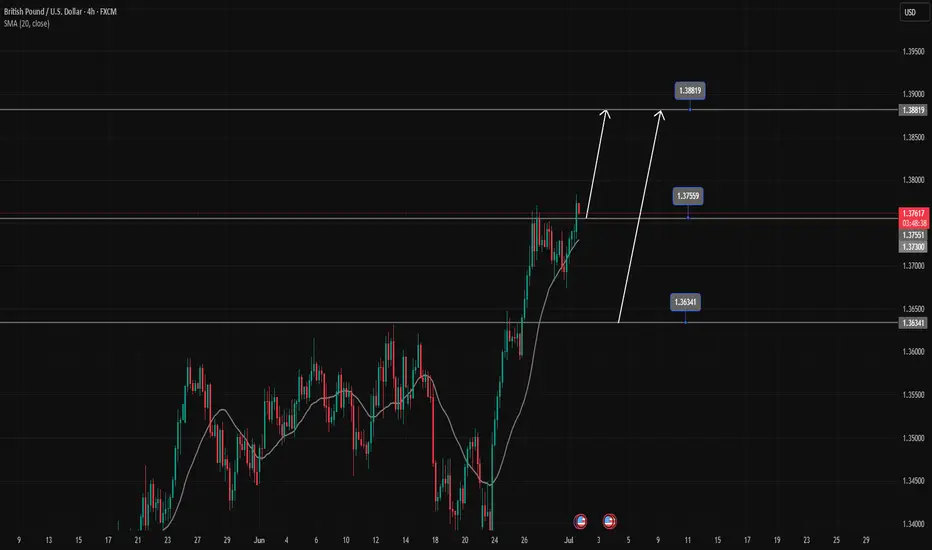
GBPUSD's strong uptrend continuesGBPUSD is in a strong uptrend, Price has just broken the resistance zone of 1.37500.
All the bullish momentum is heading towards the resistance zone of 1.388.
If there is a close of the h4 candle below the resistance zone of 1.375, there will likely be a Pullback to 1.363 to find more buying momentum towards the target at the resistance zone of 1.388
📈 Key Levels
Support: 1.375-1.363
Resistance: 1.388
📊 Recommended Trade Setups
BUY GBPUSD 1.375-1.373 Stoploss 1.37000
BUY GBPUSD 1.363-1.361 Stoploss 1.35800
SELL GBPUSD 1.388-1.390 Stoploss 1.39300
Goldprediction
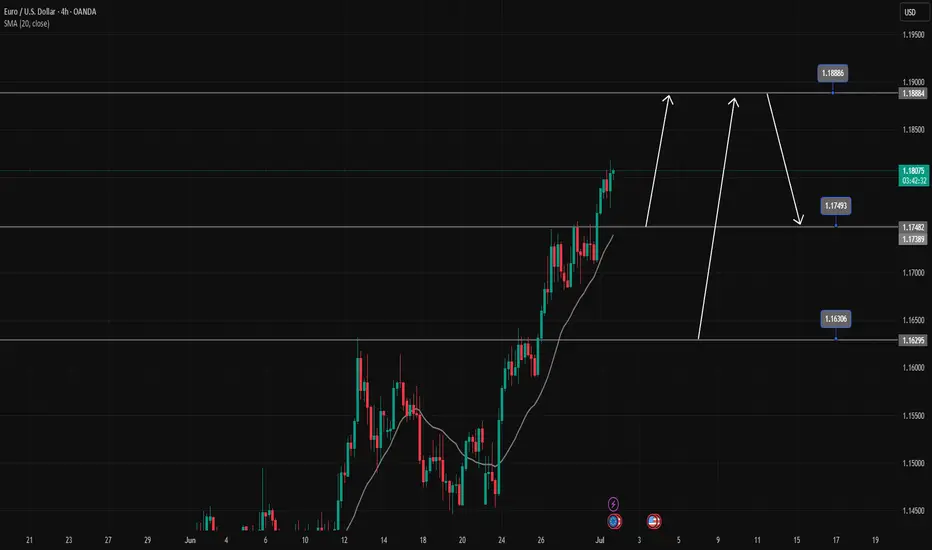
EURUSD is in a strong uptrendEURUSD is in a strong uptrend, Price just broke the resistance zone of 1.175.
All the bullish momentum is heading towards the resistance zone of 1.188.
If there is a close of the h4 candle below the resistance zone of 1.175, there will likely be a Pullback to 1.163 to find more buying momentum towards the target at the resistance zone of 1.188
📈 Key Levels
Support: 1.175-1.163
Resistance: 1.188
📊 Recommended Trade Setups
BUY EURUSD 1.175-1.173 Stoploss 1.170
BUY EURUSD 1.163-1.161 Stoploss 1.158
SELL EURUSD 1.188-1.190 Stoploss 1.1930
Gold Trading Strategy July 1✏️ D1 candle has a bullish recovery when closing above 50% of last Friday's decline.The bullish wave of Gold is forming, heading back to the GAP 3363 zone.Today's main strategy is to wait for BUY if there is a retest of 3300. Reaction sell strategy is focused on resistance zones with not too long expectations.
📈 Key Levels
Support 3300- 3379- 3360
Resistance 3334-3348-3363
📊 Recommended Trade Setups
BUY GOLD 3300-3298 Stoploss 3295
SELL GOLD 3348-3350 Stoploss 3353

GOLD H2 Intraday Chart Update For 2 July 2025Hello Traders,
Today all eyes on breakout of 3360-70 zone in order to GOLD go for further advance below this zone all eyes are remains on 3318 level if market successfully maintain 3330 level then will go down further towards 3300 Psychological Level after passing 3318
NFP main event of the day which is held by tomorrow
Disclaimer: Forex is Risky

GOLD - at CUT n REVERSE area? Holds or not??#GOLD ... Perfect holdings of our upside resistance area that was actually 3357
And now market just at his current ultimate supporting area, that is 3336-37
Keep close that area and if market thold it in that case we can expect again bounce otherwise not.
NOTE: we will go for cut n reverse below 3336-37
Good luck
Trade wisely

I hold on to my short position and wait patiently.Currently, gold continues to rebound to around 3358, and there has been no decent retracement during the rebound, so during the trading period, apart from chasing the rise, there are almost no opportunities to go long on gold; so is the steady rise in gold during the day brewing a bigger rally?
I think there are three reasons for the continued rise of gold:
1. The continued weakness of the US dollar provides support for the strong rise of gold;
2. The trapped long chips have recently shown self-rescue behavior, and strong buying funds have driven gold up;
3. The market intends to eliminate and kill a large number of shorts in recent times;
Based on the above reasons, I think it is not a wise decision to chase gold at present; on the contrary, I still prefer to short gold in the short term, and I still hold a short position now; the following are the reasons to support my insistence on shorting gold:
1. The US dollar has a technical rebound demand after a sharp drop, which will limit the rebound space of gold and suppress gold;
2. After the recent trapped long chips successfully rescue themselves, they may cash out in large quantities, thereby stimulating gold to fall again;
3. While killing the shorts, the market has also lured a large number of long funds to a certain extent. Based on the above reasons, I currently still hold short positions near 3345 and 3355, and hope that gold can retreat to the 3335-3325 area.

Gold retreats as expected, how to trade in the future📰 News information:
1. Geopolitical situation
2. PMI data
3. Global Central Bank Governors Meeting
📈 Technical Analysis:
Our short orders have achieved profits. I closed the position near 3337, turning losses into profits. Interested friends can follow my previous post. In the short term, I am still optimistic that gold will retreat below 3335-3325. Today, gold rose sharply, and the rebound momentum was strong, while the short-term correction was slightly weak, so the space for a second decline in the short term will be limited. If it falls to the 3333-3323 range during the day and gets effective support, you can consider going long. The short-term upper resistance is 3360-3375.
🎯 Trading Points:
BUY 3333-3323-3315
TP 3341-3355-3360-3375
In addition to investment, life also includes poetry, distant places, and Allen. Facing the market is actually facing yourself, correcting your shortcomings, confronting your mistakes, and strictly disciplining yourself. I hope my analysis can help you🌐.
TVC:GOLD OANDA:XAUUSD FX:XAUUSD FOREXCOM:XAUUSD PEPPERSTONE:XAUUSD FXOPEN:XAUUSD
Gold falls back, is a bottom structure emerging?In terms of one-hour structure, this round of phased adjustment started from 3450 has not ended yet, but it will soon, especially the rapid rebound after the bottom of 3260 on Monday. This rebound has strong momentum. After bottoming out and rebounding, it is currently fluctuating around 3340, with a large overall span. This also shows that after the price has risen, the amplitude of the correction has increased, which means that the upward space is limited. This adjustment is likely to be over soon, but there is no definite bottom structure yet, so we need to wait for some time.
Before going out of the definite bottom structure, based on the principle of following the trend, you can try to short with a light position. At present, in terms of the one-hour pattern, the key point is here at 3355, and it is currently falling back from this position to 3340. If it falls back to the 3320 area today and stabilizes above it, you can operate a long strategy. On the whole, Quaid suggests that the short-term operation strategy for gold today should be mainly long on pullbacks, supplemented by shorting on rebounds.
Operation strategy:
Short at 3345, stop loss at 3355, profit range 3330-3325.
Long at 3320, stop loss at 3310, profit range 3340-3345.

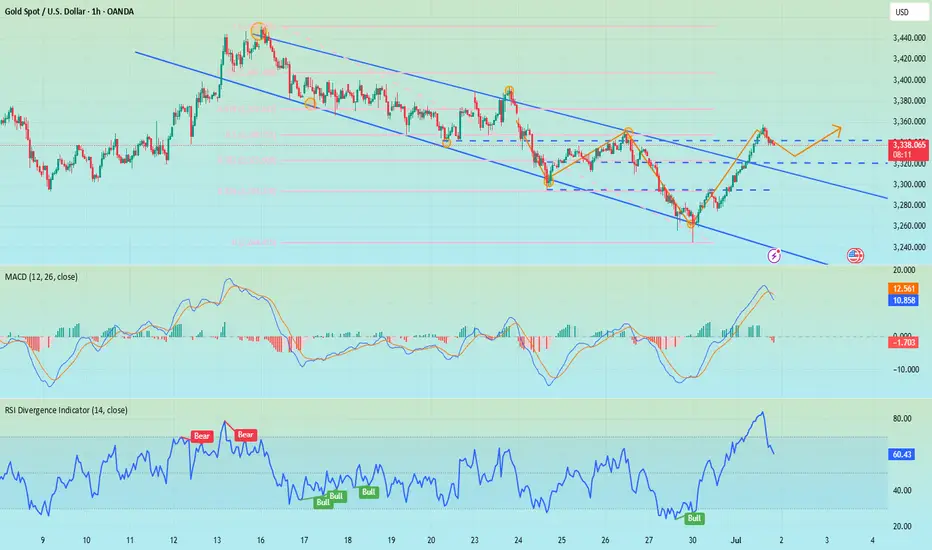
Gold Rebound Underway – Support Zone Holds Strong! - Short termGold( OANDA:XAUUSD ), as I anticipated in the previous idea , has attacked the Support zone($3,281-$3,243) and Support lines .
From an Elliott Wave theory perspective , it appears that Gold has completed 5 sub-waves of the main wave C .
Also, we can see the Regular Divergence(RD+) between Consecutive Valleys.
I expect Gold to rise to at least $3,307 in the coming hours.
Second Target: $3,321
Note: Stop Loss (SL) = $3,240
Gold Analyze (XAUUSD), 1-hour time frame.
Be sure to follow the updated ideas.
Do not forget to put a Stop loss for your positions (For every position you want to open).
Please follow your strategy; this is just my idea, and I will gladly see your ideas in this post.
Please do not forget the ✅ ' like ' ✅ button 🙏😊 & Share it with your friends; thanks, and Trade safe.

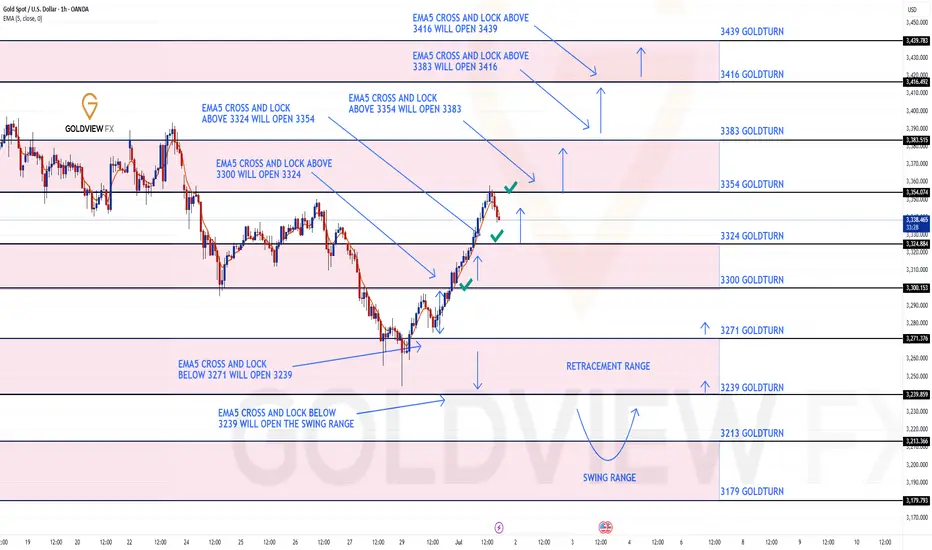
GOLD ROUTE MAP UPDATEHey Everyone,
Another PIPTASTIC day on the charts today with our analysis playing out to perfection!!!
After hitting 3300 target yesterday, we stated that we would now look for ema5 cross and lock above 3300 to open 3324. This was locked and loaded and we got the target hit at 3324. This followed with a further ema5 cross and lock above 3324 opening 3354, which was also hit perfectly completing this range.
We are now seeing a perfect rejection from this level and unless we get a ema5 cross and lock above this level for a continuation, we are likely to see the lower Goldturns tested for support and bounce.
We will keep the above in mind when taking buys from dips. Our updated levels and weighted levels will allow us to track the movement down and then catch bounces up.
We will continue to buy dips using our support levels taking 20 to 40 pips. As stated before each of our level structures give 20 to 40 pip bounces, which is enough for a nice entry and exit. If you back test the levels we shared every week for the past 24 months, you can see how effectively they were used to trade with or against short/mid term swings and trends.
The swing range give bigger bounces then our weighted levels that's the difference between weighted levels and swing ranges.
BULLISH TARGET
3300 - DONE
EMA5 CROSS AND LOCK ABOVE 3300 WILL OPEN THE FOLLOWING BULLISH TARGETS
3324 - DONE
EMA5 CROSS AND LOCK ABOVE 3324 WILL OPEN THE FOLLOWING BULLISH TARGET
3354 - DONE
EMA5 CROSS AND LOCK ABOVE 3354 WILL OPEN THE FOLLOWING BULLISH TARGET
3383
BEARISH TARGETS
3271
EMA5 CROSS AND LOCK BELOW 3354 WILL OPEN THE FOLLOWING BEARISH TARGET
3239
EMA5 CROSS AND LOCK BELOW 3239 WILL OPEN THE SWING RANGE
3213
3179
As always, we will keep you all updated with regular updates throughout the week and how we manage the active ideas and setups. Thank you all for your likes, comments and follows, we really appreciate it!
Mr Gold
GoldViewFX
Gold price rises by more than $100, will the bull run continue?📰 News information:
1. Geopolitical situation
2. PMI data
3. Global Central Bank Governors Meeting
📈 Technical Analysis:
The NY session is about to begin, and there are two things we need to pay attention to. First, the PMI data, and second, the talks between global central bank governors. If Powell again hints that the inflation outlook is weaker than expected, this will increase the Fed's easing bets and trigger a new round of decline in the US dollar. The dovish tone may help gold prices to further rebound. On the contrary, if Powell makes some hawkish or cautious remarks, this may exacerbate the recent downward trend in gold prices. The key point at present is the 3350 mark. If the 4H closing line of the NY session remains below 3350, then in the short term we are expected to continue to retreat to the 3330-3320 range. If the 4H closing line is above 3350 and stabilizes, gold may rebound to the 61.8% position, which is around 3372.
🎯 Trading Points:
SELL 3340-3350-3355
TP 3330-3325-3320
BUY 3330-3320
TP 3340-3350-3372
In addition to investment, life also includes poetry, distant places, and Allen. Facing the market is actually facing yourself, correcting your shortcomings, confronting your mistakes, and strictly disciplining yourself. I hope my analysis can help you🌐.
FX:XAUUSD FXOPEN:XAUUSD PEPPERSTONE:XAUUSD FOREXCOM:XAUUSD FX:XAUUSD OANDA:XAUUSD TVC:GOLD

Beware of gold, false rise and real fall
💡Message Strategy
The global economic uncertainty has intensified recently, and the gold market has performed well. On Monday, the price of gold rose by 0.87%, hitting a bottom of $3247.87 per ounce before rebounding strongly. The upward trend continued in early trading on Tuesday. In the second quarter, the price of gold rose by 5.5%, rising for two consecutive quarters.
The main reason for this round of gold price rise is the weakening of the US dollar. The US dollar index has recorded its worst performance in the first half of the year since the 1970s. Market concerns about the expansion of the US fiscal deficit and uncertainty in trade agreements have weakened the attractiveness of the US dollar.
At the same time, global trade and geopolitical fluctuations, such as the Sino-US rare earth agreement, the progress of US-EU trade negotiations, and the uncertainty of the tariff deadline on July 9, have strengthened the safe-haven properties of gold. This week's focus is on Thursday's US non-farm payrolls report for June. The market expects 110,000 new jobs and an unemployment rate of 4.3%, which will directly affect the direction of the Federal Reserve's monetary policy.
Although the Federal Reserve is cautious about cutting interest rates, the market generally expects that interest rate cuts will be resumed in September, and the annual interest rate cut may reach 66 basis points. Trump's pressure on the Federal Reserve has also increased policy uncertainty.
Gold is driven up by multiple factors, but its future trend still depends on employment, inflation and tariff policies. Investors need to pay close attention to data and policy developments.
📊Technical aspects
Gold hit bottom and rebounded during the early trading session on Monday, and the price stopped after touching the previous low. The price stopped after touching the four-hour resistance position before the European session. The European session was under pressure before breaking through the four-hour resistance. After that, the U.S. session had consecutive positive days, and the price did not fall. Instead, it further broke through the four-hour resistance position, which means that the price still has the performance of testing the daily level resistance area. We will continue to follow the key breakthrough of 3300 on Monday and pay attention to the 3350-3360 area and then look at the pressure.
According to the daily level, after the price broke through the daily support last week, the price continued to rely on the daily resistance to bear pressure. At present, the daily resistance is at the 3360 area resistance. Below this position, gold can continue to be short.
According to the four-hour level, the four-hour key position is the key to our emphasis on short-term trends. Yesterday, the price broke through the four-hour resistance and is expected to adjust further. The current four-hour support is in the 3300 area. The price is short-term bullish above this position. After the subsequent high, it is expected to fall further after breaking the four-hour support again.
From the one-hour level, yesterday's strong closing, today's early trading again directly broke through yesterday's high position, so today's early trading low became the key. The price above this position tends to continue to test the daily resistance of 3360, so we will first look at the rebound, and wait until the price touches the daily resistance of 3350-3360, and then pay attention to further anti-K signals to see pressure.
💰Strategy Package
Short Position:3350-3360,SL:3370,Target: 3315-3300

Gold surged and then fell. Has it reached its peak?Information summary:
Today, the United States and Japan negotiated on tariffs. Trump said that the US-Japan deal was unfair and might send a letter to Japan; the US-Japan trade negotiations seemed to be at a standstill. Trump also threatened that he would not extend the expiring tariff period and would send letters to most countries and regions in the next few days.
Secondly, the United States accused the EU of unfair digital legislation and asked the EU to relax its supervision of US technology giants. In addition, Trump accused "Mr. Too Late" Powell and the entire committee on social media that they should be ashamed of not cutting interest rates.
Affected by the above news, gold's risk aversion sentiment heated up and prices started to rise for the second time.
Market analysis:
From the 4-hour chart, the market is currently in a slow upward trend in a downward channel, and the price is also repeatedly testing the upward pressure position of 3355. MA5-day and 10-day moving averages turned upward and crossed with the 20-day and 30-day moving averages. At present, the upward momentum is slightly insufficient. In the short term, we should focus on the suppression position of 3355. If we fail to break through this position for a long time, the trend will most likely turn into a downward trend. If no black swan event occurs, today's price will most likely fluctuate around the 3320-3350 range. If there is no black swan event, the price today will most likely fluctuate around the range of 3320-3350.
Operation strategy:
Short near 3355, stop loss 3365, profit range 3340-3330.
Long near 3315 when the price falls back, stop loss 3305, profit range 3340-3345.

XAUUSD MONTHLY/WEEKLY ANALYSISWhat we’re seeing here on **XAUUSD (Gold Spot)** is a **classic higher-timeframe accumulation pattern** followed by **a potential explosive bullish leg**.
After a strong move up in April, we witnessed a **textbook V-reversal**, consolidation, and now — **a higher low** forming around the \$3,290 zone. That’s our key demand level. 💥
✅ If this higher low holds and price starts pushing with volume, we may be gearing up for a **multi-phase breakout** with the following potential targets:
🔹 **Target 1:** \$3,500
🔹 **Target 2:** \$3,694
🔹 **Target 3:** \$3,902
🎯 **Final Target:** \$4,101+
This isn’t just a short-term scalp setup. This is a **position trade opportunity** for those with patience and precision. The structure is clean, momentum is returning, and the levels are marked.

Gold continues to rise slowly
Gold weekly and monthly level: For the monthly level, many people think that the bull market is over when they see the continuous long upper shadow cross K, and they don’t think that it can’t even effectively lose the 5-day moving average, and it is still in a strong stage in the strong stage, and it is also running on the upper track of the upward channel, indicating that the bull market has yet to continue. If it directly pulls up and engulfs the high point of last month this month, a group of bearish people will be wiped out. It has always been emphasized that you should not underestimate the trend of the past two years, and don’t guess the top. This top will reach a height that everyone can’t imagine. Following the bull trend is the right choice. Holding on to the low-level bullish band bottom position in your hand is the happiest moment in the past two years and the most witnessing moment of strength; and the weekly level, as mentioned at the weekend, don’t look at the big negative last week and lose the lower track of the channel. It is also completely possible to directly come back with a big positive this week.
Gold daily level, there has been a continuous positive breakthrough during the day. Once the closing confirms that the breakthrough is effective, it will continue to rise tomorrow and directly approach the lower track of the previous yellow channel. 340 0 line; then going forward, we have to fight for the last key pressure point, the 3500-3452 previous high trend connection line, which roughly corresponds to 3440. Once it breaks through here directly, 3500 will inevitably be unstoppable and move towards 3700; however, there is no need to be too anxious at the moment, be down-to-earth, and overcome the resistance level step by step, but you must try to look far ahead to see more clearly
Gold hourly line level: From the opening to now, it has been rising slowly all the way, with a small negative in the middle, all positive, this kind of pull-up pattern must not be tested for shorts, and during the European session, it also broke through the upper rail resistance level of the 3335 downward channel, and there was a second pull-up in the US session; it just couldn't step back, and even the 10-day moving average didn't give a chance. If you want to step back and follow the long position, there is no chance for the time being, and going long directly seems more radical; you can wait patiently, be bullish, and don't go short; if you can confirm that it is above 3335 today, you can try to follow the bullish trend, and the upper resistance target is 3374

Today, we will focus on the resistance around 3350
Gold continued to rise without any retracement. At present, the reason for the rise in gold is the market's optimistic expectation that the Federal Reserve will resume interest rate cuts later this year. The US employment report to be released on Thursday may also become a catalyst for the decline in US bond yields, which is usually favorable for gold. Although gold has recently adjusted back, if the US dollar continues to depreciate, gold still has the greatest potential for growth in the short term.
From the trend point of view, gold has risen slowly and continuously, and the new round of resistance needs to be placed around 3350. If this position breaks again, it actually looks at 3400 above, or pierces 3350 but weakens, then it will not fall sharply. At present, this slow rise market has no other good intervention opportunities except for direct long
And the European session will first look at the second highest pressure of 3336. If it breaks easily, there is no need to intervene in the short position. At present, the good intervention opportunity is around 3350, with a small stop loss of 3357, and look at the 3330-25 line.

GOLD - bottom out here? What's next??#GOLD.. perfect move as per our analysis and now market looking bottom out here.
Our immediate supporting area is now 3298-98
Keep close with and keep in mind that
We will go for cut n reverse below 3298 on confirmation .
Good luck
Trade wisely

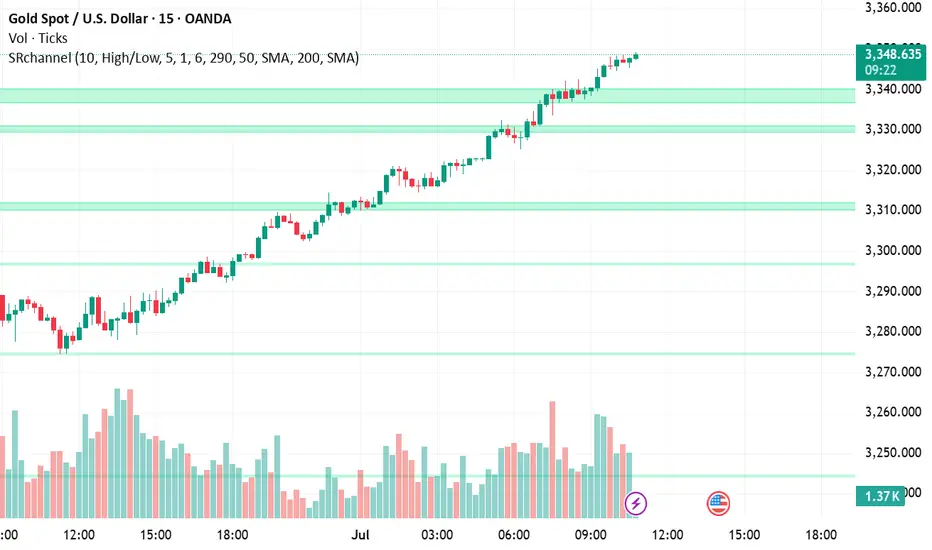
XAU/USD – Bullish Trend Faces Resistance at $3,350 XAU/USD – Bullish Trend Faces Resistance at $3,350 | Watch for Breakout or Pullback!
📅 Published on: Jul 01, 2025
✍️ By: MR_MARK0
🧠 Market Context:
Gold (XAU/USD) has been riding a strong bullish wave, pushing through multiple resistance levels. Currently, price is hovering just below the $3,350 resistance, which marks a critical level for either trend continuation or a potential pullback. Momentum remains in favor of buyers, but signs of exhaustion are beginning to surface.
🔍 Key Zones:
🔴 Resistance Zone: $3,350.0 – $3,352.5
🟢 Support Zone: $3,338.0 – $3,340.0
🟢 Demand Block: $3,310.0 – $3,315.0 (bullish base before recent breakout)
📌 Strategy in Play:
The chart reflects a Trend Continuation Strategy with key support/resistance zones identified. Price has shown strength, but we are now at a make-or-break level. Patience is crucial here.
🧭 Trade Idea:
🔁 Buy the Dip:
Entry Zone: $3,340 – $3,342
SL: Below $3,338
TP1: $3,352
TP2: $3,360
🔁 Breakout Play (Aggressive):
Entry: On breakout above $3,352 with bullish volume
SL: Below breakout candle low
TP: $3,360 and $3,372
⚠️ Risk Note:
Price is extended; a fake breakout above $3,350 may trigger a bull trap. If price fails and drops below $3,338, expect a corrective move toward $3,330 – $3,310. Watch volume divergence and candle rejection patterns.
Bearish Setup for GoldGold is currently in a retracement phase after breaking below the mid Keltner channel zone. The small upward arrow marks this temporary relief rally, which I anticipate will be short-lived.
Price is testing the lower band of the inner Keltner channel after rejecting from the upper zones. The structure suggests a classic lower high formation before a potential major sell-off, targeting the deeper liquidity zones around $3,218 – $3,160 and possibly $3,080 if momentum accelerates.
📉 Bias: Bearish
📌 Invalidation: A clean break and close above the red resistance block (~$3,320+)
📌 Target Zones: $3,218 → $3,160 → $3,080
🔔 Look for volume drop and wick exhaustion confirming the next leg down.
This retracement may offer one final short entry opportunity before a deeper correction unfolds.

Bullish Reversal Setup on GOLD/USD Bullish Reversal Setup on GOLD/USD 💰📈
🔍 Chart Analysis:
The chart illustrates a clear bullish reversal structure forming off a strong support zone:
📌 Key Observations:
Multiple Rejections at Support 🟠
The price has reacted to the 3,300 - 3,280 USD support zone multiple times, forming a triple bottom pattern, indicating strong buyer interest.
Bullish Harmonic Pattern ✅
A bullish harmonic pattern (likely a Bat or Gartley) completed right at the support level, triggering a strong reversal with a bullish engulfing candle.
Break of Minor Structure 📊
Price broke through minor resistance near 3,340 USD, confirming bullish momentum. The breakout is supported by a retest shown with the green arrow 🟢.
Target Point Identified 🎯
The projected target is 3,460 USD, marked clearly as the next significant resistance zone. This aligns with previous price rejection areas, making it a high-probability target.
📈 Trading Outlook:
✅ Buy Confirmation: Break and retest of 3,340 USD zone.
🎯 Target: 3,460 USD.
🛡️ Support Zone: 3,300 – 3,280 USD (watch for any breakdown below this).
📌 Conclusion:
The chart signals a high-probability bullish continuation, with strong support, harmonic confluence, and structural breakout. Traders may look for buy opportunities on pullbacks with the target set at 3,460 USD. 🚀📊

The bull market is too fierce. How to solve the short position?📰 News information:
1. Geopolitical situation
2. PMI data
📈 Technical Analysis:
The conflict between Iran and Israel has stopped for a while, but there is a possibility of it breaking out again. There is a possibility of triggering risk aversion in the short term. From a technical perspective, the 4H MACD indicator shows a golden cross, and the moving average and other indicators are also radiating upward, with a strong bullish signal. The 1H chart Bollinger Bands open upward, and the short-term pressure position is at 3340-3345. The short-term data indicators are seriously overbought, and there may be a profit correction in the short term. Therefore, if you want to short in the short term, you can only consider the 3340-3350 range. In the short term, gold will not usher in a large retracement, and the short-term target is only suitable for looking at 3320-3310. As for the long trading point, it is expected to wait for the European and American trading hours.
🎯 Trading Points:
SELL 3340-3350
TP 3320-3310
BUY 3325-3315
TP 3335-3340-3350
In addition to investment, life also includes poetry, distant places, and Allen. Facing the market is actually facing yourself, correcting your shortcomings, confronting your mistakes, and strictly disciplining yourself. I hope my analysis can help you🌐.
TVC:GOLD OANDA:XAUUSD FOREXCOM:XAUUSD PEPPERSTONE:XAUUSD FXOPEN:XAUUSD FX:XAUUSD

XAUUSD Long Setup – Watching 3247 Entry ZoneHi Traders,
The recent price action of XAUUSD has been a bit complex, but I hope this idea turns out to be profitable for everyone.
Feel free to share your thoughts if you see anything differently.
What I find most interesting is the entry zone around 3247–3245 . If we take the wave count starting from May 15, 2025 (3120.76) and consider wave 5 to be completed on June 15, 2025 (3451.52), then wave 2 should ideally retrace to around 3247.
On top of that, wave C of wave 2 seems to follow a clean 1–2–3–4–5 structure. If we treat the current move as a downtrend, wave 5 would likely complete right at 3247, which I find both accurate and technically compelling.
I'll be watching 3247 closely and plan to go long from there.

7.1 London gold rebounds and rises, gold market trend analysis aGold rose to 3295 in the Asian session on Monday and was blocked. It fell in the European session as we expected, but the decline was not strong. After the lowest price of 3274.57, it rose again in the US session and stood firmly at the 3300 mark. The monthly line closed with a cross Yang K. The gold price continued to rise at the opening today. After the market on Monday, the 3247 below can be used as a reference for the bottom rebound position. Now the short-term trend belongs to the bulls, so we will continue this trend today and look at the upward trend first, wait for the European session to see the strength of the decline and then formulate the idea of the US session.
From the market point of view, after the gold price stood above the 3300 mark again, it is used as a short-term support level reference for the bulls. The Asian session can rely on this position to arrange long orders to see the continuation of the upward trend; the initial pressure on the upper side focuses on the 3328 position, followed by 3345. Now that the idea is established, the idea for intraday operations is: wait for the gold price to pull back to around 3308 in the Asian session and then go long and bullish, protect the 3300 mark, and target around 3328; if there is pressure at 3328 in the European session, you can arrange short positions with a downward trend, wait for the US session, and then decide whether to go long again based on the pullback position and target around 3345.
