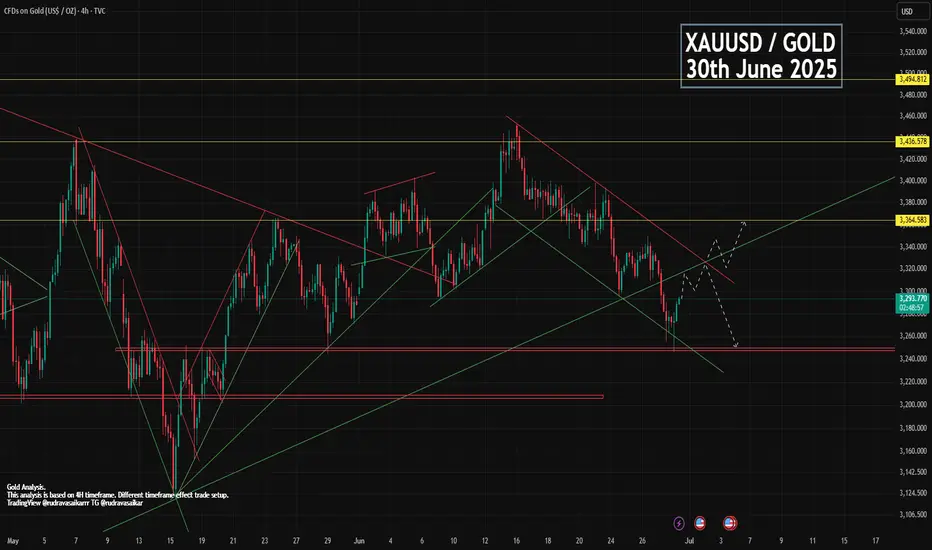
XAUUSD Under Pressure: What the Market Is Telling UsGold (XAUUSD) is currently trading with a clear bearish bias, showing sustained downside momentum on the 4H timeframe 🕒. Price has been gradually stepping lower, and the structure continues to favor the sellers.
As expected for early in the week, there’s been a bit of choppy movement ⚖️, but the overall sentiment remains weak. Unless we see a strong shift or catalyst, I’ll be maintaining a bearish outlook.
🧭 I’m watching for price to revisit key resistance levels, and if we get a clean break and retest 🔄, I’ll be looking for potential short setups from areas of previous demand that flip into resistance.
🌐 Keep an eye on broader risk sentiment — if NASDAQ starts pulling back or DXY strengthens, it could fuel further downside in gold.
As always, this is not financial advice, but the detailed breakdown is available in the latest video 🎥.
Goldprediction

6.30 Four-hour resistance determines the strength of the reboundAt the weekly level, the short-term focus is on the adjustment and continued breaking of the weekly support. As time goes by, the weekly support is at the 3285 watershed. At the daily level, after the price broke the daily support last week, the price continued to rely on the daily resistance to bear pressure. At present, the daily resistance is at the 3355 area resistance. Below this position, gold can continue to be shorted. At the four-hour level, the four-hour key position is the key to our emphasis on short-term trends. At present, the four-hour watershed is in the 3300 area, so the focus is on the gains and losses of this position. Before it breaks up, the short-term focus will be on the pressure first, but once it breaks up, it will need to focus on the rebound to the daily resistance. From the one-hour perspective, the bottom rebounded during the early morning session and broke through the high point of the previous trading day’s early morning retracement, so the short-term is still in adjustment. Temporarily pay attention to the gains and losses of the 3300 position, and treat it as the right-side trading method in terms of operation.

GOLD 30th JUNE - MONTH-END BULLISH OR BEARISHDue to war no update on gold, gold made bolt move downward. Slowly war has been becoming calm but no good news about it has been stopped completely. But you can see some great and correct structure in gold chart where you can find amazing entry and exit points. Gold lower was 1246 since then. Now gold is trading in bullish flag and expecting to breakout. And after breakout we can expect a big move upward.
Key point.
Support - 3248, 3272, 3289
Resistance - 3298, 3313, 3332, 3349
Comment and like for analysis. Love it then follow
Any Query Reach Us or comment down.
Follow for more updates.
Rudra Vasaikar Wishes You A Great And Very Amazing Trading Life. Trade Safe, Trade Right.
RISK WARNING 🔴 🔴 🔴
There is high risk of loss in Trading Forex, Crypto, Indices, CFDs, Features and Stocks. Choose your trade wisely and confidently, please see if such trading is appropriate for you or not. Past performance is not indicative of future results. Highly recommended - Information provided by Rudra Vasaikar/Pro Trading Point are for Educational purpose only. Do your investment according to your own risk. Any type of loss is not our responsibility.
HAPPY TRADING.
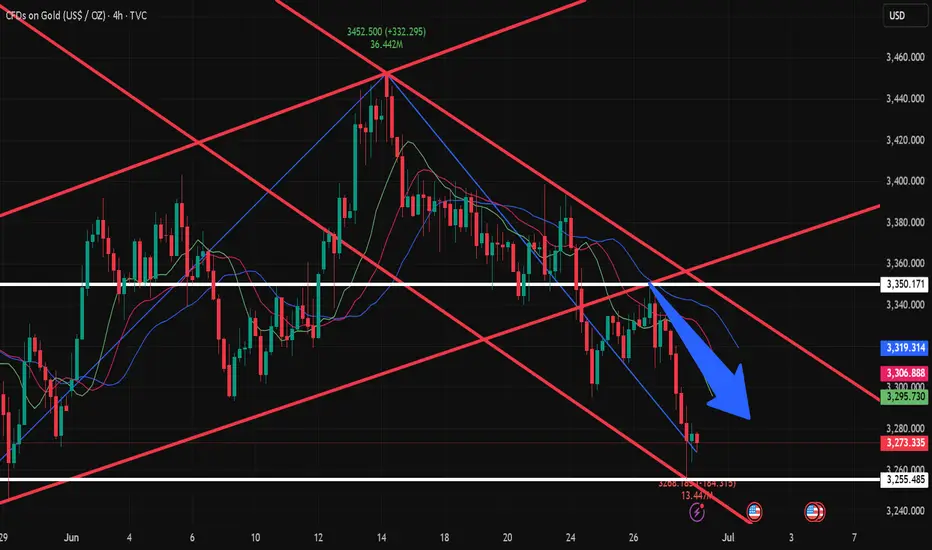
Gold continues to be weak, but be careful about operations
📣Gold prices fell 2% last Friday, hitting a near one-month low. Optimistic trade-related agreements boosted risk appetite and weakened the attractiveness of gold as a safe-haven asset. This week, the market will usher in a group meeting of major central bank governors around the world (Fed Chairman Powell, European Central Bank President Lagarde, Bank of England Governor Bailey, Bank of Japan Governor Kazuo Ueda, and Bank of Korea Governor Lee Chang-yong). The market will also usher in non-agricultural data. In addition, Powell's remarks on whether to resign may ignite the market this week. Gold prices may fluctuate more around the lower track of the Bollinger Band at $3,270/ounce this week.
Technical analysis:
Last Friday, the K-line had a lower shadow, and the Bollinger Band did not diverge. It is not easy to go short directly in operation, but wait for the rebound to confirm 3295 and the key resistance of ma5 to be short.
💰 Operation strategy: Rebound to 3280-3283 to go short, target 3270-3265, stop loss 3288-3290

XAUUSD📉 The Setup: Bullish Divergence on XAUUSD (15m/30m)
Buy only on Breakout
🔍 Observation:
On the 30-minute timeframe, price made a lower low while the RSI indicator printed a higher low — classic sign of bullish divergence 🔄.
💡 Translation: Bears are losing steam! Bulls may be preparing to charge in! 🐂⚡
📊 Trade Plan – Long Entry

$XAU (XAUUSD) 4H forecastGold swept short-term sell-side liquidity and tapped into a daily FVG, where price is currently consolidating.
The 4H chart shows two potential paths:
Retrace Scenario: Price may rally short-term into the 4H FVG zone for a premium-based entry — ideal area for shorting continuation aligned with the bearish daily and weekly narrative.
Immediate Breakdown: If price rejects at current levels, a continuation toward the 3246 and 3205 daily draw-on-liquidity zones is likely.
XAU/USD) bearish Trand analysis Read The captionSMC trading point update
Technical analysis of (XAU/USD) on a short-term timeframe, incorporating several key tools and concepts:
---
Overview of the Analysis
Price Level (Current): Around $3,273.40
EMA 200 (Blue Line): Around $3,337.95 (signaling broader trend)
Resistance Zone (Yellow Box): Between approximately $3,300–$3,320
Support/Target Zone: Around $3,231.11
RSI (Relative Strength Index): At 32.88, which is near oversold territory (below 30)
---
Interpretation of Chart Structure
1. Descending Channel:
Price is moving within a downward-sloping channel.
Suggests a bearish trend is in play.
2. Resistance Level (Yellow Box):
Price is expected to retest this area and face resistance.
Confluence of a supply zone and upper trendline, reinforcing its strength.
3. Projected Price Action:
Price may climb back up into the resistance zone.
A rejection is anticipated, leading to another leg down.
The target is around $3,231.11, which matches previous measured moves.
4. Measured Moves (Blue Arrows):
Highlights historical price drops of ~79 points.
Repeating this pattern suggests symmetry and continuation.
5. RSI Indicator:
Currently at 32.88: nearing oversold, but not quite.
No clear bullish divergence, so price could drop further.
---
Trade Idea Summary
Bias: Bearish
Entry Zone: Near $3,300–$3,320 (resistance)
Target: Around $3,231.11
Invalidation: If price breaks and holds above $3,337–$3,340 (EMA 200 and channel breakout)
Mr SMC Trading point
---
Caution/Considerations
Watch for false breakouts above the resistance zone.
Monitor RSI for potential bullish divergence that could invalidate the downside.
Be cautious around the U.S. economic news event icon, which might cause volatility.
plesse support boost 🚀 this analysis)

Navigating Gold Futures: Support, Resistance, and ProjectionsCOMEX:GC1!
The chart appears to depict a clear five-wave pattern: I, II, III, IV, and V.
Waves I to III show strong upward movements, indicating bullish sentiment.
Wave IV looks like it could be a corrective phase, with a potential dip before another upward movement in Wave V.
Support and Resistance Levels:
The horizontal lines around 2,800 and 2,575.3 indicate critical Fibonacci retracement levels (38.20% and 50%).
If the price approaches these levels during the correction, they could serve as support, making it a potential buying opportunity.
RSI Indicator:
From the bottom indicator (RSI), we can see fluctuations in momentum, which can aid in timing trades.
Look for interpretations of the RSI: if it trends towards the extremes (overbought/oversold), that could signal reversal points.
Future Projections:
Should the market respect the outlined support levels, Wave V could potentially push towards a new high above 4,000 as indicated by the upward projection.
Market Sentiment:
Overall, the pattern suggests a bullish outlook long-term, but caution is warranted during corrective phases as prices might retrace towards support levels.

GOLD BUY + SHORT TRADE IDEA Buy Signals !
We Are Looking For Buy trade Reasons : Consolidating Upto Demand Thats We Are Looking For A Bullish Move to Supply Zone
Buy Zone : 3269-3263
Targets : 3300/3325
SL : 3255
Sell Signal !
We Are Looking For Best Sell Trade Reasons : Order Block H1 + H4 Thats We Are Take Sell With Best Entry With High Target Sell Side Liquidity
Sell Zone : 3327-3334
Target Sell Side Liquidity - 3245-3250
SL 3345

"BREAKOUT ALERT! XAU/EUR Bear Raid – Get In Before The Drop!"🤑 GOLD HEIST ALERT! 🚨 XAU/EUR Bearish Raid Plan (Thief Trading Style) 💰🔥
🌟 Greetings, Market Pirates & Profit Snatchers! 🌟
Based on the 🔥Thief Trading Strategy🔥, we’re plotting a high-stakes bearish raid on XAU/EUR ("The Gold Market"). Our mission? Short the breakout & loot the downside!
🎯 TRADE SETUP (Scalping/Day Trade)
Entry (Sell Zone) 📉: 2841.00 – Wait for Neutral Level breakout, then strike!
Pro Tip: Place sell-stop below support or sell-limit on pullback (15-30min TF).
Set an ALERT! Don’t miss the breakout moment.
Stop Loss 🛑:
"Stop right there, cowboy! 🤠 If you’re entering on a sell-stop, DO NOT set SL before breakout!
Thief SL Rule: Nearest swing high (30min TF) – Adjust based on your risk & lot size.
Rebels, be warned – stray at your own peril! 🔥
Target 🎯: 2815.00 (Lock profits & escape like a pro thief!)
💡 WHY THIS HEIST? (Bearish Triggers)
Technical Setup: Oversold bounce? Trap. Strong bearish reversal brewing.
Fundamentals: Macro risks, COT data, geopolitics – Gold’s under pressure!
News Alert 🚨: High-impact events ahead! Avoid new trades during news – trail stops to protect gains.
💥 BOOST THE HEIST! 💥
Like & Boost this idea to strengthen our robbery crew! More loot = more winning trades. Stay tuned for the next heist! 🚀💰
⚠️ Disclaimer: Trade at your own risk. This is not financial advice – just a strategic raid plan. Manage risk wisely!

Non-agricultural data is coming. Will it affect the market trendBecause there will be non-agricultural data next week, Quaid thinks that the market will not be in a hurry to perform at the beginning of the week. And Friday is the US Independence Day, and the market will be closed in advance; maybe only Wednesday and Thursday are really needed.
This week, gold closed below 3300, and the daily line was also broken, and gold officially entered a bearish trend.
First look at the monthly line chart
Because next Monday is the last day of June, the monthly line will start to close, so you can still pay attention to the support of the monthly line. The MA5 moving average below the monthly line is currently around 3170. Moreover, with the support of non-agricultural data next week, the possibility of touching around 3170 is not ruled out.
Secondly, from the weekly line chart
The weekly line is basically the same as the monthly line. The MA20 moving average below is also around 3170. So next week, I think we should focus on around 3170. The monthly line and the weekly line resonate, so the probability of touching this position is very high.
Finally, let's look at the daily chart. The daily chart shows a downward trend and the short-term support has been broken. The current support is around 3250. I think there is a high probability of a small sideways consolidation at the beginning of the week. If the market conditions are eager to change, it may rebound slightly and then continue to decline. If it falls below 3250, it will continue to fall towards 3200. If this level is broken, it may hit the low point of 3170-3175.

Gold is in the Bearish DirectionHello Traders
In This Chart GOLD HOURLY Forex Forecast By FOREX PLANET
today Gold analysis 👆
🟢This Chart includes_ (GOLD market update)
🟢What is The Next Opportunity on GOLD Market
🟢how to Enter to the Valid Entry With Assurance Profit
This CHART is For Trader's that Want to Improve Their Technical Analysis Skills and Their Trading By Understanding How To Analyze The Market Using Multiple Timeframes and Understanding The Bigger Picture on the Charts

"Stealing Gold Profits: XAU/USD Long Setup (Risk-Reward Heist)"🔥 GOLD HEIST ALERT: XAU/USD Breakout Robbery Plan (Long Setup) 🔥
🌟 Hi! Hola! Ola! Bonjour! Hallo! Marhaba! 🌟
Attention, Money Makers & Market Robbers! 🤑💰💸✈️
Based on the 🔥Thief Trading Style🔥 (technical + fundamental analysis), we’re plotting a heist on XAU/USD (GOLD). Follow this master plan for a bullish escape near the high-risk ATR zone. Beware—overbought signals, consolidation traps, and bearish robbers lurk! Take profits fast and treat yourself—you’ve earned it! 🏆💸
📈 ENTRY: THE HEIST BEGINS!
Wait for Resistance Breakout (3400.00) → Then strike!
Buy Stop Orders: Place above Moving Average.
Buy Limit Orders: Use 15M/30M pullbacks (swing lows/highs).
Pro Tip: Set a chart ALERT to catch the breakout live!
🛑 STOP LOSS: DON’T GET CAUGHT!
For Buy Stop Orders: Never set SL before breakout!
Thief’s SL Spot: Recent swing low (4H timeframe).
Adjust SL based on your risk, lot size, and order count.
Rebel Traders: Place SL wherever—but you’ve been warned! 🔥
🏴☠️ TARGET: 3480.00
Scalpers: Long-only! Use trailing SL to lock profits.
Swing Traders: Join the robbery crew for bigger gains.
📊 MARKET CONTEXT:
XAU/USD is neutral but primed for bullish moves 🐂. Watch:
Fundamentals (COT Reports, GeoPolitics, News).
Intermarket Trends & Sentiment.
Positioning & Future Targets (Check our bio0 for analysis linkss!).
⚠️ TRADING ALERTS:
News Releases = High Volatility!
Avoid new trades during major news.
Use Trailing SL to protect open positions.
💥 SUPPORT THE HEIST!
Hit the Boost Button 💖→ Strengthen our robbery team!
Profit daily with the Thief Trading Style. 🏆💪🚀
Stay tuned for the next heist—more loot awaits! 🤑🐱👤🎉

Gold’s Big Heist—Will You Join the Loot or Get Robbed?🔥 GOLD HEIST ALERT: XAU/USD Breakout Robbery Plan (Swing & Scalp Strategy) 🔥
🌟 Greetings, Money Makers & Market Robbers! 🌟
Ready to loot the gold market? 🏆💰 Based on Thief Trading Style analysis (technical + fundamental), here’s how we execute the heist on XAU/USD—escape with profits before the bears trap us!
📈 ENTRY: The Heist Begins!
"Break the Wall!" Wait for RESISTANCE (3370.00) to crack, then strike!
2 Ways to Rob:
✅ Buy Stop above Moving Average (breakout confirmation)
✅ Buy Limit near pullback zones (15m/30m recent swing lows)
Pro Tip: Set a chart alert 🚨—don’t miss the breakout!
🛑 STOP LOSS: Protect Your Loot!
"Yo, listen! If you’re buying after breakout, DO NOT set SL until price confirms!
Thief’s SL Rule: Place at recent swing low (4H timeframe)—adjust based on your risk & lot size.
Rebels, beware! 🔥 Your risk, your rules… but don’t cry if the market robs you back!
🎯 TARGET: Escape Like a Pro
Main Take Profit: 3480.00 (or exit early if the market turns shady!)
Scalpers: Only LONG plays! Use trailing SL to lock profits.
Swing Traders: Ride the trend & split the loot wisely! 💰
⚠️ WARNING: News = Market Chaos!
Avoid new trades during high-impact news.
Trailing stops = your best friend to protect profits.
💎 WHY THIS HEIST?
XAU/USD Trend: Neutral (but bullish potential! 🐂)
Key Drivers: Geopolitics, COT data, macro trends—do your homework! 🌍📰
🚀 BOOST THE HEIST!
Like this plan? Smash the Boost Button! 🔥 Helps us steal more profits & share next robbery targets! Stay tuned—more heists coming soon! 🎯🤝
🎉 Happy Trading, Thieves! May the market favor your loot! �💸

GOLDGOLD is about to get ready for a push up, keep an eye from the reaction zone for buy setups.
Disclosure: We are part of Trade Nation's Influencer program and receive a monthly fee for using their TradingView charts in our analysis.

A new golden week, grasp it with the best condition
Good weekend everyone, this week's trading time is over, and next week's trading time will also enter the countdown. No matter how you grasp the market this week, whether happy or sad, Theo hopes that everyone will not bring your mood to the trading environment next week.
After all, next week is also a new beginning of the week. In the new week, everyone should be prepared for a new state. A good state should be persevered, and a bad state should be adjusted. With a good state to grasp the market trend of next week, I believe you can also be invincible and grasp the market better!
📊Technical aspects
Gold did not break through the upper pressure at midnight on Friday. Gold fell directly after opening in the morning on Friday. The bears broke through the previous 3295 support line, and the lowest level in the evening was 3255, closing at around 3274.
The daily line also closed in the form of a big negative line, with an obvious downward trend, and all the previous support will also turn into pressure. The short-term moving average system crossed downward to accumulate energy for the bears. Since the closing did not break through the upper 3300 pressure level, we will continue to rebound and short next week. After all, the technical side is still short, and only by following the trend can we keep up with the rhythm of eating meat.
From the 4-hour analysis, the upper short-term resistance is around 3295-3301, with special attention paid to the suppression at 3316. In terms of operation, the rebound continues to be the main short and the trend looks down. The lower short-term support is around 3250-3255. The overall main tone of high-altitude participation remains unchanged relying on this range.
💰Strategy Package
Short Position:3290-3300,SL:3315,Target: 3240-3250

Next week's market trend analysisShort-term technical analysis of gold next week:
After gold was horizontally consolidated below 3400, it had two relatively large retracements. The short-term downward channel, the upper edge of the channel is currently around 3340, which is also the turning point of the short-term long and short cycles that we need to pay attention to later.
Has the current big rhythm entered a weak position?
Daily level analysis: After reaching 3500, gold is still in a trend of high-level consolidation, and there is a periodic switch between long and short positions, and there is no extremely strong or weak rhythm. In this consolidation process, there are two relatively large retracements: the first from 3500 to 3200 space 300 points, the second from 3435 to 3120 space 315 points. In other words, in the current daily level cycle, the maximum decline is around 300 US dollars. Not exceeding this maximum retracement value, to a certain extent, it is still in the rhythm of high-level correction. According to the range of this space retracement, the limit of the daily retracement is around 3150, with an error of about 20 points. However, the daily range is large, so it is too early to talk about this threshold.
At present, the short-term pressure points of 0.618 and the top and bottom structures are all around 3300. Another point for everyone to pay attention to: in the market with a small cycle of negative decline, once there is a sideways trend. Don't take it as support! The price is consolidating horizontally, which only means that the current bulls are weak in pulling back and the change of weakness must be a strong pullback to break through the big negative. Similarly, the slow rise market is the same.
The first support below in the short term is around 3250. The strong support is at the integer level of 3200. Once this position is reached, it will become a repeated test position like 3400.
Gold fluctuates and rebounds, don't chase shorts at low levels
💡Message Strategy
Yesterday, Thursday, we believed that the easing of tensions in the Middle East, the cooling of market risk aversion, and the hawkish stance of the Federal Reserve, which believed that the possibility of rate cuts should not be overly expected, suppressed expectations of rapid rate cuts, dragged down the dollar, and jointly suppressed the trend of gold.
However, trade uncertainty, geopolitical situation and expectations of rate cuts still support gold prices, which temporarily supports gold's rebound from a three-week low. Therefore, in terms of operations, it is recommended that everyone pay attention to the upper pressure of $3,345, followed by $3,357, and the lower support of $3,325, followed by $3,310.
From the subsequent trend, during the Asian session, gold fell back to $3,330 and stabilized. After the opening of the European session, the gold price rebounded and rose to $3,350 and encountered resistance. After that, gold fluctuated and fell. The decline continued after the opening of the US session, falling to $3,310 and stabilizing. After the rebound of $3,336 and encountering resistance, gold fell again, and continued to fall after the opening of Friday, refreshing the June low to $3,291, and performing weakly in the short term.
Overall, gold rebounded to $3,350 on Thursday and encountered resistance, then fell back to $3,310 and stabilized. It basically operated between the support and pressure levels we gave. On Friday, the gold price tried to break downward, and the short-term downside risk increased.
📊Technical aspects
On the daily chart, gold fell from a two-month high and rebounded from a low in June this week, but as gold prices fell back on Thursday, the short-term trend of gold prices turned downward again. For gold's upper pressure, pay attention to the integer position of $3,300, followed by Thursday's low of $3,310, and the 1-hour Bollinger band middle track of $3,325;
For gold's lower support, pay attention to the current intraday low of $3,291, which is also the lower track of the daily Bollinger band. A downward break may increase the risk of short-term decline. Pay attention to the two lows of $3,270 and $3,250 when gold prices rebounded at the end of May.
The 5-day moving average and MACD indicator cross, and the KDJ and RSI indicators cross. The short-term technical aspect shows that gold prices are at risk of continuing to fall.
💰Strategy Package
Short Position:3275-3295,SL:3315,Target: 3240-3250

GOLD 1H CHART ROUTE MAP UPDATE & TRADING PLAN FOR THE WEEKHey Everyone,
Please see our updated 1h chart levels and targets for the coming week.
We are seeing price play between two weighted levels with a gap above at 3300 and a gap below at 3271. We will need to see ema5 cross and lock on either weighted level to determine the next range.
We will see levels tested side by side until one of the weighted levels break and lock to confirm direction for the next range.
We will keep the above in mind when taking buys from dips. Our updated levels and weighted levels will allow us to track the movement down and then catch bounces up.
We will continue to buy dips using our support levels taking 20 to 40 pips. As stated before each of our level structures give 20 to 40 pip bounces, which is enough for a nice entry and exit. If you back test the levels we shared every week for the past 24 months, you can see how effectively they were used to trade with or against short/mid term swings and trends.
The swing range give bigger bounces then our weighted levels that's the difference between weighted levels and swing ranges.
BULLISH TARGET
3300
EMA5 CROSS AND LOCK ABOVE 3300 WILL OPEN THE FOLLOWING BULLISH TARGETS
3324
EMA5 CROSS AND LOCK ABOVE 3324 WILL OPEN THE FOLLOWING BULLISH TARGET
3354
EMA5 CROSS AND LOCK ABOVE 3354 WILL OPEN THE FOLLOWING BULLISH TARGET
3383
BEARISH TARGETS
3271
EMA5 CROSS AND LOCK BELOW 3354 WILL OPEN THE FOLLOWING BEARISH TARGET
3239
EMA5 CROSS AND LOCK BELOW 3239 WILL OPEN THE SWING RANGE
3213
3179
As always, we will keep you all updated with regular updates throughout the week and how we manage the active ideas and setups. Thank you all for your likes, comments and follows, we really appreciate it!
Mr Gold
GoldViewFX

GOLD 4H CHART ROUTE MAP UPDATE & TRADING PLAN FOR THE WEEKHey Everyone,
Please see our updated 4h chart levels and targets for the coming week.
We are seeing price play between two weighted levels with a gap above at 3301 and a gap below at 3242. We will need to see ema5 cross and lock on either weighted level to determine the next range.
We will see levels tested side by side until one of the weighted levels break and lock to confirm direction for the next range.
We will keep the above in mind when taking buys from dips. Our updated levels and weighted levels will allow us to track the movement down and then catch bounces up.
We will continue to buy dips using our support levels taking 20 to 40 pips. As stated before each of our level structures give 20 to 40 pip bounces, which is enough for a nice entry and exit. If you back test the levels we shared every week for the past 24 months, you can see how effectively they were used to trade with or against short/mid term swings and trends.
The swing range give bigger bounces then our weighted levels that's the difference between weighted levels and swing ranges.
BULLISH TARGET
3301
EMA5 CROSS AND LOCK ABOVE 3301 WILL OPEN THE FOLLOWING BULLISH TARGETS
3370
EMA5 CROSS AND LOCK ABOVE 3370 WILL OPEN THE FOLLOWING BULLISH TARGET
3429
EMA5 CROSS AND LOCK ABOVE 3429 WILL OPEN THE FOLLOWING BULLISH TARGET
3499
BEARISH TARGETS
3242
EMA5 CROSS AND LOCK BELOW 3242 WILL OPEN THE FOLLOWING BEARISH TARGET
3171
EMA5 CROSS AND LOCK BELOW 3171 WILL OPEN THE SWING RANGE
3089
3171
EMA5 CROSS AND LOCK BELOW 3171 WILL OPEN THE SECONDARY SWING RANGE
3089
3001
As always, we will keep you all updated with regular updates throughout the week and how we manage the active ideas and setups. Thank you all for your likes, comments and follows, we really appreciate it!
Mr Gold
GoldViewFX

GOLD DAILY CHART ROUTE MAPHey Everyone,
Following up on our previous Goldturn channel post – the recent price action has played out exactly as anticipated. We saw a clean rejection at the channel top around 3433, with price failing to lock above and confirming that resistance is still very much in control at the range ceiling.
This rejection was perfect and it led to a decisive move back down into the 3272 Goldturn support. This level is now acting as a critical pivot. From here, we’re watching closely for one of two outcomes:
1. Bounce Scenario: If price holds and we see a supportive reaction from 3272, particularly with no EMA5 cross and lock confirmation, we will look for long opportunities to slowly ascend the channel again. Expect a grind with testing of in-between levels as structure develops.
2. Breakdown Scenario: If 3272 fails to hold, we expect the next key test to occur at the channel’s midline – a level that has acted as support. A further breakdown would likely target 3106, our next Goldturn support zone, for potential reversal setups.
This price action continues to validate the effectiveness of the Goldturn channel structure keeping us grounded and responsive rather than reactive.
We remain focused on level to level trading, guided by the channel and supported by EMA5 confirmations for directional analysis.
Key Levels to Watch:
Resistance: 3433
Support: 3272 (current test), 3106 (if breakdown continues)
Stay patient and let price confirm. The best trades continue to come from structure respecting reactions, not from chasing.
Mr Gold
GoldViewFX

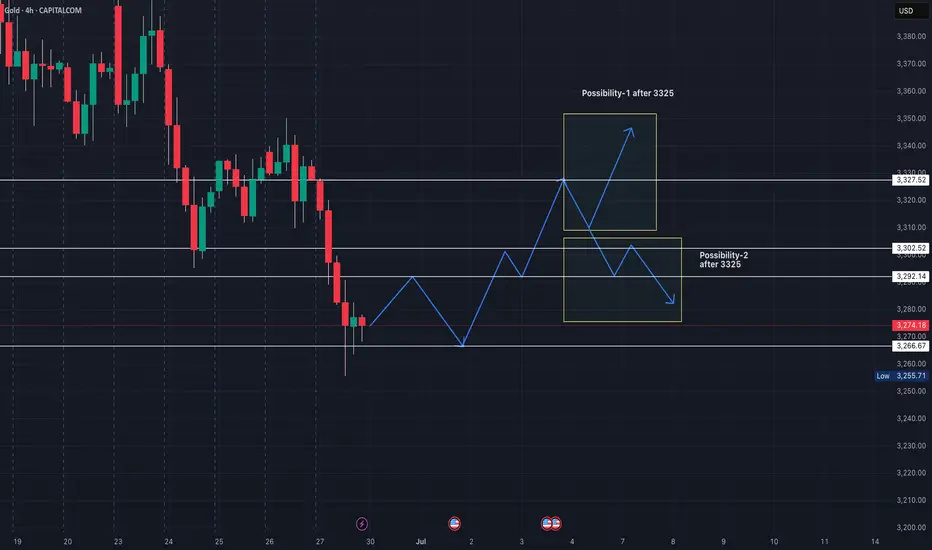
Gold for Week Starting June 30-2025Probability of gold becoming minor bullish in coming week.
After retesting the price to 3266, it should be going north to 3290. Might face small resistence and then to 3300-3302.
Price should take a pullback from that level before going further to 3325 range.
There are 2 possible scenarios after 3325. lets see how price action plays out post that.
Gold has been falling continuously. Will it continue next week?Market review:
The conflict between Israel and Iran intensified, and gold surged in the early stage, and then continued to fluctuate downward. Affected by the situation in the Middle East and weak data from the United States, it fell severely in three trading days, and most of the other time periods were in the stage of repeated washing.
The first round of decline began at the high point of 3452. Affected by the situation in the Middle East, the price rose rapidly, but the rapid rise led to insufficient upward momentum, and the departure of buyers led to continuous declines in a single trading day. The second round of decline was affected by the easing of the conflict between Iran and Israel, and the US dollar, crude oil, and gold all plunged sharply; the third round of decline was Powell's wait-and-see attitude towards the interest rate cut policy, and some US data were bearish for gold, leading to a new round of decline.
Market outlook for next week:
The breaking of the key support bands of 3303 and 3295 means that the downward adjustment has not ended, but after touching the support near 3250, there was a clear bottoming out and recovery. It means that there is strong support below, and the focus of next week's opening is the emergence of price rebound. There were rebounds to varying degrees after the previous two rounds of decline, so this round of decline still needs to be paid attention to. The strategy mainly revolves around shorting on price rebound, with a focus on the upward suppression range of 3285-3310.
If the rebound is small, then at the beginning of next week, it is likely to maintain a small fluctuation in the range of 3270-3285.
