GOLD XAUUSD TodayGOLD XAUUSD Today for me maybe finish down move
Next week I expect change direction to LoNG setups.
My target will be new high.
Goldprediction

Gold today high-altitude low-multiple operation
📌 Gold news
On Tuesday, the spot gold price plummeted, hitting a two-week low. The main reason was that Iran and Israel announced a ceasefire, which suppressed the demand for safe-haven gold. In addition, Fed Chairman Powell made hawkish remarks, which also hit the gold price trend. Short-term long-short game will focus on the PCE inflation data to be released by the United States. If the economic data performs poorly or inflation continues to fall, it may still provide a medium-term rebound opportunity for gold.
📊Comment analysis
Yesterday, gold was weak overall, and the decline and rebound were limited. It fell directly from around 3357 to 3295, and then rebounded according to the news. It ran around 3326 in the morning. From a technical point of view, the daily low trend line support is around 3290, the 4-hour long lower shadow line bottomed out, and three consecutive positive rebounds, the daily line supports the lower track of the Bollinger band, and the Bollinger band tends to be parallel. There is no sign of opening downward, so the short-term decline of gold prices is limited. Consider paying attention to the support of 3294 during the day, and mainly use this position for defense and low long. Pay attention to the important suppression of the middle track 3363 above, and mainly short.
💰Strategy Package
Focus on the support near 3316-3317 in the short term, rely on this position to go long, stop loss 3307, take profit near 3345, and break 3363. If it falls strongly below 3294, then don't consider going long during the day.
Gold operation strategy: long near 3316, stop loss 3307. Take profit 3345
⭐️ Note: Labaron is not 100% correct here, only a steady operation idea, large warehouse for trend, small warehouse for wave, control the proportion by yourself, there is no unprofitable investment, only unsuccessful orders, whether to make money depends on the timing of buying up and buying down, making money depends on opportunities, investment depends on wisdom, and financial management depends on professionalism.

The latest analysis of gold trend on June 25From the perspective of technical analysis, based on the daily level, the gold price is expected to be further under pressure in the future. At the daily level, the current focus is on the 3370 area resistance. The 1-hour line shows that the short-term pressure is at the position of the previous upward trend line retracement. Due to the short-term market volatility and decline, it is necessary to temporarily focus on the current downward trend line area resistance, which is also the daily and four-hour resistance area. The 3330-3315-3310 area will be followed below. If the market is in an extremely weak state, the gold price is expected to test the 3330-3270 area. From the indicator signal, the RSI oscillation around 50 shows that the market is balanced between long and short forces, the MACD red column shrinks, and the fast and slow lines flatten, indicating that the bullish momentum is weakened; the KDJ high dead cross shows that the short cycle may be corrected.
Comprehensive technical analysis, today's short-term operation strategy for gold is mainly rebound short selling, supplemented by low long selling. The short-term focus on the upper side is the 3370 - 3380 resistance line, and the short-term focus on the lower side is the 3330 - 3315 support line.

Gold breaks down and moves downward, focus on the 3300 markWith the official ceasefire between Iran and Israel, although there are some repeated frictions in the middle, under Trump's mediation, both parties are relatively tolerant. It seems that the war has been declared over. Gold has also fallen sharply. In the early trading, it fell sharply to around 3333 and stabilized. After rebounding to around 3357, it fell again under pressure. During the European trading session, it broke the low and continued. It repeated around 3317/8 and fell again under pressure around 3332. This position has become the key pressure point for the current top and bottom conversion. In the evening, the testimony of Federal Reserve Chairman Powell was also relatively cautious. He believed that inflation had declined, but it was still far from the 2% target. He tended to adjust interest rates after inflation achieved the target. Therefore, the double pressure caused gold to rebound weakly and repeatedly run weakly. At present, the lowest level reached 3304, which is one step away from the 3300 mark. Judging from the current trend, the overall weak pattern continues. In the evening, relying on the 3300 mark, try a long order for the last time, and then do a good job of continuing defense after the break.
6/24 Gold Evening Reference Ideas
Gold is long near 3303/05, defend 3298, target 3320/3330, short at 3298, defend 3305, target near 3276, short at 3330, defend 3337, watch 3316/08

GOLD 4H CHART ROUTE MAP UPDATEHey Everyone,
Great day on the markets once again. This is an update on our 4H chart idea from Sunday, also playing out perfectly.
We started with our bullish target hit at 3375 with no cross and lock confirming the rejection into completing our bearish target at 3306. We will now need to see ema5 cross and lock on either weighted level to determine the next range.
We will keep the above in mind when taking buys from dips. Our updated levels and weighted levels will allow us to track the movement down and then catch bounces up.
We will continue to buy dips using our support levels taking 20 to 40 pips. As stated before each of our level structures give 20 to 40 pip bounces, which is enough for a nice entry and exit. If you back test the levels we shared every week for the past 24 months, you can see how effectively they were used to trade with or against short/mid term swings and trends.
The swing range give bigger bounces then our weighted levels that's the difference between weighted levels and swing ranges.
BULLISH TARGET
3375 - DONE
EMA5 CROSS AND LOCK ABOVE 3375 WILL OPEN THE FOLLOWING BULLISH TARGETS
3439
EMA5 CROSS AND LOCK ABOVE 3439 WILL OPEN THE FOLLOWING BULLISH TARGET
3499
EMA5 CROSS AND LOCK ABOVE 3499 WILL OPEN THE FOLLOWING BULLISH TARGET
3561
BEARISH TARGETS
3306 - DONE
EMA5 CROSS AND LOCK BELOW 3306 WILL OPEN THE SWING RANGE
3236
3171
EMA5 CROSS AND LOCK BELOW 3171 WILL OPEN THE SECONDARY SWING RANGE
3089
2995
As always, we will keep you all updated with regular updates throughout the week and how we manage the active ideas and setups. Thank you all for your likes, comments and follows, we really appreciate it!
Mr Gold
GoldViewFX

xauusd sells this past pre ny/ nyse open Like and Comments would be appreciated :D Not Financial Advice, Just my outlook/opinion

Dark moment for prices. Will it fall even lower?Information summary:
Due to the ceasefire in the 12-day war between Iran and Israel, market risk appetite has rebounded, demand for safe-haven assets has declined, and gold prices have plummeted. As an interest-free asset, gold prices are under pressure against the backdrop of declining risk aversion, but there is still buying support at low levels.
Investors are currently focusing on the speech of Federal Reserve Chairman Jerome Powell at a hearing of the House Financial Services Committee. Powell has been cautious about whether to cut interest rates in the near future.
Market analysis:
The current market selling sentiment has increased significantly, and for gold, falling has become the only path. It seems that the market has lost hope in gold, and the current gold price has fallen to around 3295, then rebounded slightly, and is currently fluctuating around 3313. The break of 3300 declares that gold still has further room to fall, and from the trend point of view, it is likely to continue to fall.
The current trend shows that the important support is around 3285. It is possible that it will fall directly to the current position. The Fed is still speaking, and it is unpredictable whether it will cause drastic fluctuations in gold in the future. However, from today's trend, shorting is the best solution at present, and the upper resistance position is in the range of 3315-3325.
Operation strategy:
Short around 3320, stop loss 3330, profit range 3290-3285.

Gold prices rose as dollar data was not good
📌 Gold information:
Gold prices plunged on Tuesday as a ceasefire was declared in the 12-day war between Iran and Israel, market risk appetite rebounded, and demand for safe-haven assets declined. The ceasefire news pushed global stocks higher, while oil prices fell to a two-week low as concerns about supply disruptions eased. The plunge in crude oil prices also further suppressed gold's inflation hedging appeal. As an interest-free asset, gold prices are under pressure against the backdrop of waning risk aversion, but there is still buying support at low levels.
Investors are currently focusing on Federal Reserve Chairman Jerome Powell's appearance at a House Financial Services Committee hearing. Powell has been cautious on whether to cut interest rates in the near future.
📊Comment Analysis
The current market selling sentiment has increased significantly, and for gold, falling seems to be the only way to go. Today, whether you look at rebound short or low long, basically you will not have a chance, that is, falling, it seems that the market has lost hope in gold, and the current gold has fallen to 3295, and the break of 3300 declares that gold has further room to fall. From the trend point of view, it is likely to fall now!
The further strong support on the current trend line is around 3274, and it is not ruled out that it will fall directly to the current position. At present, the Federal Reserve is still speaking, and whether it will cause drastic fluctuations in gold in the future is still unpredictable, but from today's trend, shorting is already the best solution at present, and the upper resistance can first look at 3330!
💰Strategy Package
Gold: Rebound 3325-3335 short, stop loss 3345, target 3290-3300!
⭐️ Note: Labaron hopes that traders can properly manage their funds
- Choose the lot size that matches your funds
Analysis and layout of the latest gold trend in the evening📰 Impact of news:
1. The ceasefire agreement reached earlier did not take effect, and Trump believed that both sides violated the agreement
2. Federal Reserve Chairman Powell delivered a speech 3 hours later
📈 Market analysis:
After falling below the 3300 mark, gold hit the 3295 line and then rebounded. However, there are too many long orders at the current high level of gold, and the market will not rise easily. The current international situation is so tense, and gold is still slowly declining. It is difficult to rebound sharply in this situation. In the short term, focus on 3290-3280 below. If effective support is obtained, you can go long and look towards 3300-3310. If it falls below the support line of 3290-3280, the downward channel of gold will be opened and it is expected to reach 3265. At the same time, pay attention to the 3328-3338 resistance range on the upside. If the first rebound in the evening encounters pressure and resistance here, you may consider shorting.
🏅 Trading strategies:
SELL 3328-3338-3400
TP 3310-3300-3295
BUY 3290-3280
TP 3300-3310
If you agree with this view, or have a better idea, please leave a message in the comment area. I look forward to hearing different voices.
TVC:GOLD FXOPEN:XAUUSD FOREXCOM:XAUUSD FX:XAUUSD OANDA:XAUUSD

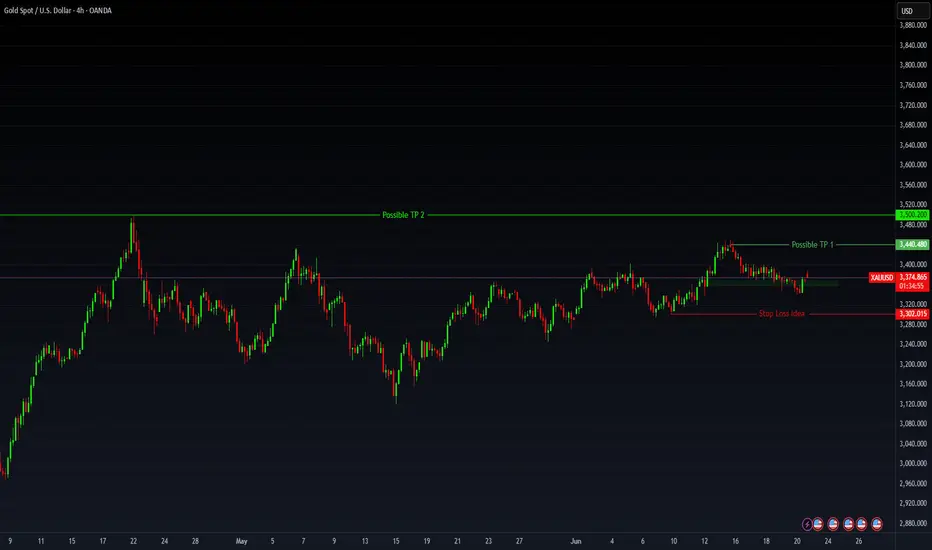
Gold’s Geopolitical Launchpad: Eyes on $3,500+🟡 GOLD - Macro Fuel Meets Technical Momentum Trade Levels Inside
Gold continues to flex its haven status as geopolitical tensions flare once again—this time triggered by reports of a U.S. airstrike on Iranian nuclear facilities. That headline risk has lit the fuse under precious metals, and the reaction in futures markets has been swift.
Friday’s intraday washout—largely driven by hopes that President Trump would opt for diplomacy—was short-lived. The strong recovery into New York close left a long lower shadow, signaling buyers are already pricing in weekend escalation risk.
💡 Macro View:
- Analysts project a move toward $3,500–$3,700, driven by a twin-engine of geopolitical instability and sticky inflation.
- Central banks are staying long; ETF inflows are ticking up—this isn’t just speculative hype.
- Goldman’s base case: $3,700 EOY, $4,000 by mid-2026. Recession/volatility scenarios stretch targets up to $4,500.
🔧 Technical Setup:
- Bias across all time frames remains bullish. Open float pressure is stacking with long-side conviction.
- Key long trigger zone sits between $3,369–$3,375—I’m watching for confirmation here.
- Profit targets:
- First resistance: $3,440.48
- Second target: $3,500 zone
- Stretch: $3,520+ if volatility expands
Gold Trading Strategy June 24Quite surprised with the price gap down at the beginning of the day. A sweep to 3333 and recovery to increase again in the Tokyo trading session.
This recovery completely breaks the market's bullish wave structure.
3363 and 3335 are paying attention in today's Asian and European trading sessions. This area can be traded short-term in the sideways range. The SELL area pays attention to the opening gap at 3368.
The upper range has some adjustments compared to yesterday in the direction of decreasing prices, so the SELL range 3386 and 3410 is paid attention to for trading.
Resistance: 3363-3368-3386-3410
Support: 3335-3322-3296
Good trading signal
BUY GOLD 3323-3321 Stoploss 3318
SELL GOLD 3363-3365 Stoploss 3370

Trade Idea: XAUUSD Short (SELL LIMIT) 1. Trend Alignment: H1 shows a clear down-trend — lower highs at 3446 → 3397 → 3347. SMAs on H1/M15 have turned down.
2. High-Probability Pullback: Price has broken the 3340 support twice and pulled back. Resistance here is offering a tight stop and plenty of room to TP.
3. Structural SL: Stop sits just above the prior swing high (~3350–3352)
Entry
Sell Limit @ 3340.37
Prior day low (now resistance) on H1 & M15
Stop Loss
3352.00
Just above the swing high around 3350–3351
Take Profit
3293.07
Invalidation
15 min candle close < 3310
Time Expiry
8:30 AM PST
Cancel if not triggered by then
FUSIONMARKETS:XAUUSD

XAUUSD Beginning of a Trend Reversal? Bearish Move IncomingGold is showing signs of potential downside pressure on the 4-hour chart. After a rejection from the upper volatility band and a failure to sustain bullish momentum above the dynamic EMA cloud, price has rolled over and is now trading below the midline support area.
🔻 Bearish Structure Developing:
Price rejected strongly from the upper gray zone (Resistance band).
A new lower high has formed, aligning with bearish market structure.
Candles are trading under the red-to-blue transition EMA ribbon, indicating increasing bearish sentiment.
🎯 Trade Setup:
Entry: Near 3,365
SL: Above the recent high near 3,406
TP: Targeting the lower band support around 3,300 – 3,323

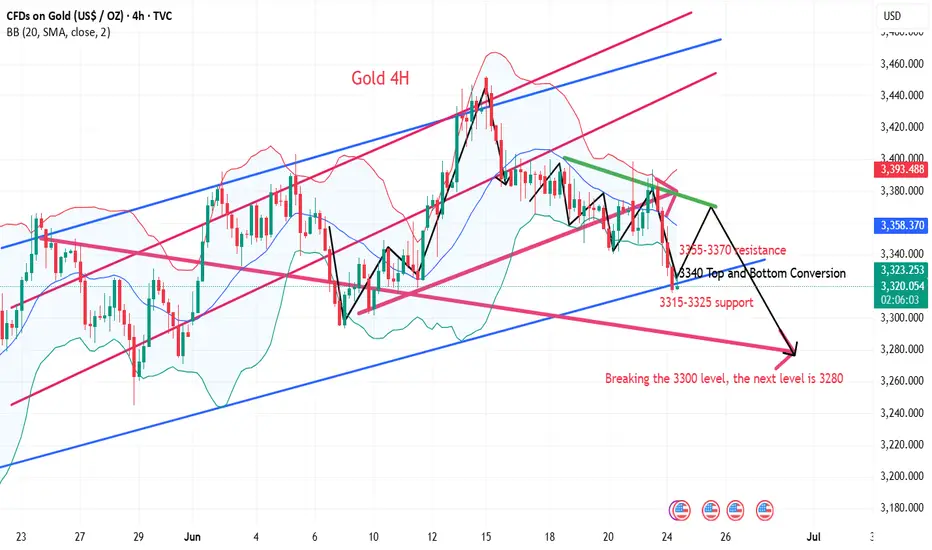
Continue to short after the rebound on 6.24Judging from the current market trend, the upper short-term resistance is around 3343-48, the lower short-term support is around 3310-15, the short-term long-short strength watershed is 3300-05, the daily level is under pressure and continues to see suppression and adjustment, and the main tone should actually be rebound shorting.
Gold operation strategy:
Gold rebounds to 3343-48 and shorts, stop loss 3356, target 3317-3323, continue to hold if it breaks;

Will the gold bearish trend continue?
💡Message Strategy
The gold market is facing a complex game of long and short factors in the near future. On the one hand, US President Trump announced that Iran and Israel had reached a "comprehensive ceasefire", and the market's risk aversion demand plummeted, and gold was under obvious short-term pressure. However, according to Reuters, Israel still has small-scale military operations, which has led to differences in the market's optimism about the situation in the Middle East, and the downward space of gold is temporarily limited.
On the other hand, US economic data is mixed. In June, the S&P global manufacturing PMI remained unchanged at 52, the service industry PMI fell slightly to 53.1, and the composite PMI fell slightly to 52.8, suggesting that the momentum of economic expansion has slowed down marginally. More importantly, Fed officials have released dovish signals one after another. Fed Governor Bowman expressed concern about labor market risks and supported interest rate cuts this year, echoing Governor Waller's expectations of a rate cut in July. This adjustment in monetary policy expectations has led to a weakening of the US dollar, providing some support for gold prices.
📊Technical aspects
1. Pay attention to the defensive position at the weekly level. As time goes by, this position is now in the 3316-3315 area. After breaking 3333 at noon, it accelerated to reach here, so pay attention to the gains and losses here in the future, so as to prepare for the next space switch
2. The daily line has been defending the lifeline for nearly a month. The current lifeline position is 3355. No matter how it pierces in the previous process, the final closing line must return to the top of the lifeline, thus becoming a support area
This means that today's closing is very critical. It can be closed below the lifeline, and then switch space downward to enter the area from the lifeline to the lower track 3355-3280
3. The four-hour pattern opens downward. Yesterday, the resistance of the upper track of the pattern was determined twice, and then it began to fall continuously, fell back to the lifeline, and then fell below the lower track of the pattern. Now it is further down and breaking the low
Then, keeping high is the key, breaking low is the focus. The previous starting and falling acceleration points are 3357 area, 3370, and finally 3388-3390.
Today's high point is 3370 area. The resistance range of 3357 is determined at noon. The pattern opens downward. Keep high and break low to see acceleration. After breaking the high point, it returns to sweeping.
4. The double lines of the hourly chart are glued together to form a pressure area. The interval of 3355-3370 just coincides with the two resistances above. Use this as suppression to switch space downward.
5. The large channel cooperates with the small channel. The price falls below the lower track position of the large channel and begins to switch space further downward. The top and bottom conversion position is 3340, and the final acceleration starting point is 3348.
Use this as suppression, and look down to the weekly defense line area of 3316-3315.
If it falls below, the next support will focus on the 3300 mark. If it breaks 3300 again, the next position is 3280
💰Strategy Package
Short Position:3348-3354,SL:3375,Target: 3300-3310
Long Position:3280-3290,SL:3260,Target: 3340
XAU/USD) Bullish reversal analysis Read The captionSMC trading point update
Technical analysis of Gold (XAU/USD) on the 30-minute timeframe, based on technical signals and price action behavior. Here's the breakdown
---
Gold Bullish Reversal Setup – Targeting 3,384
---
Key Technical Highlights:
1. Support Zone & Price Reaction:
Price has tested a strong horizontal support level (highlighted in yellow).
Multiple bullish rejection wicks indicate buying pressure at this zone.
The green arrows show successful support bounces, hinting at bullish intent.
2. Trendline Analysis:
Price bounced near the lower boundary of the falling wedge/downtrend channel.
An uptrend line convergence supports potential reversal.
A breakout above the short-term descending trendline is indicated.
3. EMA & Target Projection:
EMA 200 at 3,364.33 may act as dynamic resistance, the next short-term hurdle.
Target zone projected at 3,384.04, offering a potential move of +65.67 pts (~1.98%).
4. RSI Indicator:
RSI(14) is oversold (~29.93), signaling a potential reversal.
A bullish crossover may be forming, supporting upward momentum.
---
Trading Plan:
Entry Zone: Near current support area around 3,325
Target: 3,384
Stop Loss (Suggested): Below 3,300, under support structure
Risk/Reward: Favorable based on support hold and breakout projection
Mr SMC Trading point
---
Conclusion:
This setup suggests a short-term bullish reversal from a key support area, with confirmation likely if price breaks above the descending trendline and clears the 200 EMA.
Please support boost 🚀 this analysis)

XAUUSD: Post-Crash Buy Zone and Bullish SetupHere's a structured breakdown of today's #XAUUSD (Gold) trading idea, including key levels, wave structure, and risk/reward zones for both short-term and swing traders.
---
🔹 Key Technical Zones (H1 & H4 Charts)
Support Levels
- 3,303 USD – Key support on H4; potential false breakout area
- 3,324–3,327 USD – Wave 5 completion zone and high-probability buy area
- 3,337–3,343 USD – Entry zone for early bullish setups
- 3,340–3,345 USD – Clean long entry; targeting up to 3,450 USD
Resistance Levels
- 3,363–3,365 USD – Sell zone tied to wave 4/5 overlap
- 3,375–3,383 USD – Mid-range resistance; key for short-term profits
- 3,405–3,500 USD – Long-term bullish targets; includes ATH region
---
🔹 Wave Count (H1 Structure)
- Wave X – Recent sell-off ended a potential uptrend; suggests ongoing correction (WXY)
- Wave Y – 5-wave drop toward 3,363–3,365 USD; acting as a short-term sell zone
- Wave Z – Expected final leg down toward 3,324–3,327 USD (ideal buy zone)
- Retracement Setup – Anticipated bullish retrace post-wave 5, with targets back at 3,363–3,376 USD
---
🔹 Order Blocks & FVGs
Buy Zones
- 3,343–3,330 USD – FVG within an order block; strong bullish entry area
- 3,319–3,317 USD – Deep support with short-term target at 3,349 USD
Sell Zone
- 3,363–3,365 USD – Key area for short setups, with targets at 3,342–3,330 USD
---
🔹 Strategy & Key Takeaways
1. Bullish Structure Still Intact
- Rising channel remains valid on H4
- Holding 3,303 USD is critical for confirming bullish continuation
2. Trade Setup
- Long entries near 3,340–3,345 USD
- Target range: 3,450 USD and above
- Tight stops around 3,325 USD recommended for low-risk exposure
3. Wave Completion Zones in Play
- Monitor 3,324–3,327 USD (buy zone) and 3,363–3,365 USD (sell zone) for end-of-wave activity
4. Risk Management Is Key
- Scale into positions
- Respect intraday volatility and breakout traps

War breaks out again? The latest analysis and layout of gold📰 Impact of news:
1. The ceasefire agreement reached earlier did not take effect, and Trump believed that both sides violated the agreement
2. Federal Reserve Chairman Powell delivered a speech 3 hours later
📈 Market analysis:
At the 4H level: the Bollinger Band opening is enlarged, the MACD indicator double-line death cross is downward, the short-selling force is strengthened, but the RSI indicator rebounds after being oversold. Overall, there are obvious signs of a rebound in gold prices. At the hourly level: the gold price is in a downward channel, the Bollinger Bands are expanding, the MACD indicator is dead cross and the red bars are converging, and the short momentum has weakened. The RSI indicator rebounds from oversold, and the demand for spot gold rebounds is obvious. Therefore, we still hold long orders near 3320 in the short term. Short-term operation suggestion: go long when it stabilizes at 3325-3315, pay attention to the resistance range of 3370-3380 on the upside, and consider shorting when encountering resistance and pressure.
🏅 Trading strategies:
BUY 3325-3315
TP 3335-3345-3365
SELL 3370-3380
TP 3340-3330
If you agree with this view, or have a better idea, please leave a message in the comment area. I look forward to hearing different voices.
OANDA:XAUUSD FX:XAUUSD FOREXCOM:XAUUSD FXOPEN:XAUUSD TVC:GOLD

Gold continues to decline, can it still change the trend?Information summary:
Will the Fed cut interest rates in July? The latest statements of Fed officials have released a heavy signal. Fed Governor Michelle Bowman said that as long as inflationary pressures remain moderate, she will support a rate cut at the next policy meeting in July. At the same time, Trump has continued to put pressure on the Fed.
Next, investors need to pay attention to the testimony of Fed Chairman Powell on the semi-annual monetary policy report to the House Financial Services Committee today.
Market analysis:
Gold fell sharply today, directly breaking the key support level of 3350. From a 4-hour perspective, the MA moving average shows a short trend arrangement, and the MA5\10 moving average crosses the MA20/30 long-term moving average downward, which indicates that the short force is dominant. In addition, the RSI indicator also fell rapidly and entered the oversold area, but this may also suggest that prices have a rebound trend in the short term.
I think the current market price decline trend is more obvious, unless there is significant positive data, the gold price may continue to decline.

Weakness continues, continue to short the bear market📰 Impact of news:
1. Pay attention to Powell's speech in New York
2. Pay attention to geopolitical influence
📈 Market analysis:
Gold opened lower and showed a weak situation. The 1H moving average was arranged downward. In the short term, bears still occupied the main trend. From the 4-hour analysis of gold, the bulls still had repeated resistance before breaking down. Once it breaks down, the market will go further bearish. Pay attention to 3330 below. 3400 is still the key above in the short term. Only by breaking through the bulls can the rebound continue. In terms of operation, high-altitude and low-long are temporarily maintained. Pay attention to the short-term resistance of 3355-3365 above, and the support of 3340-3330 below. Pay attention to the breakthrough! Pay attention to Powell's speech in the New York session.
🏅 Trading strategies:
SELL 3370-3365-3355
TP 3340-3330
BUY 3340-3335-3320
TP 3345-3355-3365
If you agree with this view, or have a better idea, please leave a message in the comment area. I look forward to hearing different voices.
TVC:GOLD FXOPEN:XAUUSD FOREXCOM:XAUUSD FX:XAUUSD OANDA:XAUUSD

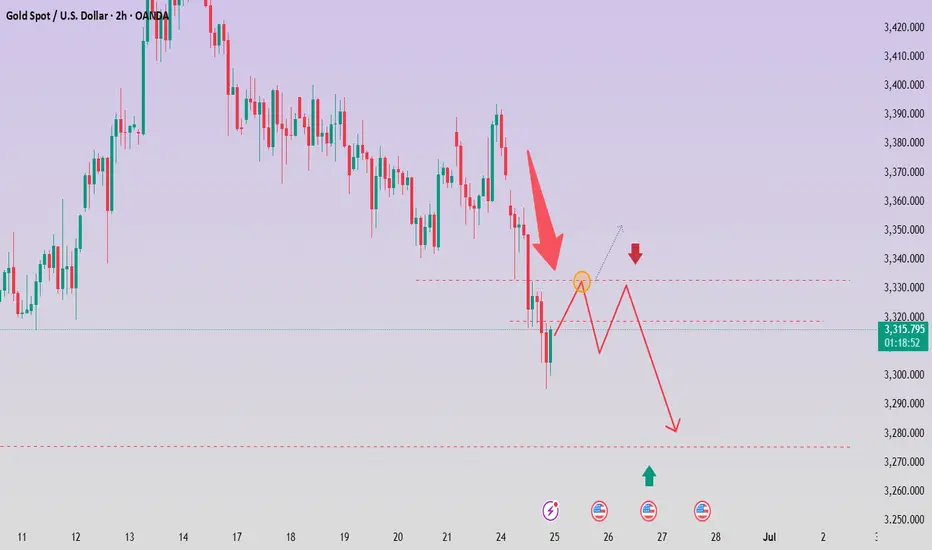
Bearish Continuation Pattern Detected on GOLD/USD Bearish Continuation Pattern Detected on GOLD/USD 📉
📊 Chart Analysis Summary:
The GOLD/USD chart shows a clear bearish continuation pattern, following a rejection from a major resistance zone.
🔍 Key Technical Highlights:
🔺 Resistance Zone:
Strong resistance at 3,420 – 3,440 USD, marked by multiple rejections (🔴 red arrows).
Price formed a Bearish Harmonic Pattern (likely a Gartley or Bat), suggesting reversal from this resistance.
🔻 Bearish Momentum:
After the pattern completed, price broke below the minor support structure and is currently forming lower highs and lower lows, indicating bearish structure.
📉 Support Level:
Strong horizontal support zone around 3,298 – 3,300 USD, marked as “TARGET.”
This area was previously tested (🟠 orange circles) and now projected to act as a target level again.
🔄 Minor Retracement Zone:
Expecting a minor pullback to 3,347 USD (purple line) before potential continuation downward.
This zone aligns with the previous support turned resistance (classic SR flip).
🎯 Target Projection:
Based on the bearish impulse and measured move, the projected target is around 3,298.758 USD, which coincides with the previous support zone.
📌 Conclusion:
The price action suggests a high-probability bearish continuation, targeting the 3,298 USD zone unless the price breaks and holds above 3,347 USD. Traders may consider selling on rallies with a confirmation of rejection at resistance.
📉 Bias: Bearish
📍 Invalidation: Break and daily close above 3,347 USD
📉
📊 Chart Analysis Summary:
The GOLD/USD chart shows a clear bearish continuation pattern, following a rejection from a major resistance zone.
🔍 Key Technical Highlights:
🔺 Resistance Zone:
Strong resistance at 3,420 – 3,440 USD, marked by multiple rejections (🔴 red arrows).
Price formed a Bearish Harmonic Pattern (likely a Gartley or Bat), suggesting reversal from this resistance.
🔻 Bearish Momentum:
After the pattern completed, price broke below the minor support structure and is currently forming lower highs and lower lows, indicating bearish structure.
📉 Support Level:
Strong horizontal support zone around 3,298 – 3,300 USD, marked as “TARGET.”
This area was previously tested (🟠 orange circles) and now projected to act as a target level again.
🔄 Minor Retracement Zone:
Expecting a minor pullback to 3,347 USD (purple line) before potential continuation downward.
This zone aligns with the previous support turned resistance (classic SR flip).
🎯 Target Projection:
Based on the bearish impulse and measured move, the projected target is around 3,298.758 USD, which coincides with the previous support zone.
📌 Conclusion:
The price action suggests a high-probability bearish continuation, targeting the 3,298 USD zone unless the price breaks and holds above 3,347 USD. Traders may consider selling on rallies with a confirmation of rejection at resistance.
📉 Bias: Bearish
📍 Invalidation: Break and daily close above 3,347 USD

GOLD Intraday Chart Update For 24 June 2025Hello Traders, As you can see that GOLD fell sharply this morning due to Israel- Iran Cease fire scenario
Further more FED Chair POWELL Testifies Starts from Today and end on Tomorrow make sure to manage you trading accordingly
Right now GOLD is in Strong Bearish Trend only clear Breakout of 3368 level for the day below this market remains Bearish
All eyes on 3300 Psychological Digit for now if market breaks 3300 Successfully then it will move towards 3250 soon
Disclaimer: Forex is Risky

Gold, Will USA-Iran-Israel conflict affect it? The USA-Iran-Israel conflict can significantly impact gold prices. Gold is a safe-haven asset, so demand often rises during geopolitical tensions, pushing prices up
3406 gonna be first target for me, if it breaks this lvl with huge volume and FVG on 1h+ then most likely we will see ATH in near future
bearish scenario(lest likely) - price breaks down 3340 and close with nice volume and fvg on 1h+ which will open move all the way down to MO
