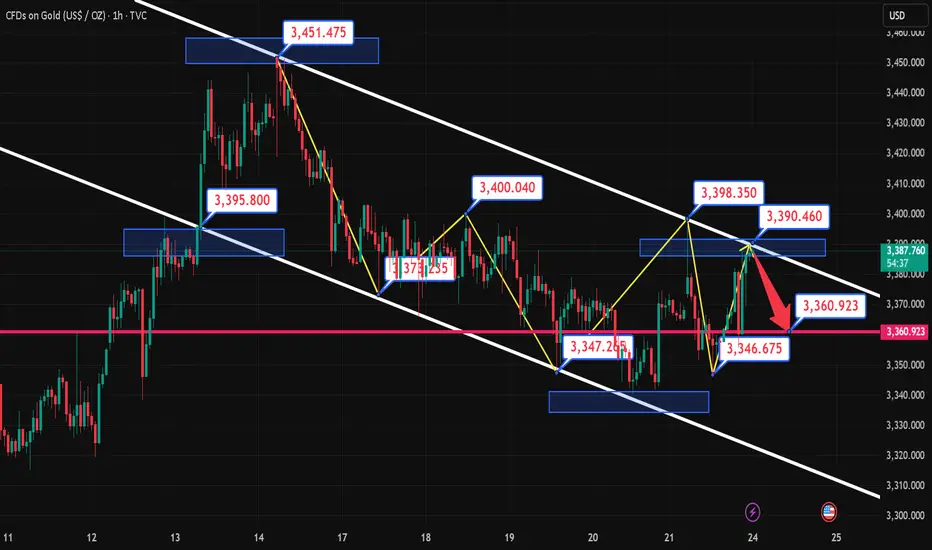
Gold Price Analysis June 24Quite a surprise with a price gap down at the beginning of the day. A sweep to 3333 and a recovery to increase again in the Tokyo trading session.
This recovery to increase completely breaks the market's bullish wave structure.
3363 and 3335 are being watched in the Asian and European trading sessions today. This zone can be traded short-term in the sideways range. The SELL zone pays attention to the opening gap at 3368.
The upper range has some adjustments compared to yesterday in the direction of decreasing prices, so the SELL range 3386 and 3410 is being watched for trading. Support is still held as yesterday at the 3322 and 3296 zones.
Goldprediction

6.24 Gold safe haven fades and gold falls
Technical aspect: After the gold price hit the 3400 integer mark overnight, it fell rapidly under the impetus of negative news. The overall fluctuation range is still within the 3330-3400 range we expected. This shows that the current market dominated by news lacks continuity. We make a golden section of the high and low points of the overnight decline to the current level, and the current position of 0.618 is 3370.
Pressure level: 3370\3375\3400
Support level: 3330\3300

Israel and Iran have a truce. Gold fluctuates sharply.Information summary:
Trump said on Truth Social that Israel and Iran have fully agreed and there will be a complete and thorough ceasefire. (About 6 hours from now, when Israel and Iran have finished and completed the last mission they are doing!).
After 12 hours, the war will be considered over. Iran will start a ceasefire first, and after the 12th hour, Israel will start a ceasefire, and 24 hours later, the world will salute the official end of this 12-day war.
Senior Iranian officials have confirmed that Tehran has agreed to a US-proposed ceasefire with Israel brokered by Qatar.
Market analysis:
From the current point of view of gold, the news market has been digested in the early Asian market, and gold has also fallen to around 3330. Now it is obvious that there may be a bottoming rebound.
But from the trend point of view, gold is still in the short position, and 3380 and 3400 have not been stabilized.
Judging from the current hourly chart, gold is likely to rebound to 3370-3380. Then it will quickly fall from this position to the early trading low of 3330. At the same time, we can also see that the trend near 3378 is at the Fibonacci 0.382 position. Moreover, the previous trend also rebounded from 3330 to 3380, and then fell back again.
So we need to be patient and wait for the price to rebound before going short. Of course, we can also choose an aggressive long strategy. Of course, we can also choose an aggressive long strategy.
Operation strategy:
Short near 3380, stop loss 3390, profit range 3350-3330.
Long near 3345, stop loss 3335, profit range 3370-3380.

XAUU-USD chart it will go back upwardXAUUSD Buy Setup Active 🟢💰
Gold is holding strong above key support – currently trading at 3355. We’ve entered a Buy position expecting continued bullish momentum in the market.
📍 Entry: 3355
🎯 Targets: 3420 – 3450 – Final Target 3400
🛑 Stop Loss: 3325 (below recent structure low)
With global uncertainty and technical strength aligning, this move could push gold higher in the coming sessions.
Stay alert, manage risk, and follow the trend until reversal confirmation. 🧭📈
#XAUUSD #GoldTrade #ForexTrading #BuySetup #TradingViewAnalysis #MarketUpdate

Gold Trading Strategy June 23The last two D1 candles have continuously drawn out the wicks. The Sellers may no longer be interested in dominating the market.
Currently, Gold is moving sideways in a wide range. 3345 and 3375 are the two Breakout zones of the gold price in today's trading day. When breaking out of the breakout zone, the price will continue its strong trend. Limit trading against the trend when the price breaks out.
Trading signals may also appear if there is confirmation from the candle that does not break out of this breakout zone.
Resistance and support zones remain the same as last week.
Resistance 3400-3415-3443
Support 3322-3296
Break out: 3375-3345
Recommended good trading signals
SELL 3399-3401 Stoploss 3405
BUY 3322-3320 Stoploss 3306

USDJPY Trading StrategyUSDJPY is looking to break the resistance zone of 147,000. The current bullish force of USDJPY is too strong, so jumping in to catch the top at the present time will be quite risky. If you want a SELL signal, you must wait for the confirmation of the sellers jumping into the market by the confirmation of the red closing m30 candle.
There will be a beautiful SELL signal if the h4 candle shrinks its wick below 147,000. If it closes above the SELL point, you must wait for 148,100, or if you want to BUY, wait for the retest and create a beautiful bullish wave in the small time frame.
On the other hand, if the currency pair declines back to the support zone of 146,000 and 145,200, it will give us a long-term BUY signal.
Support 146,000-145,200
Resistance 117,100-148,100

Gold price analysis June 23The last two D1 candles have continuously withdrawn their wicks. The Sellers may no longer be interested in dominating the market.
Currently, Gold is moving sideways in a wide range. 3345 and 3375 are the two Breakout zones of the gold price in today's trading day. When breaking out of the breakout zone, the price will continue its strong trend. Limit trading against the trend when the price breaks out.
Trading signals may also appear if there is confirmation from the candle that does not break out of this breakout zone.
The resistance and support zones remain the same as last week. The upper limit is at 3400 and 3415. The lower limit is still at 3322 and 3296

GOLD- at CUT n REVERSE Region? What's next??#GOLD - perfect drop after Iran Israel casefire and now market just reached at his current ultimate swing region.
That is around 3343 to 3346-47
Keep close that region and only hold buying positions above tha.
NOTE: we will go for cut n reverse belowt that in confirmation .
Good luck
Trade wisely

Gold bottoms out and tests resistance, long positions at night📰 Impact of news:
1. Bowman hinted at a July rate cut
2. Fed Governor Kugler and FOMC permanent voting member and New York Fed President Williams hosted the "Fed Listening" event.
📈 Market analysis:
Gold will maintain a short-term volatile trend. Although the United States intervenes in the conflict between Iran and Israel, the geopolitical situation will affect the market trend to a certain extent. However, the remarks of Federal Reserve Board member Bowman hinting at a rate cut in July have eased market volatility to a certain extent. Gold maintains a narrow range of fluctuations at the 4H level, and the technical pattern is gradually adjusted. The K-line stands firmly on the short-term moving average. The short-term trend shows that it is necessary to observe the second opportunity for pull-up after the confirmation of the retracement. At the hourly level, the short-term moving average diverges upward, and the short-term volatile and strong pattern is maintained. In the evening, pay attention to the upper resistance area of 3395-3405, focus on the suppression of the 3405 line, pay attention to 3375-3365 below, and further pay attention to the 3345 support line if it breaks through.
🏅 Trading strategies:
SELL 3385-3395-3405
TP 3370-3365-3345
BUY 3375-3365-3355
TP 3390-3400-3405
If you agree with this view, or have a better idea, please leave a message in the comment area. I look forward to hearing different voices.
TVC:GOLD FXOPEN:XAUUSD FOREXCOM:XAUUSD FX:XAUUSD OANDA:XAUUSD

XAU/USD Double Bottom Breakout Bullish Momentum Incoming!XAU/USD Double Bottom Breakout 💥 | 🚀 Bullish Momentum Incoming!
Analysis:
🟡 Double Bottom Pattern: Two clear lows have formed around the $3,340 support, signaling a potential reversal.
🟦 Accumulation Zone: The price consolidated in a range, indicating strong buying interest before the breakout.
🟣 Bullish Momentum: Recent aggressive bullish candles show strong buying pressure.
📈 Breakout & Retest Zone: If the price holds above $3,370, a bullish continuation toward $3,409 and possibly $3,445 is expected.
🧭 Target Area: Marked with a blue box, the upside potential is clearly projected.
Conclusion:
A successful retest of the breakout level may lead to a strong bullish run. Keep an eye on $3,370 as the pivot zone. 🎯

Conflict breaks out, risk aversion rises, can 3400 be broken?Bowman's dovish comments in the afternoon eased the market, by which time risk aversion was deepening as sudden geopolitical conflicts continued to deepen. Will the USA make a corresponding response to this matter? This series of events has once again put gold into a complicated situation. Can gold hit the 3,400 mark today?
Free trading strategies are updated daily🌐. All trading strategies released since this month have been verified and can serve as a good reference📈.👇 I sincerely hope that these strategies can be helpful to you👇.
OANDA:XAUUSD FX:XAUUSD FOREXCOM:XAUUSD FXOPEN:XAUUSD TVC:GOLD

Gold Market Analysis: Key Levels and Trends 23/June/2025 Core Themes
1. Geopolitical Drivers: Escalating tensions in the Middle East, particularly U.S. airstrikes on Iranian nuclear facilities, are fueling gold's "flight to safety" narrative. Analysts anticipate sustained demand for gold amid potential regional conflict.
2. Technical Bullish Bias: Gold is in an uptrend, respecting key support levels and forming higher lows within an ascending channel. Breakouts above resistance (e.g., $3,439–$3,501) could validate further gains.
3. Correction vs. Continuation: While short-term pullbacks are expected (e.g., testing $3,320–$3,200), the broader bullish structure suggests corrections are temporary.
---
Key Technical Levels
Support:
- Immediate: $3,320 (lower channel boundary)
- Deeper: $3,200 (critical level; break could extend corrections)
Resistance:
- Short-term: $3,378–$3,382 (upper channel boundary)
- Mid-term: $3,439 (previous resistance; target for bullish continuation)
- Long-term: $3,501 (potential next resistance; requires strong momentum)
Fibonacci Retracements:
- 23.6%: $3,360–$3,370 (support zone for long entries)
- 50.0%: $3,400 (conservative take-profit target)
- 61.8%: $3,415 (key golden ratio level; likely Wave (5) peak)
- 100%: $3,435–$3,440 (aggressive target; upper channel line)
---
Trade Setups & Strategies
1. Long Entry:
- Target: $3,400–$3,435 (Fibonacci extensions)
- Stop-Loss: Below $3,315 (break of key support)
- Entry Zone: $3,360–$3,370 (near ascending channel support and 23.6% Fib)
2. Bullish Confirmation:
- Breakout Above $3,378: Validates continuation toward $3,439 and $3,501.
- Volume Increase: Confirms strength at key levels (e.g., $3,360–$3,370).
---
Risk Management & Key Risks
- Stop-Loss Placement:
- Longs: Below $3,315 (protects against deeper corrections).
- Shorts: Above $3,350 (avoids false breakouts).
- Volatility: Monitor geopolitical developments (e.g., U.S.-Iran escalation) that could trigger rapid price swings.
- Correction Risks: If gold fails to hold $3,320, a drop to $3,200 may occur, requiring tighter stops.
---
Fundamental Outlook
- Safe-Haven Demand: Rising tensions are likely to sustain gold's appeal.
- Inflation & Rate Outlook: Persistent inflation concerns and potential rate cuts (if economic data weakens) could further support gold.
- Negotiation Risk: De-escalation or Iran's concessions may pause the bullish momentum, leading to a reversal toward $3,340–$3,320.
---
Conclusion
Gold is in a strong bullish phase, driven by geopolitical risks and technical structure. Traders should focus on buying dips near $3,320–$3,370 with targets toward $3,439–$3,501. However, monitor the $3,320 support and geopolitical developments closely. If the trend breaks, a retest of $3,200 could follow. Always use stop-losses to manage risk.
Final Note: The market is highly volatile, so position sizing and risk management are critical. Stay alert for news updates and technical confirmations (e.g., closes above $3,378)

GOLD ROUTE MAP UPDATEHey Everyone,
Great start to the week with our new 1H chart playing out to perfection!!!
We started with a gap on market open clearing our Bullish target. We then got our bearish target at 3348, followed with no ema5 cross and lock confirming the rejection into our bullish target 3376.
We now have ema5 cross and lock above 3376 opening 3395.
We will see levels tested side by side until one of the weighted levels break and lock to confirm direction for the next range.
We will keep the above in mind when taking buys from dips. Our updated levels and weighted levels will allow us to track the movement down and then catch bounces up.
We will continue to buy dips using our support levels taking 20 to 40 pips. As stated before each of our level structures give 20 to 40 pip bounces, which is enough for a nice entry and exit. If you back test the levels we shared every week for the past 24 months, you can see how effectively they were used to trade with or against short/mid term swings and trends.
The swing range give bigger bounces then our weighted levels that's the difference between weighted levels and swing ranges.
BULLISH TARGET
3376 - DONE
EMA5 CROSS AND LOCK ABOVE 3376 WILL OPEN THE FOLLOWING BULLISH TARGETS
3395
EMA5 CROSS AND LOCK ABOVE 3395 WILL OPEN THE FOLLOWING BULLISH TARGET
3419
EMA5 CROSS AND LOCK ABOVE 3419 WILL OPEN THE FOLLOWING BULLISH TARGET
3440
BEARISH TARGETS
3348 - DONE
EMA5 CROSS AND LOCK BELOW 3348 WILL OPEN THE SWING RANGE
3330
3306
EMA5 CROSS AND LOCK BELOW 3306 WILL OPEN THE SECONDARY SWING RANGE
3288
3271
As always, we will keep you all updated with regular updates throughout the week and how we manage the active ideas and setups. Thank you all for your likes, comments and follows, we really appreciate it!
Mr Gold
GoldViewFX

XAUUSD Analysis todayHello traders, this is a complete multiple timeframe analysis of this pair. We see could find significant trading opportunities as per analysis upon price action confirmation we may take this trade. Smash the like button if you find value in this analysis and drop a comment if you have any questions or let me know which pair to cover in my next analysis.

Gold is moving upward. Testing the ultimate pressure.Gold opened high at around 3397 and then quickly retreated. After hitting the lowest point of around 3346 in the European session, it continued to rebound. It fluctuated in a large range around 3360-80 many times, which also added a lot of confusion to the market.
After retreating to around 3355 again, it continued to move upward, reaching a high of around 3389. At present, the market still has upward momentum, and the key pressure above is maintained at 3400, which is also the previous high point and the last line of defense for the bears. If this position continues to be broken, the bulls may continue to move upward without resistance in the later period, with the target price around 3430-3450. The key support below is still maintained in the range of 3355-3340.
Judging from the current market, the short-term fluctuations may continue to expand, and the ultimate target above is maintained at around 3400. This position is likely to be broken, but the probability of continuing to rise is small. The current bulls may still be in a form of enticing more.
Operation strategy:
Short near 3395, stop loss 3410, profit near 3375.
If it continues to break below 3370, it will be seen around 3340. If it breaks through the extreme pressure level of 3400, we need to consider stopping the loss in time. .

6.24 Gold resistance strengthens + kinetic energy exhaustionGold prices have fallen under pressure near $3,380 several times, and this area gathers three technical resistances:
1. The daily Bollinger band middle track 3,375 and the upper track 3,450 form a suppression.
2. The previous high of $3,400 plus the Fibonacci 38.2% retracement level constitutes a concentrated selling pressure area.
3. The previous high of $3,451 failed to break through effectively, forming a bearish structure with the second highest point moving down.
Risk of breaking the shock range: Gold continues to trade sideways in the 3,300-3,450 range, but the K-line continues to close in a small real body alternating yin and yang pattern, indicating that the long and short momentum is exhausted. If it falls below 3,350 , a technical sell-off will be triggered, with the target pointing to 3,300-3,330!
SELL: 3,388\3,393 Stop loss: 3,398
Target: 3,360
Profit point: 30
GBPUSD Trading Strategy for the WeekGBPUSD is reacting at the support zone of 1.34000. This is the last important support zone that the pair is facing. If this support zone is broken, the pair will enter a prolonged Downtrend phase. 1.325 could be the target for this decline.
If the 1.34000 zone is pushed up by buyers, the pair will touch the 1.35000 border zone. If this zone is broken, the pair will form a double bottom pattern and continue to increase back to the peak of last week around 1.36000. In case the buying force is not strong enough to break 1.35000, the pair will return to the sideway in the rectangular border.
Support: 1.32500
Resistance: 1.36000
Break out: 1.34000-1.35000
Recommended good trading strategy:
Trade when price confirms in Break out zone.
BUY 1.32600-1.32400 Stoploss 1.32000
SELL 1.35900-1.36100 Stoploss 1.36400

6.23 Gold Short-term Technical AnalysisStimulated by geopolitical conflicts such as the US airstrike on Iran's nuclear facilities on Monday, gold opened $24 higher at 3398 in the early trading. However, it failed to continue the upward trend and quickly fell back to the 3360-65 area. Retrieve all the gains!
Technical analysis: 4-hour head and shoulders top pattern: right shoulder 3373 neckline 3340 MACD dead cross diverges downward Bollinger band opening expansion and price running near the lower track, short-term trend is bearish, and the daily line is still in the rising channel!
Short-term operation:
SELL: 3375\3385 Stop loss: 3390
$1:3360 $2:3340
BUY: 3338\3345 Stop loss: 3353
$1:3380 $2:3400
Operation suggestion: High-altitude is the main, low-multiple is the radiation

Gold XAU/USD Bullish Reversal Setup – Targeting $3,454.65Price: $3,384.41
Strategy: Buy/Long
🟦 Key Levels:
Entry Zone: Around $3,345.76
This level aligns with a previously tested support zone marked in purple.
Stop Loss: $3,331.56
Below the support zone, providing downside protection if the setup fails.
Target (TP): $3,454.65
Marked as EA TARGET POINT, suggesting a potential upside of 3.16% (~$105.83 gain).
📊 Technical Indicators:
Moving Averages:
200 EMA (blue): Near the entry level, adds strength to the support zone.
50 EMA (red): Recently crossed below price, indicating early bullish momentum.
Price Action:
Sharp bounce from support suggests buying interest.
Potential inverse head and shoulders pattern forming, which is a bullish reversal pattern.
🧠 Trade Idea:
Buy near $3,345.76,
Stop Loss at $3,331.56,
Take Profit at $3,454.65
Risk/Reward Ratio ≈ 1:3.3 — favorable setup for long positions.

6.23 Gold Short-term Technical GuidanceThe current price is in the double-line interval of 3350-3375 on the hourly chart. Please note that the four-hour lifeline 3368 is also the resistance point determined by the last rebound in the Asian session.
The Asian session fell under pressure and returned to the sweeping range. It was treated as a sweep. The European session was able to hold the 3350 mark. Look up to find the 3368 area, followed by 3375 and 3385-3388.
If the European session falls below and closes below 3350, the short-selling forces are dominant. The four-hour lifeline 3368 is used as suppression. Look down to find 3333-3331, followed by 3320-3315

Short gold, gold still has at least one chance to pullback!At present, gold has rebounded to the 3370-3380 area again, which largely confirms that 3350-3340 is the bottom area at this stage. However, what we still cannot underestimate is that even with the support of safe-haven, gold has still failed to effectively break through the resistance of 3385-3395-3405 area, and even fell under pressure several times. To a certain extent, it weakened the willingness and confidence of bulls, so it aggravated the trend of wide fluctuations in the short term. During this period, we must pay attention to the rhythm change of gold.
According to the current bullish strength of gold, I think gold does not have the conditions to directly break through the heavy resistance of 3385-3395-3405 area for the time being, so gold still needs at least one retracement expectation, so I think we can still try to short gold in the 3375-3385 area, but the retracement expectation should not be too large, 3365-3355 is enough!

Gold opens high and moves lower, focus on 3340 support📰 Impact of news:
1. Federal Reserve Board member Bowman speaks on monetary policy and the banking industry
2. The United States intervenes in the Iran-Israel conflict and pays attention to the geopolitical situation
📈 Market analysis:
In the early Asian session, gold prices surged but failed to break through the key watershed of 3405. The current risk aversion conflict failed to break through the key resistance level, so the short-term trend is still weak and bearish. On the hourly chart, gold continues to retreat. As the current short-selling momentum continues to gain momentum, we will first look at whether the double bottom support of 3340 is effective. If it fails to break through while retreating, we can consider a short-term upward rebound in the support and consider going long. Looking at the second decline point at 3370-3375, unless the news stimulates the gold trend, you can still consider placing short orders if it touches the 3370-3380 line! On the whole, pay attention to the resistance line of 3370-3380 above and the support line of 3345-3335 below.
🏅 Trading strategies:
BUY 3350-3345-3335
TP 3360-3370-3380
SELL 3370-3380
TP 3360-3350-3345
If you agree with this view, or have a better idea, please leave a message in the comment area. I look forward to hearing different voices.
OANDA:XAUUSD FX:XAUUSD FOREXCOM:XAUUSD FXOPEN:XAUUSD TVC:GOLD

Trade Idea: Long XAUUSD (BUY STOP)1️⃣ Multi-Timeframe Structure
• 1 Hour (Macro):
• Trend: Bullish. 20 SMA is riding above the 50 SMA .
• Price has broken above the prior resistance at 3374.50 and is now retesting it as support.
• 15 Minute (Tactical):
• After a clear push down into 3340.37, price rallied back above 3374.50.
• SMAs have flipped back bullish, and volume during the retest shows absorption of selling pressure.
• 3 Minute (Entry Precision):
• Micro-green candle wicks show a small scratch of buyers stepping in just above 3374.50.
• Momentum is picking up to the upside, but we want confirmation of strength before committing.
⸻
2️⃣ Trade Execution
▶️ Entry: Buy Stop at 3379.50
• Wait for a clean 3 m/15 m push above the short-term swing high (~3379) to confirm buyers are in control.
✂️ Stop Loss: 3374.50
• Just below the broken resistance-turned-support level.
• True structural invalidation of this bullish thesis.
🎯 Take Profit: 3394.50
• Targets the next logical resistance cluster (round number area and prior swing highs) for ~15 pt gain.
Risk-Reward ≈ 1:3 (SL = 5 pts, TP = 15 pts)
⸻
3️⃣ Invalidation & Expiry
❌ Cancel the pending Buy Stop at 3379.50 if either:
1. A full 15 m candle closes below 3374.50 before entry.
2. It’s not triggered by 8:30 AM PST.
