The best ambush point for short positions below gold 3400.The daily structure of gold still maintains a bullish dominant pattern. The upper target is the upper Bollinger band of 3400. If it breaks through this position, the upside space will be further opened up. The 4-hour Bollinger band is gradually closing, and the price is fluctuating in the range of 3400-3360. In the short term, it is still treated with range thinking. Before an effective breakthrough, the operation can adopt a high-altitude and low-long strategy. Gold is currently at a critical node of change. If it rises and falls in the evening, it may release a temporary peak signal. The area below 3400 is expected to become an opportunity for the layout of medium-term short positions. The overall recommendation is to remain cautious, respond flexibly to changes in rhythm, and strictly control risks.
Gold operation suggestion: You can continue to try short selling in the 3390-3400 range, with the target at 3380-3370.
Goldprediction

Gold Holds Firm. Continues to Set New Highs?After four consecutive days of gains, gold continued its volatile upward trend on Thursday, reaching a new high for August. This performance suggests a relatively strong, volatile upward trend in the short term. The moving average system is currently extending upward, providing some support for the rise.
In the short term, focus on the support strength near 3380 on the MA5 moving average, which is a key indicator of the short-term trend. If this support level is broken, continue to monitor support near 3370 and 3365. 3370 marked the low point of Thursday's rapid decline in the European session, while 3365 marked the lowest point reached on Thursday.
It is worth noting that gold has maintained an overall volatile upward trend this week, with prices continuously reaching new highs. Therefore, as long as the price remains above yesterday's low, Quaid believes the market will continue to fluctuate upward. On the upside, we need to pay attention to the resistance near 3400-3410. The price has tried to break through many times, but has failed to stabilize above the integer mark of 3400. If it fails to break through strongly, the price will most likely make a correction and try to break through again after accumulating upward momentum.
Trading Strategy:
Short around 3405, stop loss at 3415, profit range 3380-3365
Long around 3365, stop loss at 3355, profit range 3380-3400

Correction starts waiting for lower level to BUY✏️ CRYPTO:BTCUSD has broken the accumulation zone and established a corrective wave. With the main resistance zone being the lower boundary of the accumulation pattern 115600. In the larger timeframes, the BTC trend still has a strong bullish wave in the coming time. Therefore, these recovery waves are considered good opportunities to buy.
📉 Key Levels
BUY zone 110000
BUY Trigger Break and trading above 115600
Leave your comments on the idea. I am happy to read your views.

GBPUSD extends to the downside. Wait for retest to sell✏️ OANDA:GBPUSD confirms the downtrend by breaking the trendline. The downtrend is still extending to lower areas because the GBPUSD bearish wave structure is very beautiful. Some selling momentum appears around the breakout zone of 1.339, which will form a bearish structure towards the support of 1.287 in the near future. Putting faith in the trendline at the moment is reliable.
📉 Key Levels
SELL zone 1.339-1.341
SELL DCA trigger: Break and trading bellow 1.317
Target 1.287
Leave your comments on the idea. I am happy to read your views.

Buy gold near 3381, target 3399-3438Gold Market Analysis:
Gold's daily chart shows, as we previously discussed, a period of significant volatility within a high range. The previous non-farm payroll data and a series of other data points haven't triggered a major rally in gold. This period of volatility on the daily and weekly charts has lasted for four months. Gold needs a breakout in the future. Whether it breaks above or below, it will likely trigger a massive unilateral move. New traders fear unilateral moves, while experienced traders fear volatile trading. Large unilateral moves will likely take advantage of new traders, so it's crucial to establish stop-loss orders on each trade. In the short term, gold is currently rising in a wave structure. Yesterday, the US market reached 3408. The 3438 to 3450 range on the analysis chart is a barrier. Selling will require a major rebound here. I predict several more upward rallies today, so the short-term strategy for today is to buy low. The 4H chart of gold clearly shows a major upward and downward movement. Therefore, if it approaches the resistance range again, there's a possibility of a dip or reversal. The 1H chart reached 3370. If this level isn't broken today, we'll continue to buy. If it does, we'll adjust our strategy. We already bought at 3383 in the Asian session. Be mindful of volatile markets; wait and see, not rush into them. Gold trading in the Asian session between 3383 and 8370 presents buying opportunities.
Support is at 3383-3380, with strong support at 3370. Resistance lies at 3408 and 3438, with 3383 being the dividing line between strength and weakness.
Fundamental Analysis:
The tariff war has been the most significant fundamental factor impacting gold recently, but it will support it in the long term. This surge in gold prices is driven by Trump's renewed efforts, and the Federal Reserve's future monetary policy remains a key focus.
Trading Strategy:
Buy gold near 3381, target 3399-3438

Gold continues to rise! Gold prices hit a two-week high!Market News:
In early Asian trading on Friday (August 8), London gold prices surged to $3,408, reaching a more than two-week high since July 23. Intensified global trade tensions and growing expectations of a September Federal Reserve rate cut have fueled risk aversion and demand for precious metals, providing strong support for spot gold. Geopolitical uncertainty has also fueled the rise in international gold prices. This recent rally in gold was primarily driven by Trump's renewed tariff campaign. Trump has officially imposed tariffs on goods from nearly 200 countries, with rates ranging from 10% to 50%. Meanwhile, signs of a slowing US economy are reinforcing market expectations of a shift to easing policy by the Federal Reserve. Gold's role as a safe-haven and inflation-fighting asset has been further strengthened. While there may be short-term technical correction risks, the overall market remains strong. Looking ahead, three major catalysts require close attention: potential fluctuations in policy expectations triggered by the Federal Reserve Chairperson's nomination hearing on August 21st, the specific implementation of retaliatory tariffs against the US by India and other countries, and potential energy market volatility following the Putin-Trump summit. Until these variables become clear, gold's price fluctuations around the $3,400 mark may become the new normal, but each pullback is likely to attract more safe-haven funds.
Technical Analysis:
Gold's technical outlook suggests a continued trend-buying structure, with the price fluctuating upward to reach a new monthly high of $3,409. The daily chart closed with a bullish cannonball pattern of two positives and one negative, maintaining a strong buy structure on both the daily and weekly charts. The RSI indicator is pointing upward above its mid-axis, while the 10-day and 7-day moving averages are opening upward, with the price converging within the upper middle Bollinger Bands. The Bollinger Bands on the short-term hourly and four-hour charts are also opening upward, with the price converging within the upper middle Bollinger Bands. The moving average system has formed a golden cross, with the price on the four-hour chart gradually moving upward from the low of the 10-day moving average. Gold continued to favor buying low during Friday's pullback, with resistance at key new highs supporting selling high. In the short term, there will still be some volatility, so we recommend avoiding buying high and selling low. A light position can be entered near support levels. Looking at the hourly chart, if it holds above 3385, it could head towards 3390 or even 3400. Strong resistance above remains near 3416. Current support is 3360, with volatility expected if it remains below. A break below could see yesterday's low of 3358 or even 3350. Strong support below is near 3330.
Trading strategy:
Short-term gold: Buy at 3367-3370, stop loss at 3359, target at 3390-3410;
Short-term gold: Sell at 3416-3419, stop loss at 3428, target at 3390-3370;
Key points:
First support level: 3370, second support level: 3358, third support level: 3345
First resistance level: 3400, second resistance level: 3416, third resistance level: 3428

XAU/USD(20250808) Today's AnalysisMarket News:
① Trump nominated Stephen Milan, Chairman of the White House Council of Economic Advisers, to serve on the Federal Reserve Board, with a term ending January 31, 2026.
② Waller is reportedly a leading candidate for the next Fed Chair.
③ U.S. Treasury Secretary Bensont stated that the interview process for the Fed Chair has begun.
④ Bostic stated that the July jobs report did change the Fed's outlook on its employment goals.
Technical Analysis:
Today's Buy/Sell Levels:
3387
Support and Resistance Levels:
3423
3410
3401
3373
3364
3351
Trading Strategy:
If the price breaks above 3401, consider a buy entry, with the first target price at 3410.
If the price breaks below 3387, consider a sell entry, with the first target price at 3373.

GOLD - been waiting for 2 weeksTeam, I have been waiting GOLD for two week to short at 3404-3410
i just woke up and missed the short
Price current at 3401 - I am shorting NOW
Target 1 at 3386 - take 70% volume and BRING STOP LOSS TO BE
Target 2 at 3365
LETS GO

GOLD: Bullish Shift ConfirmedBullish BOS, price is trading above 3360. Clean bullish choch formed creating a new HH. Look to buy...
(H4)
✅ New HL formed around 3280 and we now have a break above $3355 and $3360 = BOS confirmed.
🟢 Key Zone: 3322–3337
(H1)
✅ BOS above 3360 confirms bullish bias
✅ Key Zone: 3322–3337 (Use this zone to set a limit or watch for confirmation)
Retracement expected before continuation.
(M15)
👀 What to Watch:
If price opens lower and taps into 3330s, monitor for:
✅ Sweep of intraday lows
✅ M15 bullish BOS above 3348–3350
🔁 Entry on retest of new demand zone after BOS
❌ Invalidation: Break and close below 3305
Other Scenario: No Pullback — Buy Breakout Instead
If price opens strong and continues up from the 3360s, wait for:
✅ Bullish Break of Structure (BOS) Above: 3385
This is your confirmation level that buyers are still in control

Gold - The diligent top formation!🏆Gold ( TVC:GOLD ) finished the bullrun:
🔎Analysis summary:
For the past 10 years, Gold has been trading in a very strong expected bullrun. Just like we witnessed it in 2011, a 10 year bullrun is followed by a shorter term bearmarket. Gold is starting to lose its strength, which is a clear sign of weakness and the beginning of a bearish reversal.
📝Levels to watch:
$2.800
SwingTraderPhil
SwingTrading.Simplified. | Investing.Simplified. | #LONGTERMVISION

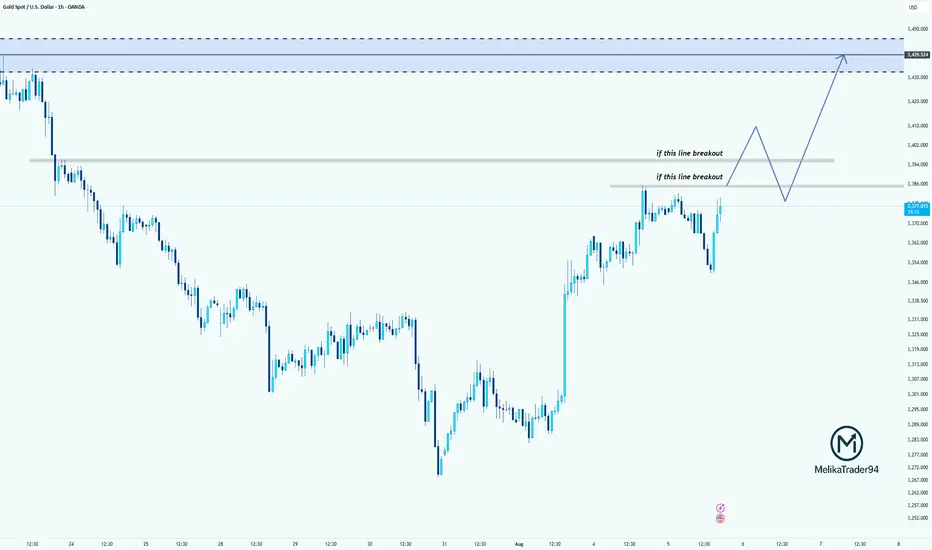
Breakout Levels in Focus for XAUUSDWhy did I say to cancel the last position? because gold is in the critical area!
Price is testing a key resistance area around 3374.
If it breaks above the first resistance level, we may see a bullish continuation toward the second breakout line.
If both levels are broken and retested successfully, the path toward the supply zone at 3430–3440 opens up.
Patience and confirmation are key here!
XAUUSD Bearish SMC Analysis – Institutional RejectionXAUUSD Bearish SMC Analysis – Institutional Rejection from Supply Zone
Gold (XAUUSD) is showing a clear bearish structure after rejecting a major supply zone at premium pricing. This setup is aligned with Smart Money Concepts (SMC) and reflects how institutions manipulate liquidity and order flow before major price moves.
🔍 Market Structure Context:
The market had been trending upward with higher highs and higher lows, until it approached a key premium supply zone near $3,420.
At this level, price stalled, creating internal Equal Highs (liquidity) — a common trap used by institutions to grab orders before reversing.
🔄 Change of Character (CHoCH):
A clear CHoCH was printed when price broke below the most recent higher low, signaling a shift from bullish to bearish structure.
This change marked the first early signal that institutional order flow has flipped bearish, and distribution is underway.
📉 Break of Structure (BOS):
Following the CHoCH, the market confirmed intent with a clean BOS to the downside.
This structural break confirms bearish control and validates short bias.
🧲 Liquidity Engineering:
Equal Highs were swept at the top, indicating a liquidity grab before institutions drove price downward.
This move traps breakout buyers and provides large players with sell-side execution at premium pricing.
🧱 Fair Value Gap (FVG) & Supply Zone Mitigation:
After BOS, price retraced into a Bearish Fair Value Gap (FVG) and the origin of the supply zone, offering a high-probability entry.
The rejection from this zone showed imbalance was respected and no bullish continuation existed — further validating the short setup.
🔍 Confluences for the Bearish Bias:
Confluence Confirmation
CHoCH Structure flipped bearish
BOS Bearish continuation confirmed
Liquidity Sweep Equal highs taken
FVG Retest Smart Money re-entry signal
Supply Zone Mitigation Institutional reaction confirmed
📘 Educational Summary:
This setup exemplifies a complete Smart Money bearish reversal model:
Premium pricing ✅
Liquidity taken ✅
Structure flipped (CHoCH + BOS) ✅
Supply & FVG respected ✅
It reflects how institutions build positions quietly, using engineered liquidity to trap retail traders, and then drive price with high-volume imbalance moves.

Analysis of subsequent gold price trends!Market News:
In early Asian trading on Thursday (August 7), spot gold prices fluctuated within a narrow range, currently trading around the 3,370 mark. International gold prices retreated slightly from a two-week high, primarily due to profit-taking by some investors, but the overall pullback was mild, indicating that bullish sentiment remained strong. The market is focused on US President Trump's upcoming announcement of his Federal Reserve nominee, a development that could profoundly impact the future path of interest rates and have a medium- to long-term impact on gold prices. Currently, while London gold prices have retreated slightly due to technical adjustments, the overall bullish structure remains intact. At the macro level, factors such as the slowdown in US service sector expansion, a cooling job market, rising business costs, and tariff uncertainty are compounding the market's heightened vigilance against stagflation and policy miscalculations. Furthermore, attention will be focused on changes in US initial jobless claims, the Bank of England's interest rate decision, and speeches by Federal Reserve officials.
Technical Analysis:
Gold prices fluctuated back and forth throughout the day. The US dollar index is declining significantly, suggesting a buy signal on the daily and weekly charts for gold. The 10/7-day moving averages are forming a golden cross and rising, the RSI indicator remains above the central axis, and the price is trading within the upper middle Bollinger Band. The Bollinger Bands on the four-hour chart are opening upwards, the moving averages are consolidating around the 70 mark, and the RSI indicator is trading above the central axis. With the US dollar's sharp decline and weakening, the key strategy for gold trading remains to buy at low prices. Don't chase highs when bullish on gold; wait for a pullback to buy. Don't speculate on the top of the rally; trade wherever the price can reach. Technically, gold has seen four consecutive days of gains on the daily chart, demonstrating strong trend strength. The upside is near the upper Bollinger Band of 3430. This price may be tested this week. A significant rally is not yet evident until the daily Bollinger Bands open up. Whether a significant rally will break through the previous high is not a matter of speculation; trade accordingly. Focus on two support levels within the short-term cycle: 3358 and 3350. After the Asian and European sessions conclude, consider placing effective buy orders based on actual conditions. We anticipate the upward trend will continue during the US session.
Trading Strategy:
Short-term gold buy at 3365-3368, stop loss at 3356, target at 3380-3400;
Short-term gold sell at 3387-3390, stop loss at 3398, target at 3360-3370;
Key Points:
First Support Level: 3365, Second Support Level: 3358, Third Support Level: 3343
First Resistance Level: 3390, Second Resistance Level: 3408, Third Resistance Level: 3420

XAU/USD(20250807) Today's AnalysisMarket News:
Federal Reserve Chairman Kashkari: A rate cut may be appropriate in the short term, and two rate cuts this year are reasonable. Trump: The new Fed governor will likely be temporary, and the appointment will be announced within 2-3 days.
Technical Analysis:
Today's Buy/Sell Levels:
3370
Support and Resistance Levels:
3397
3387
3381
3360
3354
3344
Trading Strategy:
If the market breaks above 3381, consider buying, with the first target price being 3387. If the market breaks below 3370, consider selling, with the first target price being 3360 .

Only look for BUY signal points in the current trend of Gold✏️The D1 candle closed with strong bullish force at the end of the day. The gold trend is still increasing wave 3 and there is no sign of correction. The reaction around 3385 in the Asian session this morning is being awaited to see if it is a recovery of Gold or not. The BUY strategy at important support zones is still maintained and pay attention to the price reaction of the candle.
📉 Key Levels
Support 3363-3346-3332
Resistance 3385 - 3407
Buy trigger: Confirmation of buying candle at support zones 3363-3346-3333
Target: 3400.00

The triangle pattern is about to break through and hit 3400#XAUUSD
Although the price of gold was too high last night due to the rise in risk aversion, the upward momentum weakened significantly in the evening, and it fluctuated sideways at a high level. Gold is currently consolidating within a triangle pattern, with a short-term price increase reaching the triangle's boundary. A break above 3385 could lead to significant intraday gains. Meanwhile, the downside is defending short-term support at 3365. As long as this support level remains intact, the bullish trend remains intact. If the European session gives an opportunity to fall back to the 3375-3365 support area without breaking, you can consider going long and look at 3395-3405, and if it breaks, look at 3415.
Gold trading rhythm is perfectly matchedIn the previous strategy, we recommended maintaining a high-selling and buying-low strategy for gold. We accurately predicted the high point near 3397 and arranged short positions near 3395. It then fell steadily to around 3371. Judging from the current gold trend, gold rose and then fell in the European session, touching around 3397, which is exactly the pressure level of the upward channel trend line. The Bollinger Bands in the 4H cycle closed, and the indicators temporarily showed signs of differentiation, but the overall market was resistant to declines at high levels. The current short-term support is around 3375-3370. If it does not break the short-term, it will still be volatile. If it falls below, the strong support of 3360 will be seen. The upper pressure levels are 3385, 3398-3400. In terms of operation, we still maintain a high-altitude, low-multiple short-term strategy. I will give the specific operation ideas at the bottom, remember to pay attention in time!

Possible long positions with levels for XAUUSD-Gold Entry: $3,381.000
Take Profit: $3,396.589
Stop Loss: $3,370.024
Current Status & Outlook: The current candlestick formation on the 15-minute timeframe is bullish, suggesting momentum is building towards the Take Profit target. This idea is based on the premise that the bulls will continue to drive the price to test the recent high.
Disclaimer
This analysis is for educational and informational purposes only and does not constitute financial advice. The provided trade idea is based on technical analysis and historical price action, and past performance is not indicative of future results. Trading foreign exchange on margin carries a high level of risk and may not be suitable for all investors. Before deciding to trade, you should carefully consider your investment objectives, level of experience, and risk appetite. You could lose some or all of your initial investment. Seek advice from an independent financial advisor if you have any doubts. Any action you take upon the information on this chart and analysis is strictly at your own risk.

Hidden secrets amidst gold volatility
💡Message Strategy
The current gold price is primarily supported by the following fundamental factors:
First, US President Trump signed an executive order imposing an additional 25% tariff on Indian imports, bringing the cumulative tariff rate to 50%. Meanwhile, the market expects Japanese goods to face an additional 15% tariff. This series of policies has fueled concerns about global economic uncertainty, significantly increasing market demand for safe-haven assets and benefiting gold.
Second, recent weak US economic data, including last Friday's weaker-than-expected non-farm payroll data and Tuesday's subdued ISM services PMI, have reinforced expectations of a Federal Reserve rate cut this year.
Furthermore, the US dollar has remained under pressure, weakening against major currencies to a more than one-week low. Since gold is priced in US dollars, a weaker dollar has increased purchasing power in non-US markets, indirectly pushing up gold prices.
Despite the overall optimistic tone in the equity market, the upward trend in risky assets has not dampened gold's momentum, indicating that market sentiment has not yet returned to a risk-on, and gold continues to serve as a core safe-haven asset.
📊Technical aspects
Looking at the two-hour chart, gold prices have been trading in a volatile consolidation pattern since rebounding from a low of $2,955. They are currently trading above the middle Bollinger Band ($3,340) and approaching the upper Bollinger Band ($3,430).
The Bollinger Bands are showing signs of convergence, indicating a temporary contraction in volatility, which could be a precursor to a potential breakout. A subsequent breakout above the upper Bollinger Band on larger volume would signal a "Bollinger Band squeeze + breakout" pattern, potentially testing the previous high of $3,430.
If gold breaks through the 3440 line with strength, then gold will continue to challenge the 3500 integer mark.
💰Strategy Package
Long Position:3365-3375,SL:3350,Target: 3400-3430

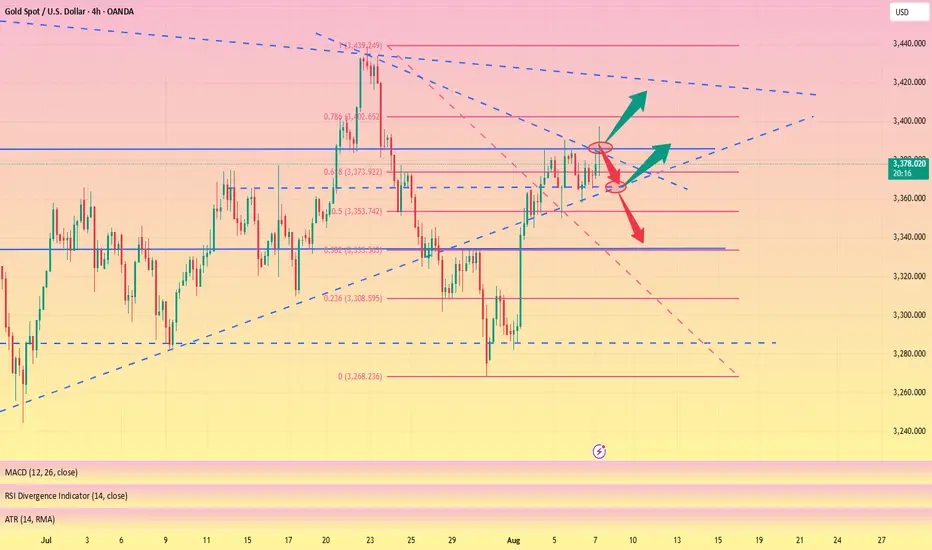
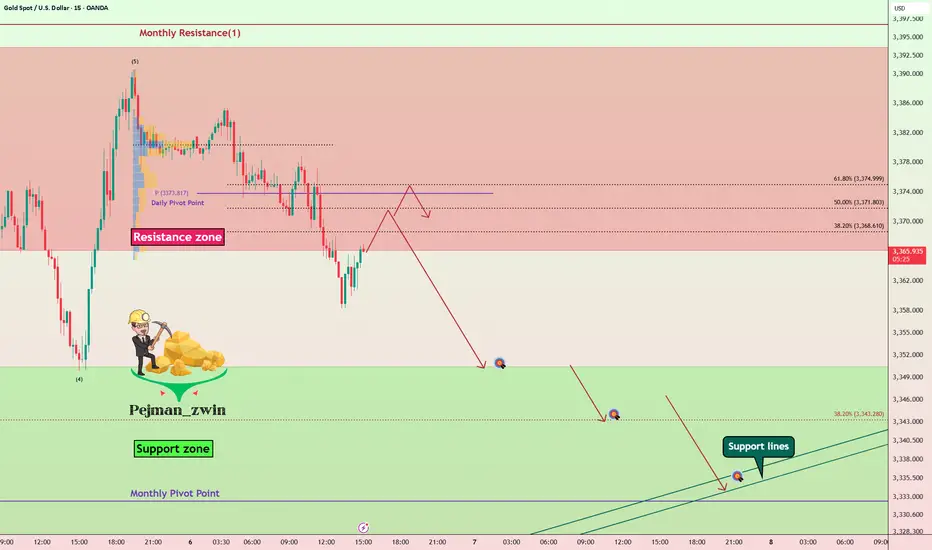
Gold Roadmap — Short termGold ( OANDA:XAUUSD ) rose to $3,383 as I expected in yesterday's idea .
Gold is currently moving in the Resistance zone($3,393-$3,366) .
In terms of Elliott Wave theory , it seems that Gold has completed 5 impulse waves , and we should wait for corrective waves on the 15-minute time frame .
I expect Gold to start declining from one of the Fibonacci levels and fall to at least $3,351 .
Second Target: $3,344
Third Target: Monthly Pivot Point/Support lines
Note: Stop Loss (SL) = $3,392
Gold Analyze (XAUUSD), 15-minute time frame.
Be sure to follow the updated ideas.
Do not forget to put a Stop loss for your positions (For every position you want to open).
Please follow your strategy; this is just my idea, and I will gladly see your ideas in this post.
Please do not forget the ✅ ' like ' ✅ button 🙏😊 & Share it with your friends; thanks, and Trade safe.
Gold is under pressure. Can the upward trend continue?On Thursday, gold rose rapidly in the European session, reaching around 3397, but failed to successfully break through the 3400 integer mark; it currently fell back slightly and fluctuated around 3375. Judging from the 4-hour chart, the price is currently running close to the middle track of the Bollinger band; since the market opened this week, the gold price has continued to run above the middle track of the Bollinger band. Despite the slight decline, it has remained within the upward trend channel and has continuously set new highs.
The current upward pressure position remains at 3390-3400, and the key support level is around 3370, which is also the crossover position of the current MA5, 10, and 20 moving averages. The RSI indicator remains above its midline, indicating that bullish momentum remains.
Quaid believes that as long as the price remains above 3370 in the US session, any pullback will be a sign of accumulating upward momentum. Gold still has the trend of hitting the 3400 integer mark.
Trading strategy:
Go long near 3370, stop loss at 3360, profit range 3380-3390-3400.
Short near 3400, stop loss at 3410, profit range 3375-3365-3355.

Strike with precision and win in the gold trading market!Gold continues to fluctuate in an upward structure, with lows gradually rising, showing that the bulls are still in a dominant position. The current key support has moved up to the 3360 line. Before this position is effectively broken, the overall idea is to maintain a low-long strategy. It should be noted that the current market has been consolidating at a high level for three consecutive days, and has the basis for further strengthening. It is not advisable to wait for a sharp pullback at this time, but to pay attention to the continuity opportunities of direct pull-ups. It is recommended to seize the strong continuation opportunities in the current period in terms of operations, and strategically postpone it to the European and American trading sessions for simultaneous execution. Specifically pay attention to the long order layout opportunities in the support area of 3375-3360, and the upper resistance is around 3390-3405. Overall, we should flexibly participate in the high-altitude and low-long rhythm in this range. It is recommended to wait and see in the middle position, chase orders cautiously, and wait patiently for key points to enter the market.

The bullish trend remains unchanged, seize the opportunityAfter today's opening, gold continued the bullish trend of yesterday. Judging from the daily line, gold has continued to rise, and it may only be a matter of time before it reaches a higher level. Judging from the 4H chart, the technical indicators are dead cross and shrinking, and the flexible indicators are repairing upward. The short-term middle track support is around 3372, and the upper side pays attention to the short-term pressure of 3395-3405. If the European session fails to effectively break through the short-term resistance, it will give the opportunity to test the 3380-3370 support again. If it is not broken, you can consider continuing to go long.
OANDA:XAUUSD
