Seize the opportunity to short gold after the reboundBecause gold fell back to the expected support area of 3375-3365 first, I just took the opportunity to go long on gold near 3372 and set TP: 3390. Obviously, our long position ended the transaction by hitting TP, and we made a profit of 180pips.
At present, gold continues to rebound to around 3396, and is facing the short-term resistance area of 3395-3405, and the upside may be limited. And I think before the Fed's interest rate decision and Powell's monetary policy conference, gold is likely to maintain a range of fluctuations, and the willingness of both long and short parties to break through may not be strong in the short term. And from the current structure, gold tends to fluctuate downward as a whole.
So for short-term trading, we might as well try to short gold in the resistance area. I think it is still very likely to retreat to at least the 3385-3380 area.
Goldprediction

XAUUSD:A long trading strategy
Yesterday was affected by the easing signal gold high continued to correction, fell back to 3400 again, the trend exceeded personal expectations. Gold received another boost after the president's news, and rebounded slightly in the Asian session. In this eventful autumn, the market is subject to frequent news factors, the trend is slightly turbulent, to be ready to sweep back and forward.
Today's overall volatility is expected to have a contraction, individual expectations of the final close of the small negative line is more likely
Trading Strategy:
BUY@3380-85
TP:3404-3410
↓↓↓ More detailed strategies and trading will be notified here ↗↗↗
↓↓↓ Keep updated, come to "get" ↗↗↗

GOLD(XAUUSD) UPDATEKeep a close watch on the 3,403–3,406 zone (highlighted area in the chart). This is a strong resistance zone that gold has tested multiple times but failed to break.
What to expect?
If gold gives a clean breakout and sustains above this zone, we could see a good upside momentum unfolding.
📈 Break above = bullish momentum confirmation
💬 Stay alert and be ready to act if price breaches this key level with volume and strength.
Trade smart, manage risk.

Trading strategy june 18Yesterday's D1 candle was a Doji candle. It shows the hesitation of buyers and sellers at the price near ATH.
The h4 structure is a sustainable bullish wave structure and is heading towards higher hooks.
The 3400 zone is the immediate resistance zone that Gold is heading towards. This zone will be the breakout zone for the confirmation of the candle closing above 3400.
The profit-taking reaction zone of sellers at 3415 acts as a price reaction when the price uptrends again and creates momentum towards 3443.
On the opposite side, the breakout point of 3472, if broken, will push the price to the support zone of 3342
Break out zone: 3400; 3372
Resistance: 3415; 3443
Support: 3343

Gold price analysis June 18Yesterday's D1 candle was a Doji candle. It shows the hesitation of buyers and sellers at the price near ATH.
The h4 structure is a sustainable bullish wave structure and is heading towards higher hooks.
The 3400 zone is the immediate resistance zone that Gold is heading towards. This zone will be the breakout zone for the confirmation of the candle closing above 3400.
The profit-taking reaction zone of sellers at 3415 acts as a price reaction when the price uptrend returns and creates momentum towards 3443.
On the other hand, the breakout point of 3472, if broken, will push the price to the support zone of 3343

Gold (XAU/USD) 4H Technical Analysis - 18 June-2025Gold has been in a bullish 4H uptrend, making higher highs and higher lows. Recent data show gold peaked near ~$3,445 on June 16 (a new all-time high) before pulling back toward the $3,400 area.
In other words, price action remains constructive: successive higher lows (around $3,372, $3,322) and higher highs (around $3,445) indicate a strong uptrend.
As long as each pullback holds above the prior swing low (so far ~$3,372), the bullish structure (Break-of-Structure, BOS) is intact.
A decisive drop below ~3,372 (and especially below ~$3,322) would violate that structure (a Change-of-Character, CHoCH) and open a deeper correction.
Market Structure & Bias (4H)
Bullish bias: Gold has made a series of higher lows and highs on 4H, confirming an uptrend
Technical indicators (RSI bullish, price above 200-SMA) and fundamentals (safe-haven demand) support this bias.
Caution near $3,400:
The key $3,400 zone has switched roles as resistance-turned-support. Holding above $3,400 keeps bulls in control, but failure to regain it could allow a deeper dip toward ~$3,350.
Break-of-Structure (BOS): A BOS (new 4H high) upholds the uptrend.
A CHoCH (e.g. a close below $3,372/$3,322) would signal a possible reversal
Key 4H Levels & Zones
Resistance/Supply: ~$3,445–3,450 (recent swing high); ~$3,500 (psychological/all-time level).
Price may stall or reverse near these supply zones.
Pivot/$3,400: ~3,400–3,413 zone – a critical pivot. Gold traded near $3,400 recently; a break above targets $3,450, while failure could drop to support.
Support/Demand Zones: ~$3,372 (prior 4H higher-low). Near ~$3,350–3,353 – the 61.8–78.6% Fibonacci retracement of the last rally and a “golden pocket” demand area. ~$3,322–3,328 – a strong 4H demand order-block where price held on the last pullback.
Finally ~$3,300 (major low below).
Order Blocks & Imbalances: Smart-money traders note a 4H demand block at $3,322–3,328 (the low of a large bullish candle).
A brief sweep above $3,338 (a liquidity grab) was followed by a clean bounce from this zone.
Any unfilled gaps (imbalances) near $3,380–3,400 may attract price back during retracements.
In summary, the 4H chart shows a bullish structure with key support at ~$3,372–3,350 (demand/Fib zone) and resistance around $3,445–3,500. As FXStreet notes, the uptrend remains “intact” on 4H as long as dips are bought.
However, traders should watch for any break below $3,372/$3,322, which would flag a bearish structure break.
Until then, the overall bias is bullish, favoring long entries on dips into the above support zones.
1H High-Probability Trade Setups (Bullish Bias)
Setup 1 – Buy on $3,400 pivot hold: Entry zone $3,390–3,400 (at/just above 4H pivot). Stop: ~$3,380 (just below pivot, ~$10 below entry). TPs: $3,420 and $3,450. Trigger: A bullish candlestick pattern or break-and-retest of ~$3,400 (e.g. bullish engulfing or hammer on 1H). Reason: The $3,400 level is a key 4H support/resistance flip.
Holding here would confirm the uptrend continuation, targeting the recent swing highs. A 1H bullish signal (like a reversal bar) gives a clear entry.
Setup 2 – Buy on deep pullback: Entry zone $3,370–3,380 (around 4H higher-low). Stop: $3,360. TPs: $3,400 (the pivot) and $3,420. Trigger: A strong 1H bullish candle or double-bottom forming near zone. Reason: This area lines up with the 4H demand/Fib zone ($3,350–3,372).
It represents a higher-low in the 4H structure. A bounce here would signal buyers stepping in at a key support.
Setup 3 – Buy after breakout of $3,445: Entry zone $3,450–3,455 (above recent high). Stop: ~$3,440. TPs: $3,480 and $3,500. Trigger: A clean 1H candle close above $3,445 (breakout) and retest. Reason: A push above $3,445 (June high) would form a new 4H BOS, suggesting continued momentum. Buying on the breakout retest captures follow-through to the next targets.
(Each setup uses a small $~10 stop relative to gold’s price. Always wait for the specified trigger pattern before entering.)
Takeaway:
On the 4H chart, gold remains bullish while above ~$3,372/$3,350. Key zones to watch are $3,372–3,350 (buy zone) and $3,400–3,445 (sell/resistance). For now, favor long entries into support, and confirm with clear 1H signals before trading.

Gold fluctuates under pressure. Can it break out?Information summary:
The conflict between Iran and Israel has entered the fifth day, Tel Aviv air raid alarms are frequent, and the fire of oil tankers in the Strait of Hormuz has exacerbated the panic of energy transportation, and safe-haven buying supports gold prices;
Trump's contradictory statement of "peace talks + toughness" has exacerbated the market's differences on the direction of the conflict, and risk aversion has fluctuated repeatedly.
In the early Asian session, spot gold fluctuated narrowly at $3,375, continuing the stalemate under the geopolitical conflict and the game of the US dollar. As the "king of safe havens", gold has recently bottomed out and rebounded based on the tension in the Middle East, and the current price fluctuates around 3,395.
Market analysis:
The four-hour chart shows that the moving average is sticking to wait for a breakthrough in the direction, and the short-term moving average is sticking to $3,380. The RSI indicator fluctuates around 50, suggesting that a breakthrough will be ushered in after a narrow consolidation; the lower rail support of the rising channel moves up to $3,370, and if it fails, it may test $3,350.
At present, the price is repeatedly testing the resistance position of 3400. If the price stands above this position, it may continue to rise to around 3430. If it breaks the support of 3370 US dollars, it will look to 3360 US dollars.
Operation strategy:
Short near 3400, stop loss 3410, profit range 3370-3365.
If the price falls back to around 3370, you can try to go long, and the profit point is around 3390.

Gold may usher in new opportunities
Key fundamental drivers
- Middle East tensions and nuclear negotiations Despite the ongoing tensions, Iran's signal of restarting nuclear talks has reduced risk aversion, triggering an intraday sell-off in gold, and the market has digested the reduced possibility of escalation of the conflict. The turbulent situation in the Middle East remains a trigger for market volatility, and any downgrade/escalation signals may trigger sharp fluctuations in gold prices.
- Fed policy and rate cut bets The Fed kept interest rates unchanged this week, but Powell's "data-dependent" stance has raised market expectations for a September rate cut to 60%. A dovish meeting statement could push gold prices above $3,400, while a delayed rate cut signal could drag gold prices to $3,350.
Short-term outlook
In the short term, gold prices may fluctuate between $3,350 and $3,450, and a breakthrough depends on:
- Upside catalyst: Escalating tensions in the Middle East + weak retail sales data may push gold prices to $3,450.
- Downside risks: Fed hawkish signals + fading geopolitical risks could push prices to $3,300.
Key event risks
- June 19: Fed policy meeting (expected to be dovish)
- June 21: US CPI data (inflation indicator to measure the timing of rate cuts)
- Middle East situation: progress in nuclear negotiations and conflict dynamics
💰Strategy Package
Set gold price:
🔥Sell gold area: 3390-33396 SL 3400
TP1: 3380 US dollars
TP2: 3375 US dollars
🔥Buy gold area: $3374-$3366 SL $3360
TP1: 3390 US dollars
TP2: 3400 US dollars

XAUUSD DAYTRADE SIGNAL!!!Hello Everyone i want share my trade for today at Gold/USD pair.
price moving slow downside, with liquidity, for today i will use Fibonacci.
Open Short position at 3390
Stop Loss 3396
Take profit 3366
The reason for this trade is catch liquidity and dollar is still bullish and that's the reason why i think gold will go down again.
Always make your research!!!!

Gold is under pressure! What is the key to breaking the deadlock
📌 Core driving events
The conflict between Iran and Israel has entered the fifth day. Air raid alerts in Tel Aviv are frequent. The fire on a cruise ship in the Strait of Hormuz has exacerbated the panic of energy transportation. Safe-haven buying supports gold prices;
Trump's contradictory statement of "peace talks + tough" (may send executives to meet but demand "unconditional surrender") has exacerbated the market's disagreement on the direction of the conflict, and risk aversion has fluctuated repeatedly.
The Federal Reserve will announce its interest rate decision today. The market expects it to remain unchanged at 4.25%-4.50%, but Powell's statement on rate cuts will affect the trend of the US dollar (Trump continues to pressure for a 1 percentage point rate cut).
📊Comment Analysis
1-hour chart: 3396 becomes the intraday strength and weakness watershed
The Asian morning session hit a high of 3396 US dollars and fell back. This point is the previous high pressure point. If the intraday rebound does not break through this position, the bearish thinking will be maintained;
💰Strategy Package
Set gold price:
🔥Sell gold area: 3390-33396 SL 3402
TP1: 3380 US dollars
TP2: 3375 US dollars
🔥Buy gold area: $3374-$3368 SL $3362
TP1: 3390 US dollars
TP2: 3400 US dollars
⭐️ Note: Labaron hopes that traders can properly manage their funds
- Choose the number of lots that matches your funds

Gold-----Sell near 3405, target 3390-3360Gold market analysis:
Yesterday's daily line closed with a big negative line, which was basically a day to kill the buying. Today's idea is to sell in the short term. The daily and weekly trends have not yet turned to selling. Although the daily line closed with a big negative line yesterday, its shape and indicators have not completely turned to selling. There is still motivation to buy in the later stage. In addition, Iran and Israel are still fighting. It is still difficult to see a deep decline in the short term. We estimate that today's Asian session will rebound slightly and then fall. If today's daily line continues to fall again, it may enter a new short-term selling mode. We are just a follower. We follow the short-term. If the short-term trend is bearish, we will rebound and sell. The daily line closes the negative Asian session and waits for the opportunity to sell.
In the Asian session, we pay attention to the suppression of the 3410 position. It is the suppression position of the shape, the suppression position of the 1-hour moving average, the central axis position of yesterday's big drop, and the suppression position of the daily line. If the Asian session stands on 3410, it may bring a new technical rise in buying. After all, the shape of the daily line is still buying. Secondly, if it breaks 3382, it can continue to sell it with a small rebound. 3405 is also a suppression, and it is also considered to sell when it is close.
Pressure 3405 and 3410, support 3282, the strength and weakness dividing line 3400.
Fundamental analysis:
Yesterday, Iran and Israel started bombing each other again, and the situation began to escalate.
Operation suggestion
Gold-----Sell near 3405, target 3390-3360

Gold is weak, and there may be a low point yet to come!According to the current structure, gold is obviously in a weak position. Gold has failed to break through the high point of the previous wave after multiple rebounds during the day. 3400 has become a new round of pressure area; and gold has just accelerated its decline and fell below 3370. For the current trend, falling below 3370 will weaken the bullish sentiment to a certain extent and indicate that there is further room for decline, so I think gold should have a low point, and the low point we should first pay attention to is in the range of 3365-3355.
So in terms of short-term trading,
First, we can try to short gold with the short-term resistance area of 3395-3405;
But if gold first retreats to the support area of 3365-3355, we can first choose to go long on gold.

Have you caught up with this golden opportunity?The 4-hour K-line pattern of gold shows that the upward trend remains intact, focusing on the strong support range of 3360-3365 (technical resonance with the 5-week moving average). Before the price effectively breaks below the support band, the bulls still have upward momentum, otherwise the trend may reverse. The 3365-3400 range is maintained for intraday fluctuations. The gold operation strategy recommends arranging long orders in the 3370-3375 area when the price falls back, and adding positions to long positions if the support of 3360-3365 is broken.
Operation strategy: Gold recommends going long near 3370-3375 now, and adding positions to long positions in the support area of 3360-3365 when the price breaks, with the target of 3380-3390.
If you still lack direction in gold trading, you might as well try to follow my pace. The strategy is open and transparent, and the execution logic is clear and definite, which may bring new breakthroughs to your trading. The real value does not rely on verbal promises, but is verified by the market and time.

Will ASIA favor BULLS or BEARS?Two “if-this-then-that” scenarios
If price pushes above the recent swing high (~3 430–3 435)
→ Look for a move toward the 50% retracement zone at 3 415–3 416 (our next upside target).
If price drops below the recent swing low (~3 356–3 357)
→ It’ll likely slide down to the 21-day EMA at 3 342, which has acted like a magnet/bounce area.
Why the 21-day EMA matters
It’s sloping up beneath price (green trendline), so dips into it often spark fresh buying.
A buy-limit order around 3 342 gives you a low-risk entry with the trend still intact.
Overall bias
As long as gold stays above that rising trendline/21 EMA, the bulls remain in control.
Break the swing high → more upside.
Break the swing low → deeper pullback into support.

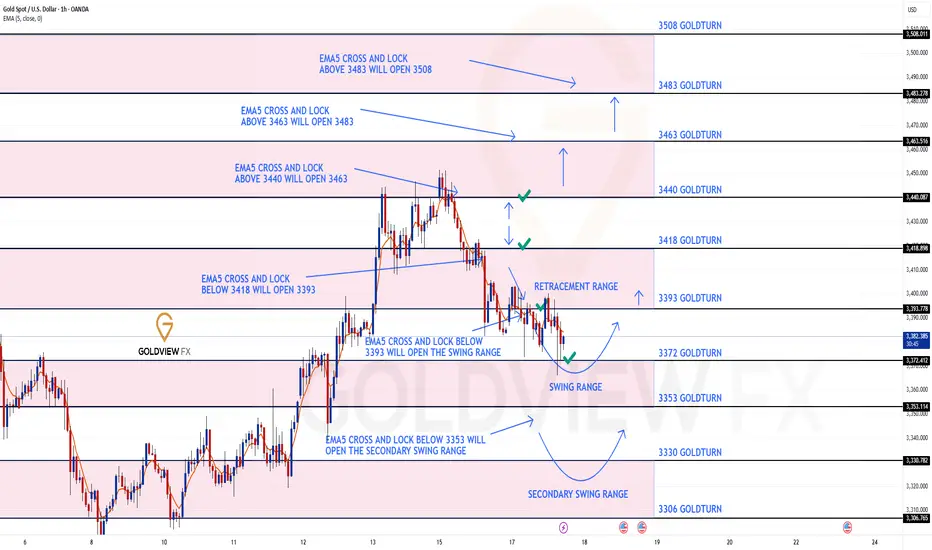
GOLD ROUTE MAP UPDATEHey Everyone,
Another great day on the markets with our chart idea playing out, as analysed!
Yesterday we started with our Bullish target at 3440 hit, followed with no EMA5 cross and lock, confirming the perfect rejection and showcasing the accuracy of our levels. This rejection went on to hit our Bearish target, followed by EMA5 cross and lock opening 3393, which was also hit perfectly.
🔄 Update:
After testing 3393, we got the EMA5 cross and lock, opening the swing range. The first level was tested perfectly and gave the bigger bounce. Let’s see if it completes the full swing back to 3393, or if it goes for the full swing test below.
We will keep the above in mind when taking buys from dips. Our updated levels and weighted levels will allow us to track the movement down and then catch bounces up.
We will continue to buy dips using our support levels, taking 20 to 40 pips. As stated before, each of our level structures gives 20 to 40 pip bounces, which is enough for a nice entry and exit. If you back-test the levels we shared every week for the past 24 months, you can see how effectively they were used to trade with or against short/mid-term swings and trends.
🌀 The swing ranges give bigger bounces than our weighted levels - that's the difference between the two.
BULLISH TARGET
3440 - DONE
EMA5 CROSS AND LOCK ABOVE 3340 WILL OPEN THE FOLLOWING BULLISH TARGETS
3463
EMA5 CROSS AND LOCK ABOVE 3463 WILL OPEN THE FOLLOWING BULLISH TARGET
3483
EMA5 CROSS AND LOCK ABOVE 3483 WILL OPEN THE FOLLOWING BULLISH TARGET
3508
BEARISH TARGETS
3418 -DONE
EMA5 CROSS AND LOCK BELOW 3418 WILL OPEN THE FOLLOWING BEARISH TARGET
3393 DONE
EMA5 CROSS AND LOCK BELOW 3393 WILL OPEN THE SWING RANGE
3372 - DONE
3353
EMA5 CROSS AND LOCK BELOW 3353 WILL OPEN THE SECONDARY SWING RANGE
3330
3306
As always, we will keep you all updated with regular updates throughout the week and how we manage the active ideas and setups. Thank you all for your likes, comments and follows, we really appreciate it!
Mr Gold
GoldViewFX
Gold continues to fall. Will there be a lower point?Gold is still under pressure at the integer mark of 3400. During the US trading session, the lowest point reached around 3366. For the current trend, it fell below the short-term support area of 3375, so the market has the possibility of further downward movement to test the support of 3350.
Today, Iran launched missiles again, but there was no threat to Israel at all, and all the missiles were intercepted. Under the current trend of further decline, the support position that needs to be paid attention to is 3350. At this position, you can try a long strategy, and the early support point of 3400 above has turned into an upward pressure point.
Short-term operation strategy:
Buy near 3350, stop loss 3340, profit range 3380-3390.
Above, you need to pay attention to the important pressure level of 3390-3400. The market changes violently, and you can take profits at the right position. Avoid rapid changes in market conditions and losses.
