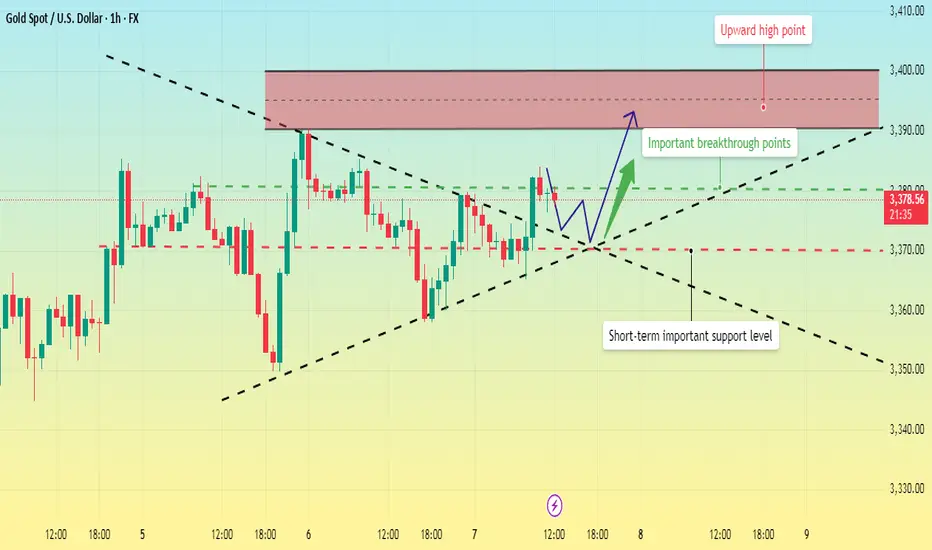
Gold Consolidates at High Levels. Waiting for a New Trend?Gold barely held the 3360 level on Wednesday and will remain in the 3360-3380 consolidation range outlined by Quaid.
Quaid considers Thursday to be a more important day. From a timing perspective, today may impact whether gold can continue its upward trend. However, it is possible that the market could continue its consolidation today. One thing is that the daily line must close above 3360, then the subsequent rise in gold will continue.
On the contrary, if it closes below 3360, then the rise will definitely not be able to continue in the short term. In the short term, gold may remain above 3370 today.
We can see that 3375-3370 is an important support, but the daily line has not yet stabilized above 3380, so the upward space has not yet been opened. If the daily chart can stabilize above 3380, then a test of 3400-3410 is in the cards.
Trading strategy:
Buy between 3365-3370, stop loss at 3355, profit range 3380-3390-3400.
Goldprediction
Gold Bulls Unshaken, 3400 in FocusGold prices retreated from a high of 3385 today, currently hitting a low near 3358. How far will gold fall? Are the bears back in control? I'm not worried about a gold pullback, but rather a lack of one, because only a pullback can provide a good entry opportunity. Clearly, I remain bullish on gold and optimistic about it reaching the 3400 mark.
Because gold fell all the way to around 3358, some voices in the market began to tout the strong return of the bears, but I remained unmoved. When many people were once in self-doubt, I was quietly taking advantage of the gold pullback to accumulate funds in batches and pick up bargains. We can clearly see that gold did not destroy the bullish structure during the decline, and as gold rebounded, the 3360-3350 area has become a dense trading area, indicating strong buying support. After the technical top and bottom conversion, it has become a relatively solid support area. It may be difficult for gold to fall below this support area in the short term.
So, why has gold repeatedly encountered resistance and retreated? I believe that gold has encountered resistance and retreated in the 3385-3390 area many times in order to repeatedly test the effectiveness of support and consolidate the strength of support. It is also to increase liquidity during the retreat period, thereby accumulating more upward momentum so that gold can rise further and break through the 3400 mark.
So I still hold a long position in gold, and I have not lost confidence in the gold bulls. On the contrary, I still expect that gold will be able to hit 3400 in one fell swoop after repeatedly testing the support, or even continue to rise to the 3420-3430 area.

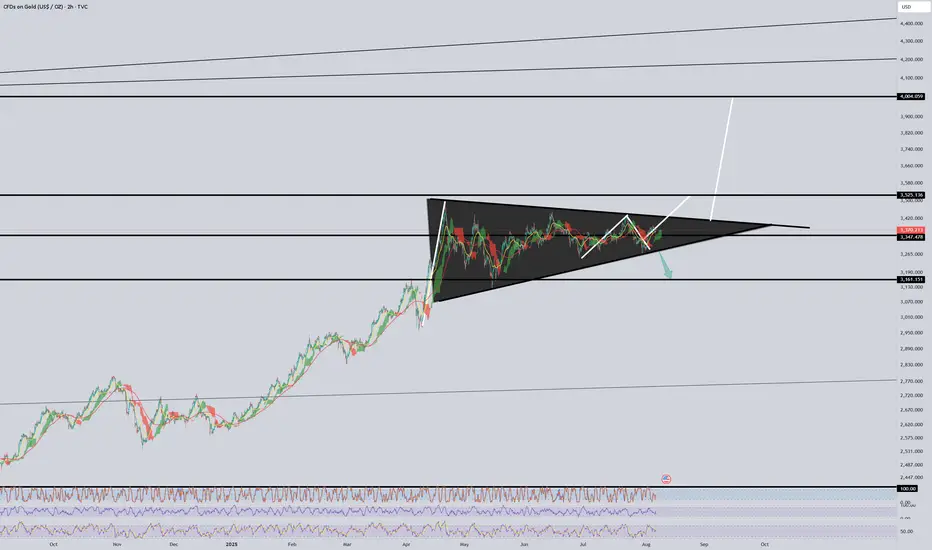
Next move in gold is closing in. Gold is squeezing as it nears it's next decision point. A decision will be made in the coming weeks.
A break higher should take us to $3500 at minimum. A break below takes us to the $3150-3200 range.
Gold Price Trend Analysis and Trading Guidance (Exclusive)📣📣📣A technical analysis of gold's recent performance reveals that it has formed a four-day winning streak, demonstrating the strength of the upward trend and indicating that short-term upside potential has not yet been exhausted. Of note, the upper Bollinger Band at 3430 on the daily chart is acting as a key resistance level, and this level is likely to be tested this week. However, when it comes to a sharp rise in the market, there is no clear signal at present. We need to wait for the opening pattern of the daily Bollinger band to be confirmed before we can open up a new round of upward space.🧐🧐🧐🤔🤔🤔
Switching to the H4 cycle for observation, the unilateral upward trend continues to consolidate, the moving average system shows a perfect upward divergent arrangement, the Bollinger Bands simultaneously maintain an open state, and a short-term high pressure is formed near the upper rail of 3415. Based on this, the bullish logic for gold remains unchanged on Wednesday, with the intraday high range likely to be between 3415 and 3430. There's no need to overestimate whether the price will break through previous highs at this point, and trading strategies should be adjusted dynamically based on real-time market performance. From a short-term perspective, intraday support should focus on two key levels: 3360 and 3350.
👊👊👊On the operational level, it is recommended to adopt a strategy of placing long orders in batches when the price falls back to the 3365-3360 range, relying on the support level to seize the opportunity of trend continuation.⭐️⭐️⭐️
⚠️⚠️⚠️The market is risky, so participate rationally. If you need real-time trading references and trading advice, please leave a message to Charlie.🛫🛫🛫 FOREXCOM:XAUUSD VELOCITY:GOLD PEPPERSTONE:XAUUSD CMCMARKETS:GOLD ICMARKETS:XAUUSD CMCMARKETS:GOLD FXOPEN:XAUUSD
Gold Price Analysis August 6In the Tokyo session this morning, gold recorded some selling pressure after strong buying pressure in the US session yesterday promoted profit-taking sentiment. It is expected that prices may continue to correct during the Asia-Europe session today before potential buying pressure returns in the London session.
Trading plan:
Scalping SELL: 3375
Support zone to watch for BUY: 3346 – 3333 – 3315 (priority when there is a clear price rejection signal)
Upside target: 3420

Prices are suppressed. Will they rise amidst volatility?Information Summary:
Trump's upcoming appointment of Federal Reserve officials has the market on the sidelines, leading to a pullback in gold prices, but bullish sentiment remains.
Quaid believes that most investors are closely watching the White House's upcoming Federal Reserve appointments and any trade-related news, which could have a significant impact on market sentiment.
Furthermore, market expectations for a September rate cut are high. After last week's weak jobs report, investors are pricing in an 87% chance of a September rate cut, according to the CME FedWatch tool. Following the release of the report, Trump fired the director of the Bureau of Labor Statistics, further exacerbating policy uncertainty.
As a traditional safe-haven asset, gold generally performs better in environments with increased political and economic uncertainty and low interest rates.
Market Analysis:
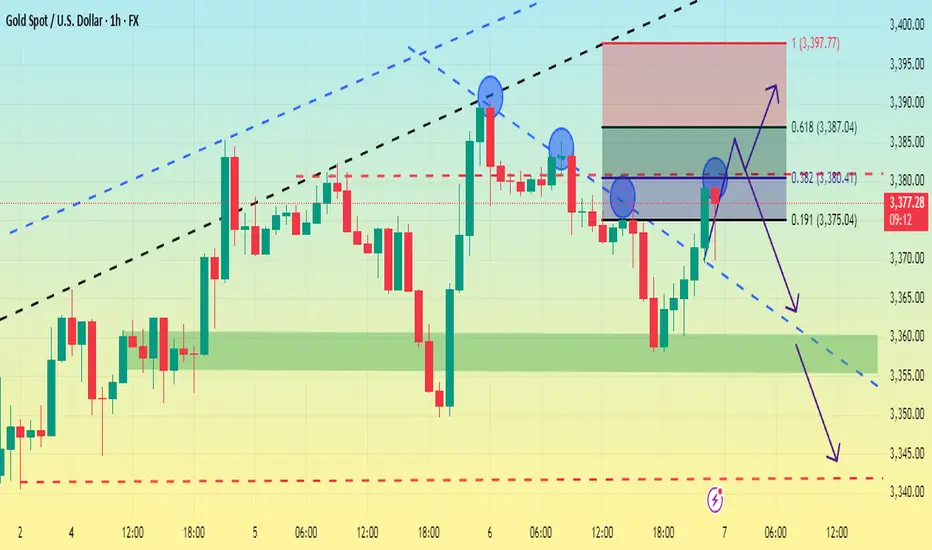
Gold prices retreated slightly on Wednesday, but Quaid believes there is still room for further gains, with a short-term target of 3,400. Supporting factors include: continued tariff friction; slowing economic growth and inflation concerns; and a weak US dollar.
Looking at the hourly chart, the Fibonacci 0.382 position is right around 3380. Moreover, the top of the trend line of gold's bottoming rebound is also at this position, so if the pressure of 3380 cannot be broken through, we need to be alert to the possibility of a pullback.
Next, keep an eye on 3360. If gold can't break through 3380, it may consolidate between 3360 and 3380.
If bears continue to push down the price below 3360, a test of 3340 is possible.
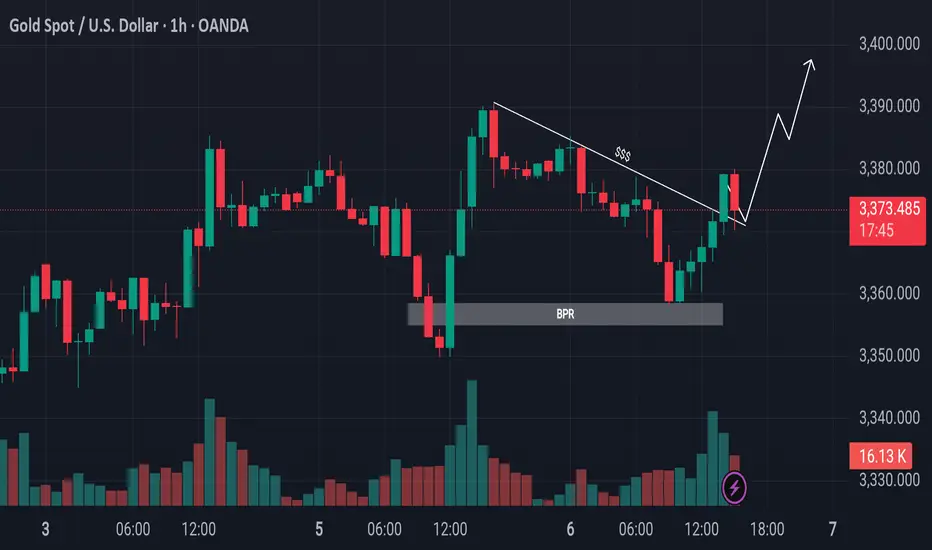
Gold Retraces to OTE and Breaks ResistanceEyes on Swing Highs!Gold Market Update
The gold market declined from its previous bullish leg and retraced below the 50% level, reaching into the Optimal Trade Entry (OTE) zone. It also tapped into a Bullish Price Rejection (BPR) area. Following that, price broke above the trendline resistance. Currently, it is advisable to wait for a potential retest of the breakout level. If confirmed, the market could continue its upward movement toward the previous swing highs.
Do Your Own Research (DYOR)
GOLD ROUTE MAP UPDATEHey Everyone,
Another great day in the markets with our chart idea playing out exactly as planned, allowing us to buy the dips.
We’re seeing a repeat of yesterday's setup, the 3392 gap remains open after the EMA5 lock above 3370. We're getting drops into the lower Goldturn zones, giving us great opportunities to buy back in.
As long as we don’t get a confirmed lock below 3348, we continue to chase the open gap above at 3392.
We will keep the above in mind when taking buys from dips. Our updated levels and weighted levels will allow us to track the movement down and then catch bounces up.
We will continue to buy dips using our support levels taking 20 to 40 pips. As stated before each of our level structures give 20 to 40 pip bounces, which is enough for a nice entry and exit. If you back test the levels we shared every week for the past 24 months, you can see how effectively they were used to trade with or against short/mid term swings and trends.
The swing range give bigger bounces then our weighted levels that's the difference between weighted levels and swing ranges.
BULLISH TARGET
3370 - DONE
EMA5 CROSS AND LOCK ABOVE 3370 WILL OPEN THE FOLLOWING BULLISH TARGETS
3392
EMA5 CROSS AND LOCK ABOVE 3392 WILL OPEN THE FOLLOWING BULLISH TARGET
3416
EMA5 CROSS AND LOCK ABOVE 3416 WILL OPEN THE FOLLOWING BULLISH TARGET
3429
EMA5 CROSS AND LOCK ABOVE 3429 WILL OPEN THE FOLLOWING BULLISH TARGET
3439
BEARISH TARGETS
3348
EMA5 CROSS AND LOCK BELOW 3348 WILL OPEN THE FOLLOWING BEARISH TARGET
3328
EMA5 CROSS AND LOCK BELOW 3328 WILL OPEN THE FOLLOWING BEARISH TARGET
3313
EMA5 CROSS AND LOCK BELOW 3313 WILL OPEN THE SWING RANGE
3296
3281
As always, we will keep you all updated with regular updates throughout the week and how we manage the active ideas and setups. Thank you all for your likes, comments and follows, we really appreciate it!
Mr Gold
GoldViewFX

The bullish outlook remains unchanged, go long with the trend!Yesterday, the gold bulls refreshed the high point, and the daily line closed in the form of a medium-sized Yang line with a long lower shadow. The idea of continuing to be bullish in the short term remains unchanged, and what needs to be paid attention to is the strength of the retracement, which is similar to yesterday. The current support below is maintained at the 3355-3350 line of yesterday's rise. This position is also today's key support level, and the key suppression point above is maintained at the integer level of 3390-3400. This position may not be the end point. It was also mentioned yesterday that under the range of the previous large range of fluctuations, if either side does not break through, it will likely continue to fall into fluctuations. The current bullish trend is still relatively obvious, so we still maintain the idea of low-long operations. If your current operation is not ideal, I hope I can help your investment avoid detours. Welcome to communicate!
From the 4-hour analysis, the important support below is the 3355-3350 line. If the daily level stabilizes above this position, the bullish rhythm of falling back to lows and buying on the trend will remain unchanged. Before the daily level falls below the 3350 mark, you need to be cautious about shorting against the trend. I will provide you with the specific operation strategies at the bottom, please pay attention to them in time.
Gold operation strategy: Go long on gold when it retraces to around 3360-3350, target 3375-3385 area, and continue to hold if it breaks through.

GOLD BUY Gold will be buying soon and keep respecting it’s patterns so , I will keep the trading simple and straightforward

The market trend is still there, go long on the pullback#XAUUSD
Yesterday, gold experienced a V-shaped reversal: it was blocked at the 3382 line in the morning and then fluctuated and fell, then it fell to the support near 3349 and stabilized and rebounded, then rebounded to near 3390 in the evening and closed with a doji on the daily line. Judging from the overall trend, the bullish pattern has not changed.
Gold has limited room for decline in the short term, and a sharp drop is unlikely. Today's market tends to adjust and correct first before continuing to rise. The adjustment is only short-term, and is more to give everyone enough opportunities to get on board. The focus of the market below is 3375-3360, with the target looking at yesterday's high around 3390-3395. A break is expected to extend to the 3400-3420 area.
🚀 BUY 3375-3360
🚀 TP 3390-3395

Correction first and then rise during the day, TP3400Yesterday, gold hit the bottom near 3350 and then quickly rose to break the high. It fell back slightly in the evening and closed with volatility. The daily line closed with a long lower shadow bullish line. The short-term correction process has been completed, and there is still momentum for an upward impact. The overall structure is still a bullish trend. Focus on 3365-3355 below. As long as the bullish thinking above this level remains unchanged, any decline will provide an opportunity to enter the market. The target can be around yesterday's high of 3390. Once it breaks through 3390, the gold price is expected to reach 3405-3415.
OANDA:XAUUSD

Gold Bounces from PRZ — Is a Short-Term Rally Underway?Gold ( OANDA:XAUUSD ) started to rise from the Support zone($3,307-$3,275) as I expected in the previous idea .
Gold is currently moving near the Support zone($3,350-$3,326) , Potential Reversal Zone(PRZ) , and $3,334 (Important price) .
From the Elliott wave theory , it seems that Gold has completed its 5 impulsive waves and now we should wait for corrective waves . Corrective waves can complete at the Potential Reversal Zone(PRZ) .
I expect Gold to rise to $3,383(at least) in the coming hours .
Second Target: $3,396
Note: Stop Loss (SL) = $3,321
Gold Analyze (XAUUSD), 1-hour time frame.
Be sure to follow the updated ideas.
Do not forget to put a Stop loss for your positions (For every position you want to open).
Please follow your strategy; this is just my idea, and I will gladly see your ideas in this post.
Please do not forget the ✅ ' like ' ✅ button 🙏😊 & Share it with your friends; thanks, and Trade safe.

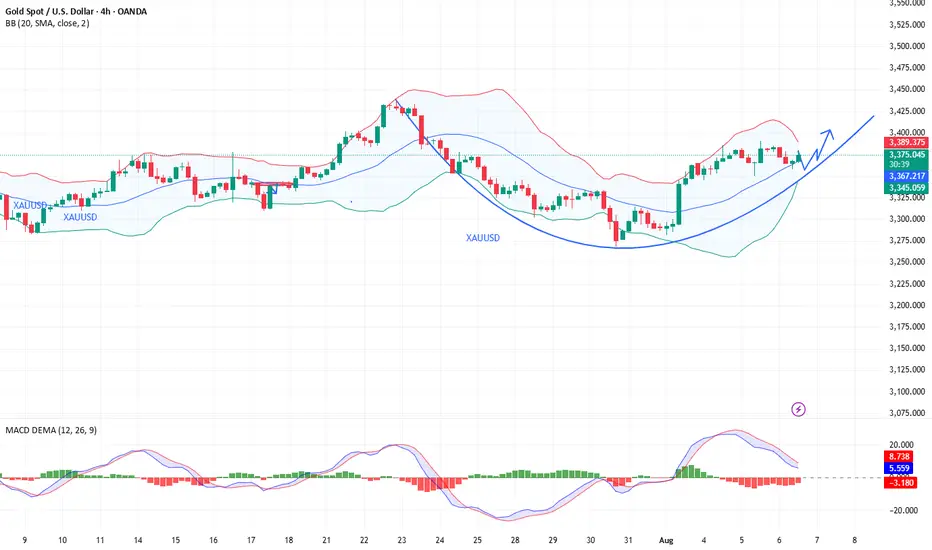
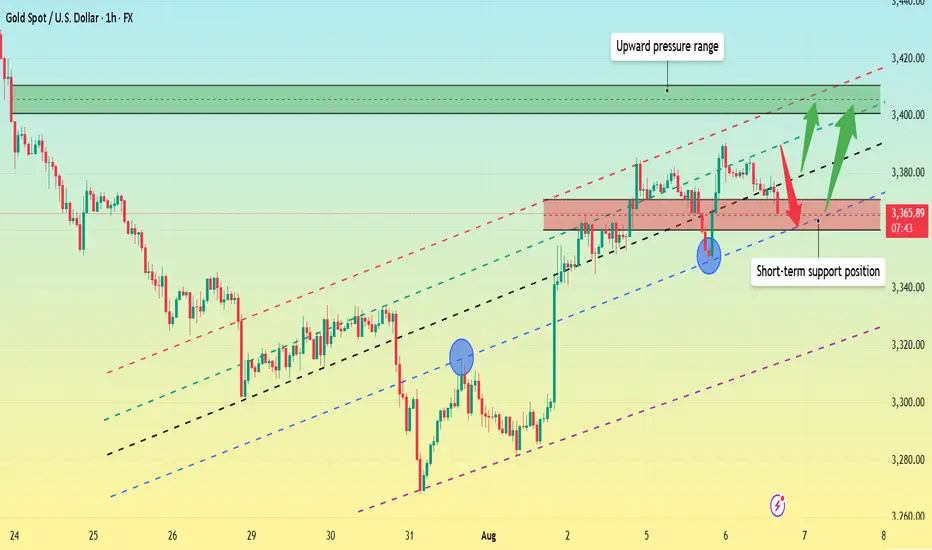
Gold retreats. Is it gathering upward momentum?
The 4-hour chart shows a clear market trend. On Tuesday, gold reached a high near 3390, and it's now firmly above the 4-hour trendline. The retracement reached a low near 3350, essentially completing the correction. Therefore, today's upward trend is likely to continue, aiming for new highs. The current resistance level is around 3400-3410.
From the 1-hour chart, key support lies between 3370-3360. Quaid believes that today's price must not fall below 3360. If it falls back below 3360, it's likely to retest the low of 3350.
However, as long as it remains above support, gold will remain in an upward trend. Upward resistance lies around 3400-3410.
Trading strategy:
Go long near 3360, stop loss at 3345, profit range 3380-3400.
Short near 3390, stop loss at 3410, profit range 3380-3370-3360.
The shot at the critical moment is the real trading opportunityGold bottomed out and rebounded yesterday, breaking the high slightly to touch 3390 before falling back. The daily line closed with a small bullish cross overnight, and the upward momentum has slowed down. Today it tends to fluctuate at a high level. In the 4H cycle, the Bollinger band is closing, and the overall bulls continue to run upward. The big positive line directly pulls up, which is relatively strong. The overall market is resistant to declines. Therefore, the big cycle does not expect a big drop for the time being, but the short-term trend fails to continue further. It is safe to maintain a pullback and go long. Pay attention to the support below 3365-3350. Go long after it stabilizes. First look at yesterday's high of 3390. If it breaks, there is a probability of going to 3400 or even around 3415, but be careful of a high rush and fall.

GOLD BUY INTACTFinal bullrun towards 34xx plus is remaining to complete ite wave before goes sideways to decide either going down or ATH

GOLD RISING AGAIN1. MA20 on weekly held the price again
2. Gold is making Higher Lows in a row
3. 100 days of sideway movement
Now its time for $4000 in my opinion

XAU/USD Intraday Plan | Support & Resistance to WatchGold is holding above the $3,369 level after rejecting from the $3,387 resistance zone. Price action remains bullish for now, with structure supported by the rising 50MA, which is acting as dynamic support.
To extend higher, bulls need a clean break and hold above $3,387, which would open the path toward $3,422 next.
If price fails to hold above $3,369, we could see a pullback into the $3,358–$3,344 zone, which remains the first key support. Below that, the next area of interest is the Pullback Zone at $3,329–$3,313 — a former resistance turned support, and a likely area for dip-buying interest.
A break below that would shift focus to the Secondary Support Zone at $3,295–$3,281, where price last launched its breakout.
📌 Key Levels to Watch
Resistance:
‣ $3,387 ‣ $3,422
Support:
‣ $3,369 ‣ $3,358‣ $3,344‣ $3,329–$3,313‣ $3,295–$3,281
🔎Fundamental Focus:
No high-impact data today, but markets may remain reactive.

Gold is waiting to break through near the dense pressure rangeGold (XAU/USD) prices fell slightly during Wednesday's Asian trading session, retreating to around $3,370, snapping a four-day winning streak. Previously, gold prices had hit a nearly two-week high on Tuesday.
Gold's recent rally was driven by the Federal Reserve's policy outlook and safe-haven flows, but a recent shift in market sentiment toward optimism and a slight rebound in the US dollar index have put downward pressure on gold prices.
Risk assets generally rose, including a rebound in Nasdaq futures, temporarily cooling demand for safe-haven assets. Furthermore, the dollar's slight rebound also put pressure on non-interest-bearing gold.
Weak US data heightened economic concerns, supporting expectations of a rate cut this year.
Last Friday's weaker-than-expected US non-farm payroll data, coupled with Tuesday's release of the July ISM Services PMI, which fell to a multi-month low of 50.1, have fueled market concerns about the US economic outlook.
"Both the weak employment index and new orders suggest weakening momentum in the services sector, further strengthening the likelihood of a September rate cut by the Federal Reserve," analysts noted.
The market currently expects the Federal Reserve to implement a 25 basis point interest rate cut at its September policy meeting, with the possibility of a total rate cut exceeding 50 basis points this year. While this expectation has dampened dollar bullish sentiment and provided support for gold, the optimistic stock market sentiment has weakened gold's appeal as a safe-haven asset.
In trade-related news, the US President announced a new round of tariffs on imported semiconductors and pharmaceuticals, accelerating the pace of tariffs on areas such as automobiles, steel, and aluminum.
This move has heightened market concerns about global supply chain risks, maintaining cautious investor sentiment and potentially providing safe-haven support for gold in the medium term.
From a technical perspective, gold prices encountered clear resistance before reaching the $3,400 mark and failed to break through, shifting into a short-term consolidation pattern.
The 4-hour chart shows that gold found support at the 100-period simple moving average (around $3,350) and rebounded, indicating that bulls are still trying to maintain the initiative.
"Currently, hourly and daily oscillators remain positive, but if gold fails to hold above $3,400, it is likely to remain volatile in the short term," market participants noted.
Upward resistance lies at the key resistance zones of $3,400 and $3,430, respectively. A break above this would open an upward trend, targeting the all-time high of $3,500 reached in April.
Initial support lies at $3,350. A break below this would target the intermediate support of $3,322 and the $3,300 mark. A further break below this level could test the one-month low of $3,268.
Although gold prices are currently under short-term pressure, they remain supported in the medium term amidst a slowing US economy, rising expectations of interest rate cuts, and ongoing potential trade frictions. In the short term, the price is expected to fluctuate around the $3,400 level. Focus on speeches by Federal Reserve officials and next week's US CPI data, which may provide new direction for gold. OANDA:XAUUSD VELOCITY:GOLD EIGHTCAP:XAUUSD CMCMARKETS:GOLD PYTH:XAUUSD ACTIVTRADES:GOLD FX:XAUUSD

Gold is strong. Is a round number nearing its high?Information Summary:
On Tuesday, Trump made a splash. He announced four nominees for the next Federal Reserve Chair, removing Treasury Secretary Bensont from the list. He also announced tariffs on semiconductors and pharmaceuticals next week, warned of increasing tariffs on Indian goods "within the next 24 hours," and threatened to impose a 35% tariff on the EU if it failed to fulfill its obligations.
As a result, gold rose nearly $30 from its intraday low of $3,350, briefly breaking above $3,380.
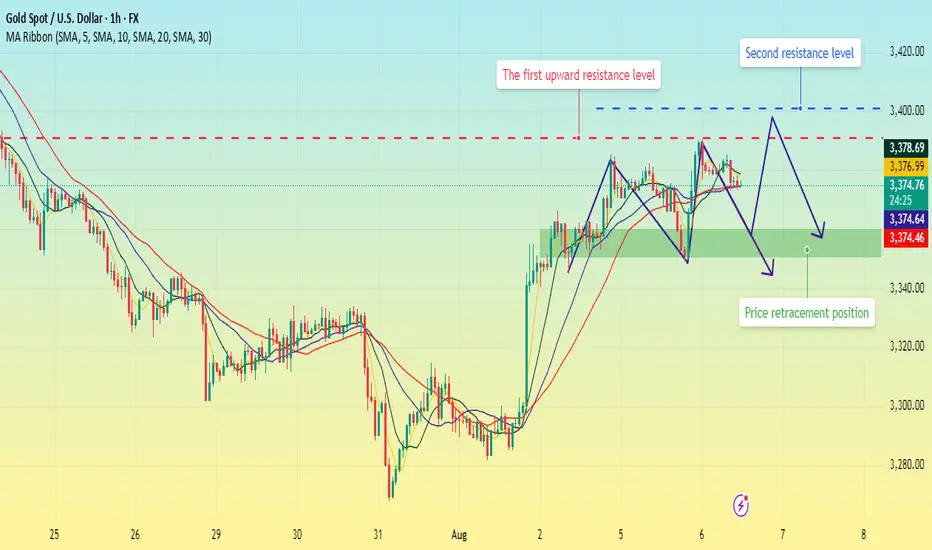
Market Analysis:
Gold has been trending upwards since the start of the week, with four consecutive daily gains, indicating a gradual buildup of bullish momentum. Judging from the 1-hour moving average indicator, the MA5 and 10 moving averages are currently turning downward, while the 20 and 30 moving averages are moving flat, which indicates that the overall short-term market trend is waiting for a price correction. Quaid believes investors should wait for the price correction to complete before entering a long position.
The key short-term trend is Tuesday's low of 3350. If gold prices hold above this level, we should maintain a positive outlook in the short term. The first resistance level above is near Tuesday’s high of 3390; the second focus is on the 3400 integer mark.
Trading strategy:
Short around 3395, stop loss at 3405, profit range 3370-3350
Long around 3350-3360, stop loss at 3340, profit range 3370-3390.
Gold surges! Gold prices rise for four consecutive days!Market News:
Spot gold prices fluctuated narrowly in early Asian trading on Wednesday (August 6), currently trading around $3,380 per ounce. London gold prices continued their upward trend on Tuesday, with international gold prices continuing to rise, reaching a near two-week high. This marked four consecutive days of gains, demonstrating strong upward momentum. Amid rising market expectations for a Federal Reserve rate cut and Trump's upcoming announcement of key Fed appointments, gold's safe-haven and policy-sensitive properties have resurfaced, making it a prime target for capital inflows. The core logic behind gold's current rally remains centered around expectations of a shift in the Federal Reserve's monetary policy. Traders generally expect two rate cuts this year, with the first likely to occur in September. Several regional Federal Reserve chairmen have also signaled dovish sentiment, boosting gold prices. Furthermore, stable US Treasury yields and a weaker US dollar index have also bolstered gold's gains. Amidst weakening economic data, a shift in Federal Reserve policy, geopolitical tensions, and government intervention, gold has once again taken center stage in investors' attention. Whether it's short-term expectations of interest rate cuts, uncertainty surrounding the Fed's personnel, or the combined effects of medium- to long-term debt, policy, and global uncertainty, gold's dual attributes of "hedge and safe haven" continue to strengthen. Closely monitor expected changes in CPI data, progress in trade negotiations, and Fed appointments, and pay attention to speeches by Fed officials!
Technical Analysis:
Gold's technical outlook remains positive on both the daily and weekly charts, with consecutive daily gains. The price is trading within the upper middle Bollinger Band, with the 10-day and 7-day moving averages forming a golden cross. The RSI is trading above its mid-axis, and the MACD momentum bar is showing strong volume above its zero axis. On the short-term four-hour and hourly charts, the price is trading within the upper middle Bollinger Band, with the moving averages forming a golden cross and the RSI pointing upwards. The trading strategy remains unchanged: buy low on pullbacks, with selling high as a secondary strategy. Gold fell before rising yesterday, breaking through the intraday high during the US trading session and rising as high as 3390, closing with a doji with upper and lower shadows. As expected in the early review, the current trend shows no change in the buying trend, with the moving averages in a buying pattern. However, the four-hour chart is approaching the acceleration line, creating downward pressure. Therefore, it is in a short-term buying risk zone, and buying at high levels is no longer advisable! The hourly chart is flat, closing below the upper line. Although it hasn't broken below the moving average, the indicator has turned. Today's forecast is a repeat of yesterday's, with a correction followed by an upward trend. Therefore, the overall outlook is for a correction followed by continued upward movement!
Trading strategy:
Short-term gold: Buy at 3357-3360, stop loss at 3349, target at 3380-3400;
Short-term gold: Sell at 3390-3393, stop loss at 3402, target at 3360-3350;
Key points:
First support level: 3370, second support level: 3362, third support level: 3350
First resistance level: 3390, second resistance level: 3398, third resistance level: 3408

XAU/USD(20250806) Today's AnalysisMarket News:
The US non-manufacturing PMI fell to 50.1 in July from 50.8 in June, below the expected 51.5. The ISM New Orders Index fell to 50.3 in July from 51.3 in June, with export orders contracting for the fourth time in five months.
Technical Analysis:
Today's Buy/Sell Levels:
3373
Support and Resistance Levels:
3413
3398
3389
3358
3348
3333
Trading Strategy:
If the market breaks above 3389, consider entering a buy position, with the first target at 3398. If the market breaks below 3373, consider entering a sell position, with the first target at 3358.

Gold continues its upward trend. A strong week ahead?Gold's technical outlook on the daily chart maintains a bullish structure, with prices trading within the upper middle Bollinger Bands. The 7-day and 10-day moving averages have formed a golden cross, and the RSI indicator is trading above its mid-axis.
The short-term 1-hour chart shows prices trading within the upper middle Bollinger Bands, with the moving averages forming a golden cross and the RSI indicator pointing upwards. Quaid believes that the trading strategy for Wednesday remains unchanged, with the main focus on low-level long positions during pullbacks, supplemented by high-level short positions.
Gold initially fell before rising on Tuesday, breaking through the intraday high and touching the 3390 level. It closed with a doji with upper and lower shadows. The current bullish trend remains intact, with the moving averages in a bullish formation. However, the 4-hour chart is approaching the acceleration line, creating downward pressure. This suggests a short-term bullish risk zone, and it is advisable to avoid buying at high levels. The hourly chart showed a sideways trend, closing below the upper line. While it hasn't broken below the moving average, the indicator has turned. Therefore, based on the overall market trend today, Quaid believes there's a high probability of further upward movement after a correction.
Trading Strategy:
Long at 3355-3360, stop loss at 3345, profit range 3380-3400;
Short at 3390-3395, stop loss at 3405, profit range 3360-3350;
Key Points:
First Support Level: 3370, Second Support Level: 3360, Third Support Level: 3350
First Resistance Level: 3390, Second Resistance Level: 3400, Third Resistance Level: 3410
