(XAU/USD) Buy Trade Setup – Entry, Target & Risk Management PlaEntry Point:
3,140.34 USD
This is the suggested level to enter a long (buy) trade.
Stop Loss (SL):
3,121.66 USD
A protective level to limit losses if the trade goes against the setup.
Target Point (Take Profit - TP):
3,251.33 USD
This is the EA target point — where profits are expected to be taken.
---
3. Risk/Reward Ratio:
Risk: From 3,140.34 to 3,121.66 = 18.68 points
Reward: From 3,140.34 to 3,251.33 = 110.99 points
Risk/Reward Ratio ≈ 1:6, which is very favorable.
4. Resistance Point:
Around 3,222.45 - 3,227.27
This area might act as a challenge for price movement, potentially leading to temporary retracements.
5. Indicators:
Moving Averages: Red (shorter period) and Blue (longer period) lines help indicate trends.
The price is moving above the short-term MA but currently under the long-term MA, which might suggest a short-term bullish move within a broader downtrend or sideways range.
Conclusion:
This is a bullish setup, anticipating a reversal or continuation to the upside after a pullback:
Buy Zone: 3,140.34
Stop Loss: 3,121.66
Take Profit: 3,251.33
If the price drops to the entry point zone
Goldpreis

3235 line becomes short-term resistance? Golden layout at night!🗞News side:
1. Trump's dialogue with Russia and Ukraine on ceasefire
2. The seriousness of the situation in Israel
📈Technical aspects:
In the short term, the three key factors affecting the gold market are the certainty of tariff policies, geopolitical risks, and the pace of the Fed's interest rate cuts. The Russian-Ukrainian conflict is a tail risk that deserves attention. Its impact on the global order far exceeds other geopolitical conflicts. It is expected that the conflict may see a key turning point in May and June, and the Fed's interest rate cut is likely to be implemented in the third quarter. At that time, the gold and silver markets may face greater negative pressure, and prices may fall back to 3000-2800 or even lower. Technically, the double top pattern at the daily level has been established. Although there is a certain resistance at the 3235 line of gold in the short term, considering the tail risk, the possibility of evolving into a triple top cannot be ruled out, and we need to be vigilant against the inducement of multi-money rises and washes.
🎁BUY 3220-3215
🎁TP 3230-3240
🎁SELL 3250-3255
🎁TP 3235-3225
If you agree with this view, or have a better idea, please leave a message in the comment area. I look forward to hearing different voices.
OANDA:XAUUSD FX:XAUUSD TVC:GOLD FXOPEN:XAUUSD FOREXCOM:XAUUSD

Gold fluctuates. Will it break through resistance and start to rWe analyzed the fundamentals and technical aspects comprehensively over the weekend, and the overall trend tends to be upward.
The Asian market opened, and the price rose to around $3,250 and fell back; in yesterday's analysis, I thought that the Asian market would rise rapidly after the opening due to the impact of the US sovereign credit rating. As I predicted, the opening in the morning quickly rose to the intraday high of $3,250, and then began to fall. Finally, it fell to $3,210 and strengthened again, and the trend was the same as my analysis.
From the current market, gold continues to fluctuate greatly. It is relatively strong at present, but it is suppressed by the $3,250-3,255 area. Therefore, it is expected that the price will continue to rise after adjustments below $3,250; if the price stabilizes above $3,210, there is still room for the price to rise. Below this, it will start a downtrend that could potentially hit last week’s cycle low of $3,150.
In the short term, we need to pay attention to the support level of $3225. If it breaks through the resistance level of $3250-55, it will open up room for growth. We will further pay attention to the high point of $3270-3290.
Until the price breaks through the upward resistance zone of $3250-3255 with a strong force, it is recommended not to adopt a long strategy.

Bet on a short position near 3265!
On Monday, the international gold price rose again by more than 1%. Benefiting from the weaker US dollar and the boost of safe-haven demand, gold first fell to 3206 and then rebounded to 3250, reversing the decline in the early trading. Gold has been under pressure in recent weeks because the market has gradually digested the expectation of stagflation and repriced the expectation of interest rate cuts. The market currently expects the Federal Reserve to cut interest rates by about 58 basis points by the end of the year, while the expectation at the peak of panic in April was as high as 120 basis points.
Views on the trend of gold in the evening!
The market trend in the past few days is a little speechless for friends who like unilateralism. The market is nothing more than falling or rising first, but basically it rises as much as it falls, and it always fluctuates back and forth in a range. This is actually quite similar to the trend last week. It is nothing more than not as drastic as last week. Tonight, I still prefer to see shocks rather than breakthroughs! The upper resistance is at the previous high of 3265±3, and the lower support is to continue to look at the 3200 integer mark!
From the hourly chart, the step-by-step rise is quite obvious, but the first resistance is at 3251. Only after the rise can we continue to see the suppression of 3265. So for today, the position near 3251 is the first attempt at short positions, and the second is 3265. If the rebound is in place, we will continue to play a short position. It is not a big problem to see a profit of 20 to 30 points. If it falls directly below 3200, there will be more room for surprises!
Gold: Short when it rebounds near 3251, defend above 8 US dollars, and if you are prudent, just wait for 3265, and target the 3230-20 line!

Gold is rising strongly? Beware of a sharp rise to the high poinThe US sovereign credit rating was downgraded from AAA to Aa1; affected by this, gold opened sharply higher in the Asian market on Monday, and the highest so far is around 3250.
However, 3250 is not the high point at present, and it is only warming up in the Asian market. The important thing should be in the European and American markets. Such a major breaking news must be seen in the US stock market.
If gold can continue to rush above 3250 in the short term, then we will see 3280-3300 later. It is not ruled out that the Asian market will continue to fluctuate sideways in the short term, but I think it will still rise. The high point of 3250 may be broken at any time.
From the 4-hour chart:
This K line is very strong. Once this K line closes above 3230, the highest high point can be seen from the 4-hour chart here.
Judging from the current trend, I think the gold price is bullish as long as it is above 3200 in the Asian market. The lowest price in the Asian market in the morning retreated to around 3210, so it is not known whether it will retreat to around 3200.
Then, for the short-term strategy, you can go long around 3210, with 3200 as the stop loss position. As long as the upper target stands at 3250, you can continue to see the profit range of 3280-3300.

XAU/USD) back up Trand analysis Read The ChaptianSMC Trading point update
Technical analysis for XAU/USD (Gold vs. US Dollar) on the 4-hour timeframe suggests a bullish reversal setup from a key support zone. Here's a breakdown of the idea:
Key Observations:
1. Support Zone (Yellow Box at ~3,100–3,140):
The price recently touched a significant support area marked by multiple previous bounces (green arrows).
The latest green arrow shows a bullish reaction from this zone, indicating potential for an upward move.
2. Resistance Zone (~3,220–3,250):
This intermediate zone is expected to be the first area of interest for bulls.
The analysis suggests a brief pullback or consolidation before continuation.
3. Target Point (~3,375):
The chart outlines a projected move to around 3,375, aligning with a previous supply zone and the upper channel line.
This is likely the main target for a swing trade.
4. EMA 200 (Blue Line - ~3,221):
Price is hovering around the 200 EMA, acting as a dynamic resistance.
A breakout above this would add bullish confirmation.
5. RSI Indicator (~41):
RSI is recovering from an oversold region (~38), indicating potential momentum building for a reversal.
Mr SMC Trading point
---
Conclusion:
This is a bullish reversal setup with:
Entry zone: Around 3,120–3,140
Short-term resistance: ~3,220–3,250
Final target: ~3,375
Invalidation: A clear break and close below the yellow support box (~3,100)
Pales support boost 🚀 analysis follow)

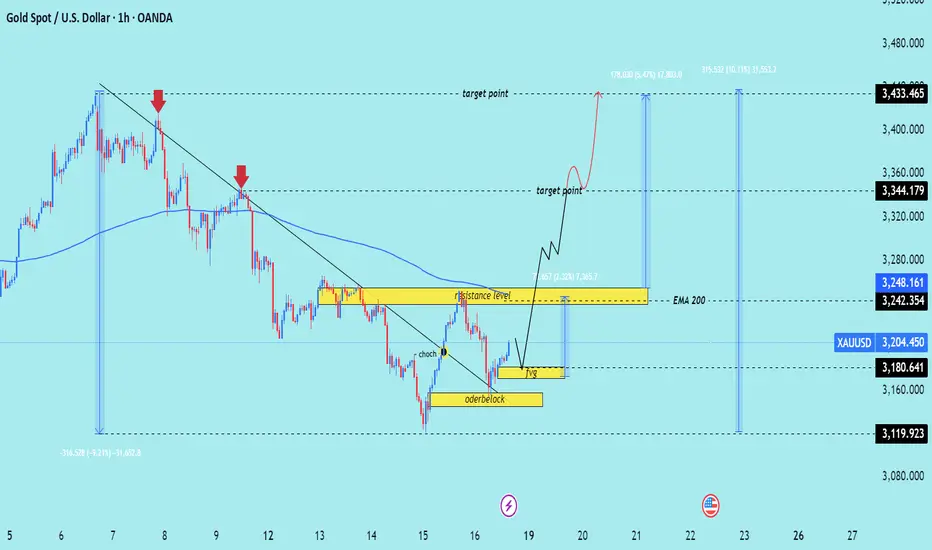
XAU/USD) bullish trend analysis Read The ChaptianSMC trading point update
Technical analysis of XAU/USD (Gold Spot price against USD) on a 1-hour timeframe, featuring a Smart Money Concept (SMC) approach. Here's a breakdown of the key ideas presented:
---
1. Downtrend & Trendline Break
The chart initially shows a downtrend with two red arrows marking lower highs.
A trendline is broken, indicating a potential shift in market structure.
CHOCH (Change of Character) is labeled — a key SMC concept signaling a reversal from bearish to bullish structure.
---
2. Orderblock & FVG (Fair Value Gap)
A bullish orderblock is highlighted, indicating an area where institutional buying may have occurred.
A Fair Value Gap (FVG) is shown, which often acts as a magnet for price to fill inefficiencies before continuing in the intended direction.
---
3. Resistance & Target Zones
A resistance level is marked near 3248–3250, which price may revisit and possibly break.
Two target points are identified:
First target: ~3344
Final target: ~3433
---
4. EMA 200
The EMA 200 is acting as dynamic resistance; a break above it adds confluence to the bullish bias.
---
5. Expected Move
The analysis anticipates:
1. A pullback into the FVG or orderblock.
2. A bullish continuation after mitigating those zones.
3. Price aiming for the resistance and eventually the upper targets.
Mr SMC Trading point
---
Conclusion
This is a bullish outlook based on a structural break (CHOCH), institutional demand (orderblock), and gap-filling logic (FVG). The price is expected to pull back slightly and then rally toward the 3344 and 3433 levels if it holds the orderblock zone.
Pales support boost 🚀 analysis follow)
XAUUSD Bearish Setup with Key Entry, Stop Loss & Target LevelsEA GOLD MAN XAUUSD
Entry Point: $3,235.94
Stop Loss: $3,235.94 (above current price, suggesting a SELL trade)
Target Points:
EA Target Point (Downside): $2,974.71 (Short target)
EA Target Point (Upside): $3,505.03 (Long target — likely alternate scenario)
Resistance Level: $3,121.49
Nearby Support Zone: Around $3,000–$2,975
📉 Trade Strategy Implied
This appears to be a short position setup:
Sell at: ~$3,220–$3,235
Stop Loss: $3,235.94
Take Profit: $2,974.71
Risk/Reward Ratio: ~1:3 (very favorable setup if thesis holds)
The upside target ($3,505.03) might be for a different scenario — if price reverses and breaks above resistance.
🧠 Market Structure Observations
Trend: A bearish break from a previous ascending channel.
Momentum: Price has bounced slightly after hitting support, but the moving averages suggest bearish momentum may persist.
Key Risk: If price breaks above $3,236 convincingly, it could invalidate the short setup and trigger a bullish run.
📌 Summary
Bias: Bearish (based on current setup)
Setup: Short with tight stop above resistance
Confirmation Needed: Watch for rejection at the $3,220–$3,236 zone and a breakdown below $3,200 for follow-through.

Moody's downgrades US credit rating, will gold be affected?Information summary:
At about 4:43 pm on Friday (the last minute before the market closed), Moody's downgraded the US sovereign credit rating from AAA to Aa1 on the grounds of "surge in debt and fiscal out of control", ending the US's last "top credit" title among the three major rating agencies.
Perhaps considering reducing the impact, Moody's announced this news after the US stock market closed. But at this time, gold, foreign exchange and other markets still have more than ten minutes of trading time. The 10-year US Treasury yield once rushed from 4.44% to 4.49%, the US dollar index fell, and gold rushed up.
The downgrade is a super-class data, which may cause gold to rebound in stages, but not continuously. If nothing unexpected happens, after the adjustment, gold may continue to retreat in a trend.
Technical analysis:
Next week, gold may rebound in stages to 3330-3340. Then there may be a trend decline again, and I estimate that it may test around 2950 below. As for why it went to 3330-40, here is an analysis:
I think the current gold trend is very similar to the holiday trend in Asia from May 1st to 5th. It also fell sharply, then bottomed out and rebounded, and then stretched up again. I also drew it in the picture, which is basically consistent with the current trend. If the next market trend is copied from the previous paragraph, then I think it should test the 3330-40 point.

Gold ended this week successfully!In terms of news, first, the easing of the trade situation weakened the safe-haven property of gold. Secondly, a series of data released this week and the Fed's emphasis on not rushing to cut interest rates also suppressed the gold price. In addition, the parties involved in geopolitical conflicts also began talks. Although there are differences in negotiating positions, they still have to solve the problem when they can sit down and talk. Because of the repeated news, the closing price at the end of the week was also above 3200, so some people still believe that the gold price will go to 3500, and even think that it will exceed this position. I have mentioned this in my previous analysis. The gold price was first stimulated by multiple news and buying rushed up. Now that the risk aversion has receded, I think it is reasonable to see the gold price fall.
Let's analyze it from the technical side: the rhythm of gold has changed rapidly recently, and next Monday is actually the key. The 1-hour moving average of gold has begun to show signs of turning around, so whether it can form a golden cross upwards is the key next time, or it will oscillate a few times and continue to diverge downward. The strength of gold on Monday is very critical. Gold closed with a big positive line on Thursday, which was a very fast trend. However, it fell directly on Tuesday and broke through more than half, so it cannot be said that the bulls are strong. Although it rebounded slightly in the late trading, it still closed with a big negative line. There will be two key positions on Monday next week. Pay attention to 3180 on the bottom of gold. If it falls below 3180 soon after the opening on Monday, then gold will still be weak as a whole. Pay attention to 3215 on the top. If gold breaks through 3215, then gold will be strong as a whole. If gold opens flat on Monday and the upward momentum is not strong, and it is under pressure at 3215, then you can continue to go short in the short term.
TVC:GOLD OANDA:XAUUSD FOREXCOM:XAUUSD

Gold fluctuates greatly. What will happen next week?Gold fluctuated greatly on Thursday and Friday. It is difficult to implement an operation strategy in this market. It is difficult to go short or long. The market does not continue the next day, and there are few suitable trading opportunities in the process of changing the market. So what should gold do next week? Has the rhythm of gold changed again?
The rhythm of gold has changed rapidly recently, and next Monday is actually the key; the 1-hour moving average of gold has begun to show signs of turning, so whether it can form an upward trend is the next key.
The strength of gold on Monday is very important. Gold closed with a big positive line on Thursday, but it fell directly on Tuesday and pierced the support level, which cannot be said to be completely bullish. Although it rebounded slightly in the late trading, it still closed with a real big negative line.
Next week, we need to pay attention to two key positions. Pay attention to $3175 below. If it falls and breaks quickly after the opening on Monday, then gold will still be weak overall; pay attention to $3215 above. If gold breaks through this point strongly and stabilizes above the point, then gold will be strong overall.
If gold opens flat in early trading on Monday and the upward momentum is not strong, then you can continue to short in the short term.

Gold still has room to fall and rebounds to continue to shortGold fell as expected in the Asian session, which was in line with our thinking and expectations. Our short position was shorted near 3237-38 and exited with profit, and then shorted near 3194 and exited with profit again, and we made good profits both times. There are many people who followed the trend and went long in today's market, or even chased the long position, and without exception, they were trapped and wailing. We have repeatedly emphasized that we should treat it with a sweeping approach, and different market rhythms should be responded to with different methods. Judging from the current market trend, the European session continues to weaken. The focus should be on the gains and losses of 3180 support. If it breaks through, it will continue to look at 3150 and 3120. In this case, the short-term will return to weakness. If it does not break, we will look at a wide sweeping range. The upper pressure will focus on 3200, 3215, and 3230. The rebound will be mainly high. The weekly line will be closed tonight, and volatility will intensify.

XAUUSD TRADE Entry from Support with Targets at 3,347 and 3,503Entry Point: 3,219.45
Stop Loss: 3,171.35
Target Point One: 3,347.49
EA Target Point (Final Target): 3,503.87
Trade Plan:
Risk Zone: Between entry (3,219.45) and stop loss (3,171.35). The trader risks roughly 48.1 points.
Reward Zone: From entry to:
Target Point One: ~128 points.
Final Target (EA Target): ~284.4 points.
Risk-Reward Ratios:
To Target Point One: ~2.66:1
To EA Target Point: ~5.9:1
Indicators and Signals:
Price appears to be bouncing off a support zone near 3,212–3,219, indicating a potential reversal.
200 EMA (blue) and 50 EMA (red) are shown; price is slightly above the 200 EMA, suggesting long-term support.
There is a downtrend before the bounce, so this might be a counter-trend trade or the start of a new trend.
Summary:
This setup is a classic bounce from a demand/support zone with a clear upside potential. The risk is tightly managed, and the reward is significantly higher, aligning with favorable risk-reward principles. However, the position is speculative and relies on bullish follow-through from the support level. Watch price behavior near the 3,288 and 3,347 resistance zones to assess momentum.

XAUUSD remains bearish unless it breaks 3265🗞News side:
1. India considers using new Indus River project to cut water supply to Pakistan.
2. Pay attention to the news of Russia-Ukraine ceasefire negotiations today
📈Technical aspects:
Today's opening correction is due to technical repair and adjustment, which is why I shorted. The support of 3200-3210 is of great significance to the short-term trend. If it can be supported here again, it may further promote the upward expansion space. However, after the rebound in the morning Asian session, it did not break through the 3265 line. On the contrary, the bulls began to weaken. Today is Friday, and the market is not expected to show a unilateral strong attitude. It will be treated as a shock during the day. Before breaking through 3265 above, we can short at a small level during the intraday rebound. Short-term operation suggestions, temporarily look at 3235-3240 on the upper side, and look at the support of 3210-3200 on the lower side.
If you agree with this view, or have a better idea, please leave a message in the comment area. I look forward to hearing different voices.
FOREXCOM:XAUUSD FXOPEN:XAUUSD TVC:GOLD FX:XAUUSD OANDA:XAUUSD

Gold has a strong deep V, 3200 support is good for longThe 1-hour moving average of gold begins to turn and continue, so the momentum of gold bears begins to weaken, and gold bulls may begin to exert their strength. However, gold started to rise all the way from 3120 to 3252 yesterday. Gold rose by about 130 points, so the volatility began to increase. Therefore, we must wait patiently for gold to adjust. Because of such a large fluctuation, an adjustment will also be tens of dollars. We must wait patiently for the adjustment and stabilize before going long. After gold breaks through 3192, it is considered a strong deep V breakthrough of important resistance. Then 3192 of gold has now become an important support level. If it falls back to 3192 in the Asian session, go long on dips. If gold falls back to near the 3200 mark, you can try to go long.
Since gold has started to reverse strongly, gold bulls have begun to show their muscles. In the short term, we should not be stubbornly bearish anymore. We should be flexible and adapt to the market. The market is like this, changing rapidly. We should adapt to the market and not be too obsessed with bears or bulls. Obsession is a trap. Gold bulls are strong now, so gold is now the home of bulls. Go long when the Asian session falls back.

Gold price rises and then sells off?Information summary:
Yesterday morning, gold prices soared due to the impact of international news, hitting an intraday high of $3,253.
On Friday, Asian time, gold suddenly fell rapidly in the short term, and the price of gold currently fell to around $3,215/ounce, a sharp drop of nearly $28 in the day.
Gold price targets higher, but the bullish potential is limited in the short term. The focus will be on the preliminary value of the University of Michigan Consumer Confidence Index in May.
Technical analysis:
Looking at the daily chart, gold prices rose on Thursday, but both the high and low points of the day moved down from the previous trading day. On the other hand, the 20-day moving average eased down to around $3,305/ounce, while the 100-day and 200-day moving averages maintained an upward tilt at a level far below the current gold price. Finally, the trend of technical indicators is upward, but it is still below the previous intraday high and in the negative range, which shows that buyer sentiment is not very high.
The short-term trend shows that gold buyers still lack full confidence.
You need to pay attention to the important support and resistance levels:
Support level: $3,200; $3,175; $3,160.
Resistance level: $3,230; $3,245.
Operation strategy:
Buy around $3,200, stop loss at $3,190, and profit range at $3,250-3,280.

Gold is abnormal, we still need to go long when we find an oppor
Gold has a perfect V-shaped reversal today. It opened at 3177 and fell unilaterally in the Asian session. It hit 3120 at noon and then rose slowly. As of the time of writing, it has completely recovered the decline and is currently trading around 3195. I have analyzed the European session. After the gold price broke through the extreme drop of 3200, it needs to be repaired, but it has taken another rebound correction. The analysis also gave attention to 3156 to 3168 to continue to be bearish. With the slow rise and break, the bearish view is invalid. Now make a new analysis.
Since the gold price has been rising slowly since 3120, let’s not guess whether this wave of upward movement is a rebound or a trend reversal. In terms of operation, I suggest to follow the trend and look at its upward movement first. Because we have analyzed the general trend before, it is still in the second wave of decline since the high-level decline and has not reached the trend target; secondly, the rebound of 70 points from the low level is not enough to judge the trend reversal. So first pay attention to the stagflation after this wave of slow bull trend and then make a trend judgment.
At the hourly level, the gold price has been rising slowly since the opening of the US market. This slow rise is generally not a top. We will wait for a correction and break through the previous hourly K before analyzing it. In terms of specific operations, we can first follow the trend and enter the market with long orders, with protection at 3176. The upper target is 3110. After breaking through, wait for a correction of 8-10 points to continue to go long and look at 3239. Then pay attention to whether the 3200 mark can be stabilized at the close of today, which is related to our layout ideas at the end of the week.

Gold changes trend? Latest analysis.Information summary:
Due to the easing of trade tensions between the world's two largest economies; suppressing safe-haven demand, and investors waiting for US economic data for more clues on future interest rate trends. On Thursday, Asian time, gold prices fell to their lowest point in more than a month. At one point in the session, it hit the lowest level since April 10 at $3,120. The price has now rebounded to around $3,190.
Technical analysis:
Gold once again showed a trend of falling first and then rising, basically swallowing up all the declines in the Asian market. Is gold about to start a new round of rise? I don't think it is possible to judge that the upward trend is established now. Because from the weekly line, the price rushed up and fell back, and the more obvious signal is that it will fall again.
From the daily rhythm, today fell first and then rose, and the short-term rise was strong, swallowing up all the declines in the Asian session and there are signs of continued rise. But in terms of rhythm, the watershed of the Asian session's decline is the integer mark of 3,200. If it continues to be suppressed below the watershed, the market will still fall.
Operation strategy:
Short around $3205, stop loss at $3215, profit range at $3180-3175.
If the gold price breaks through the $3,200 resistance with strength and stays above this level, we need to change our strategy.

Gold prices fell by more than $50. Two news will be released.At the end of the Asian session, gold accelerated its decline, with the lowest price falling to around $3,123, and plummeting more than $50 during the day.
Gold prices continued to fall in the Asian session and were under pressure from multiple factors. Optimism about Sino-US trade weakened gold's safe-haven effect. In addition, reduced bets on the Fed's rate cuts and rising US Treasury yields are also not conducive to gold prices.
There are two pieces of news to pay attention to in today's trading market.
1. At 8:30 a.m. US time, the U.S. Census Bureau will release April retail sales data.
2. At 8:40 a.m. US time, Federal Reserve Chairman Powell will deliver an opening speech at the second Thomas Laubach Research Conference. (This conference will focus on research on monetary policy and economics, and is expected to provide an academic perspective for the Fed's commitment to review the monetary policy framework every five years.)
Trading analysis:
Gold prices have just fallen below the $3,140 support level, which makes gold prices vulnerable. Some follow-up selling could push gold further towards $3,100; if it falls below this level, gold could target $3,060.
On the upside, if gold prices rise back above the $3,160-3,170 area, it could face strong resistance at the Asian session high and then $3,200.
Any further gains in gold prices could be seen as selling opportunities and could lose upward momentum around $3,230. This is a key level, and if it breaks through this level, a new round of short-covering could push gold prices up to $3,265 to form resistance before moving towards the $3,300 mark.
Market trading is risky, and I hope you will take profits in time; make a good profit.

Gold plummets, pay attention to the 3100 first-line support🗞News side:
1. Russia and Ukraine hold ceasefire talks
2. Initial jobless claims data released during today's US trading session
3. Trump administration exposed to trillions of national debt
📈Technical aspects:
Gold has been in a sideways consolidation yesterday, and we did not have a good entry opportunity to trade in the evening. Today, it has been falling with inertia since the opening of the market. It has now fallen to around 3130, successfully breaking through 3150, the key early point. At present, the daily chart of gold is in a downward wedge arrangement, with the focus on 3130 support below and 3200 suppression above. If the European market cannot fall below 3130, then be wary of bullish counterattacks.
On the other hand, if we fall below the 3130 line, we will fall back and continue to focus on the 60-day moving average support 3105-3110 area. Therefore, in terms of operation, gold will first focus on the 3130 first-line support. If it breaks below, wait for the 3105-3110 area and then consider buying based on the long-short game. The top target is the 3190-3200 area. If it does not break 3200, then go short!
If you agree with this view, or have a better idea, please leave a message in the comment area. I look forward to hearing different voices.
FOREXCOM:XAUUSD FXOPEN:XAUUSD TVC:GOLD FX:XAUUSD OANDA:XAUUSD

Gold price plunges suddenly. Technical analysis.Information summary:
During the Asian session, gold prices suddenly plunged, and the price of gold has now hit a low of $3,148, down more than $44 from the intraday high of $3,192.78 hit earlier.
Gold prices continued to fall after breaking the $3,200 support I predicted earlier, and gold prices fell to a one-month low, continuing the recent decline.
The sharp reduction in tariffs between the United States and China has brought relief to global markets and led to a rebound, which has caused gold to correct and break through multiple technical levels.
Technical analysis:
In the short term, according to the 4-hour chart, the outlook for gold is bearish. Gold prices are trading below all of their moving averages, and the 20-period SMA has fallen below the 200-period SMA, which is located at $3,232, which will constitute an important resistance if the gold price trend recovers. Finally, technical indicators lack directional strength, but remain at negative levels, reflecting a lack of buying interest.
I think traders need to pay attention to the latest important support and upward resistance levels:
Support: $3140.
Resistance: $3100; $3215; $3232.

Gold continues to fall seize the opportunity to enter the market
📌 Driving factors
China-US container shipping routes rose sharply - factories rushed to produce overnight, taking advantage of the tariff cooling-off period, those who should stock up are working overtime to complete the tasks. This is the situation seen on the first day after the tariff reduction, indicating the complementarity between China-US trade.
The long-awaited US-Japan and European and American tariffs have not yet ushered in substantial benefits, but Europe said that this is an unfair negotiation and has not been concluded yet.
Trump went to the Middle East and signed a 100 billion weapons order, stabilizing the Middle East before Europe.
📊Comment analysis
The Asian session fell in the morning, pay attention to a few points:
1. The upper watershed opened at 3193 in the morning, the short watershed.
2. Directly break the 3168 long watershed, the next support is at 3145, 3130.
3. For now, the Asian session will continue to fall in a cycle, the European session will pull back after breaking the bottom, and the US session will continue to retreat.
💰Strategy Package
For short-term operations, short selling can be done near 3166, stop loss 3169, target 3140, 3135.
Labaron believes
Guaranteeing the principal is the bottom line for survival, controlling risks is the armor for survival, earning profits is a stage medal, and long-term stable and continuous profits are the only proof of being able to stand up from the sea of blood and corpses.

Gold fell. How is the market?Gold fell sharply at the opening today, and the lowest point hit $3175.
From the weekly line, this has already touched the weekly MA10 moving average position.
Quaid believes that traders should not blindly carry out short strategies. If there is a price rebound, the rise will be very fast, and the market may not give you a chance to stop loss.
From the 4H chart, we can see that gold has started a downward trend from last Friday's high of $3345. $3345-3307 is wave a. $3307-3360 is wave B. Currently, it is wave C from around $3360.
However, this wave C has not ended yet. If we look at it by standard, it will be considered the end of this trend only when it goes down to around $3120.
However, around $3175 is a support position. So now before it falls below $3175, gold may maintain a shock adjustment of $3200-3175.
I think you need to pay attention to the short-term resistance level of $3200-3250. If it cannot be as strong as breaking, then we can still carry out a short strategy below 3200.
