View on the short-term trend of gold!📌Fundamentals:
Gold prices fell sharply. After Trump announced a "breakthrough" trade deal with the UK, market expectations for more similar deals increased, weakening gold's appeal as a safe-haven asset.
📊Technological aspects:
Gold quickly fell in the Asian session and then quickly stretched back up. As of now, it has stood above 3320. So the possibility of gold falling again is relatively small. And there is a possibility that gold will further hit Thursday's high of 3360-70. If 3202 to 3435 is regarded as wave a, then 3438 to today's low of 3275 is wave b. So the current rebound from 3275 will go up in wave c. The first suppression position above is 3360-70, the high point of yesterday's rebound. At present, gold has stabilized above 3320, so the next bullish target for gold is to test 3360-70. After the pressure appears, follow the trend and go short.
Goldpreis

Gold head and shoulders bottom trend, bull market strong?🗞News side:
1. Tariffs push up inflation and slow down the economy, and the Federal Reserve may be in trouble
2. The situation between India and Pakistan escalates again
📈Technical aspects:
At the hourly level, today's Asian session continued the "wash-out" operation characteristics, quickly rising by 20 US dollars at the opening, and then stepped back to 3310 to confirm the top and bottom conversion support level. The two positive lines seemed to form a "yang-enclosing-yin" upward attack pattern, but suddenly reversed, not only breaking the trend support line of 3280, but also falling to 3274 before bottoming out and rebounding. This erratic trend has a significant long-short double kill effect for investors accustomed to trend continuation strategies. However, we can accurately find the right position in the market to trade and make profits.
At present, it is expected to form a "head and shoulders bottom" pattern from a morphological perspective, accumulating momentum for subsequent rises, and there is still room for upside in the short term. At present, any pullback is an opportunity for us to go long. Pay attention to the 3360-3370 line suppression on the top. If this resistance area is broken, it may open up a new round of upward space.
TVC:GOLD FOREXCOM:XAUUSD FXOPEN:XAUUSD TVC:GOLD FX:XAUUSD OANDA:XAUUSD

GOLD → sideways fluctuations. Will it break the resistance levelNews summary:
US President Trump announced a trade agreement with the UK, which raised hopes of reaching such an agreement with other countries, eased market tensions, suppressed gold's safe-haven buying, and the rise in the US dollar, US stocks and US bond yields also suppressed gold prices. US Treasury Secretary Bensont and Trade Representative Greer will talk with China's top economic officials in Switzerland in the near future.
Quaid reminds everyone that market concerns have not completely dissipated, and it is necessary to pay attention to the support of bargain hunting. The European Commission said earlier that if negotiations with Washington fail to cancel a series of tariffs imposed by US President Trump, the EU is considering taking countermeasures against US imports worth up to 95 billion euros. Close attention needs to be paid to news related to the international trade situation and changes in market sentiment during this trading day.
Support level analysis:
3310-3300 US dollars/ounce: 3300 US dollars is a psychological barrier and technical support for the confirmation of the previous price retracement. If it falls below 3300, it may fall to the 3280 US dollar area.
Resistance level analysis:
3360-3375 USD/ounce: Gold is currently above the convergence and oscillation range. 3360-3375 USD is the high pressure level of the previous day's box consolidation. If it breaks through this position strongly, the upward space will open up.
Technical analysis:
Gold is in a high-level oscillation and convergence range. The 4-hour MACD indicator shows that the short-selling momentum is weakening, but the hourly chart shows that the price is still constrained by the downward trend line. If gold prices stabilize at $3,300, it may trigger a rebound to $3,350-3,360; if it falls below $3,280, it may accelerate the downward trend. if it falls below 3280 USD, it may accelerate the downward trend.
Operation strategy:
Bull strategy: Long at 3315-3325 USD, stop loss at 3305 USD, target position at 3350-3360 USD.
Short strategy: short at $3365-3375, stop loss at $3380, target position at $3330-3300.

Special attention needs to be paid to gold operations on FridayThe current price fluctuates around the 3300-3348 range, with resistance at 3348-3352 and support at 3295-3303. If it breaks through 3348, be wary of a second surge to around 3365; conversely, if it loses 3295, it may fall back to the 3275-55 area.
Gold recommendation: short sell near 3335-3345 when it rebounds. Target position 3320-3310.

GOLD→Beware of market reversal? News is coming soon.At the end of the Asian session, the US dollar index was around 100.05. Gold rebounded after the plunge, and the current gold price is around $3,320/ounce.
Investors will see a large number of speeches by Fed officials, among which Williams' remarks are the most watched and are expected to trigger a big market trend.
Today's major news:
New York Fed President Williams will deliver a keynote speech at the 2025 Reykjavik Economic Conference. Later, Williams will speak at the Hoover Monetary Policy Conference.
I think if Williams makes hawkish remarks, it may push the dollar stronger, thereby suppressing gold prices.
Williams also serves as vice chairman of the Federal Open Market Committee and has permanent voting rights like the Fed governors.
In terms of monetary policy, Weems has the most say after Chairman Powell. Williams also served as chairman of the San Francisco Fed for nearly 7 years.
There are also several events taking place today: Fed Governor Kugler will speak on maximizing employment; North Richmond Fed President Barkin will participate in a fireside chat; Chicago Fed President Goolsbee will deliver a welcome and opening speech at a Fed event.
Gold price trend forecast:
I think its price may fall further to $3,200-3,100/ounce in the next few weeks.
I hope my analysis can help you, and I wish you good luck.

Gold price fell after a surge? Continue the downward trend?Analysis of gold market trend:
Gold price surged in the morning of Asian session, but then fell to around $3,315.
Market situation analysis shows that gold price continued the trend of yesterday in Asian time, rising rapidly in the morning, and then began to decline. It fell to $3,275 in the morning, and then rose to today's high of $3,330.
From the perspective of the gold hourly line, it began to rise after a brief decline in the morning of Asian session, effectively breaking through the resistance level of 3,315 and rising to a high of $3,330 for a short time. Then a downward trend appeared. This high-level fluctuation shows that the market is in a big wash and is brewing a new trend.
I think the downward space may be around $3,300.
Operation strategy:
Short around $3,320, stop loss at $3,330, and take profit at $3,300.

Gold prices pulled back. Will prices continue to fall?Latest news: Trump announced a trade deal with the UK, which boosted market risk appetite; coupled with a sharp rise in the US dollar and US bond yields, gold prices plummeted in the Asian morning trading session.
US President Trump and British Prime Minister Starmer announced a "breakthrough agreement" on trade, which made market traders predict that the United States would also reach such an agreement with other countries. This prediction has made market buyers lose motivation.
Quaid believes that if the United States and China reach an agreement, gold prices will face great resistance to rise, and gold prices should fall back to $3,200/ounce.
Market trading analysis:
The upward trend of gold paused and started a sharp decline.
As described by the RSI, buyers are losing momentum. This is not good for gold, and the price has now fallen below $3,300/ounce. Quaid believes that it will continue to fall and may fall to the cycle low of $3,202/ounce.
Short-term trading strategy:
Short at 3280, stop loss at 3290, and take profit at 3260.
Quaid believes that if the price of gold falls below the downward resistance level of 3275, you can continue to hold your position and choose the right time to trade.

The buy low and long strategy is coming!From the 4-hour analysis, the support below is around 3308-3300. If it does not break, the main bullish trend will remain unchanged. The upper side pays attention to the short-term suppression of 3360-66. The daily level stabilizes above this position and continues to maintain the low-multiple rhythm.
Gold operation strategy:
1. If gold falls back on the 3325-3320 line, go long, and if it falls back on the 3310-3300 line, it will cover long positions. The target is 3355-3360.

Pay attention to 3360 and go short if it does not break🗞News side:
1. China and the United States hold talks on trade issues
2. India-Pakistan conflict escalates again
3. Geopolitical risks
📈Technical aspects:
At present, gold has fallen below the trend line support. In the short term, we should focus on the battle for 3360. This point is not only the previous support-to-resistance level, but also the key signal for judging the trend reversal. If it cannot hold on to this position, the short trend will continue; if it recovers effectively, it may return to above 3400. Before losing the defensive line (the last starting and falling point) 3360-3362, the bears will still have the upper hand. It just so happens that the 4H lifeline is also in the 3360-3362 area. If the suppression is successful, the price will enter the 3362-3284 area from the lifeline to the lower track.
The rebound layout of the US market operation is short-selling, with the target at 3340-3330, and further support at 3310-3300.
If you agree with this view, or have a better idea, please leave a message in the comment area. I look forward to hearing different voices.
TVC:GOLD FOREXCOM:XAUUSD FXOPEN:XAUUSD FX:XAUUSD OANDA:XAUUSD
Gold prices are plummeting, is a bear market coming?🗞News side:
1. China and the United States hold talks on trade issues
2. India-Pakistan conflict escalates again
3. Geopolitical risks
📈Technical aspects:
Today, gold surged to the 3410 line and then ushered in a sharp fall, with the lowest touching near the 3322 line. We also seized the opportunity to notify our VIPs to enter the market, and all VIP members made good gains. At present, gold is still following the news, and the fundamental influencing factors are relatively complicated. Retail investors who trade alone can easily get caught up in the recent gold fluctuations. The gold price fluctuated repeatedly around 3340. The European session focused on the conversion suppression of the 3350-3360 support area. The 4H Bollinger Bands showed a closing shape. If the gold price cannot stand above 3350, then the bulls need to be repaired in the short term before they can continue to rise. The European session focused on the 3350-3360 resistance above and the 3310-3300 support below.
If you agree with this view, or have a better idea, please leave a message in the comment area. I look forward to hearing different voices.
OANDA:XAUUSD FX:XAUUSD FXOPEN:XAUUSD FOREXCOM:XAUUSD TVC:GOLD

With the Federal Reserve on hold, gold is ushering in a new engi
At 2 pm yesterday, the Federal Reserve announced that it would keep the benchmark interest rate unchanged at 4.25%-4.50%, in line with market expectations, and remained unchanged for the third consecutive meeting. After the announcement of the Fed's interest rate decision, the market continued to believe that the Fed would cut interest rates before July, and still expected three rate cuts this year.
Then Fed Chairman Powell downplayed any impression that the central bank would use interest rate cuts to ease the economic weakness caused by Trump's tariff policy at a press conference in the early morning.
Powell used the word "wait" 22 times to emphasize that the Fed is not in a hurry. He said: "We think the cost of waiting is quite low, so we are doing it."
Powell said: "In this case, we can't take the initiative because we don't actually know what the correct response to the data is until we see more data."
Powell hinted that the Fed will only cut interest rates after seeing evidence of a significant slowdown in the economy, and it may cut interest rates soon.
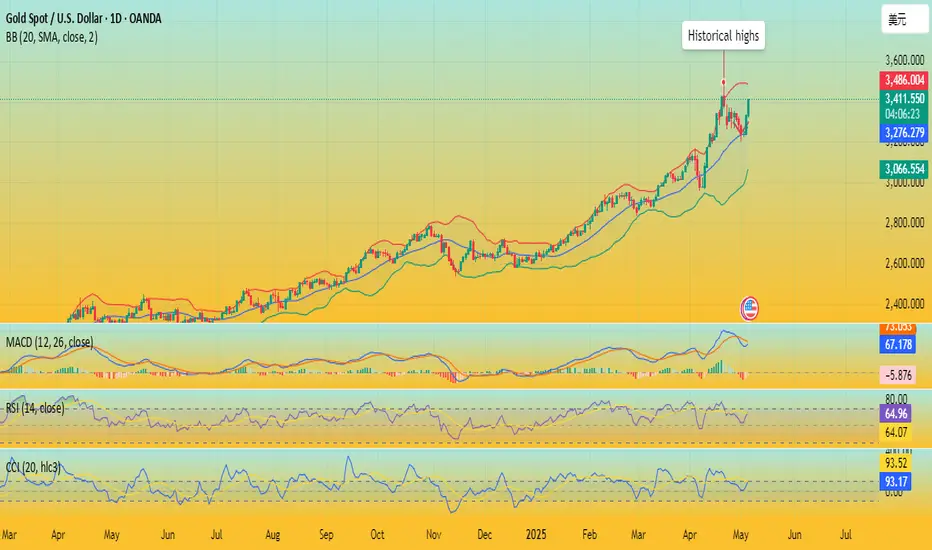
Returning to the market, first of all, from the gold daily chart, it can be seen that the current trend of gold is basically similar to that of the first half of the month.
There was a sharp retracement last week, and then the bottom daily line closed with a cross star, followed by a sharp rebound.
The current market is basically copying the previous market. If nothing unexpected happens, if it goes up in this trend, 3500 is very likely not the high point, and it is only a matter of time before a new high is reached.
In addition, from the 4-hour chart, yesterday, the bottom 3360 was tested many times, but it failed to break down. Today, the opening was stretched from 3360 to above 3400.
3360 is a intensive trading area suppression position in the early stage. After breaking through 3360 on Tuesday, it has not fallen below this position so far.
So, we can currently regard 3360 as an important support position.
So we can regard 3360 as the 618 support position, so as to infer the high point position.
As you can see in the picture, I have also marked the point, which is about 3450-60.
Finally, let's look at the hourly chart. You can see that from 3360 to the morning high of 3415, the Fibonacci position 50% position and 382 position are about 3390-85.
It is also about the lowest position of the callback.
In terms of future operations, you can basically rely on 3390-85 to enter the market and do more.
The upper target can basically see the 3440-60 range.

The range is broken and the bulls are ready to go!📌Fundamentals:
1. In the Fed's decision, Powell maintained the 4.25%-4.5% interest rate expectation, which was exactly the same as the expectation I mentioned, and predicted the result of the entire decision.
2. The India-Pakistan conflict intensified, and global geopolitical risks continued to heat up. From Gaza to Russia and Ukraine, and then to India and Pakistan, risk aversion will continue to provide long-term support for gold prices.
📊Technical aspects:
Affected by the interest rate decision, gold bottomed out and rebounded, but did not fall below the low of 3360. The daily line closed in the negative. The data had little impact. Of course, there are also concerns about the increase in inflation and unemployment caused by the increase in taxes. It is expected that there will be another interest rate cut in July, which provides support for gold. After the Asian session opened under short-term pressure at 3397, it broke through and increased in volume, and walked out of the shock range of the first half of the week. The previous article mentioned that squats and long jumps were realized. Today, we maintain a bullish mindset and pay attention to the top and bottom conversion support of 3400. If it can stabilize in the US market, we can continue to go long. The upper side will gradually look to 3423 and 3435, and it is not ruled out that it will go near the previous high.
🎯Practical strategy:
Gold is long near 3387-3380, and look at 3423 and 3435! If it is strong, it is long based on the support of 3402-3398!

Thinking and practical skills for winning in the 3360-3400 rangeAffected by the news, gold fell sharply at the opening. Successfully won. According to the trading strategy, we gave gold a wide range of fluctuations in the 3360-3400 range, which will not change much. It can be operated within the range during the day. The trading strategy analysis is accurate, and the key points are accurately grasped to enter the market, which brought us good returns during the day. The short-term rhythm is accurately grasped! Brothers who followed the trading plan should have also made very good profits. 🍻🍻🍻

The Fed meeting is coming. Will gold fall?Today's news focus:
The US Federal Open Market Committee (FOMC) will announce the interest rate decision;
Fed Powell will hold a monetary policy press conference.
The market generally expects that this meeting will continue to maintain the previous data, because the impact of tariff policies on inflation and the economy still needs to be observed. The Fed's interest rate cut may be carried out in June. Since this interest rate decision does not update the economic forecast, the focus will be on the Fed's incidental comments on any signals of future interest rate cuts to support the economy. Since the decision to keep the interest rate unchanged has been fully digested by the market, Powell's tone at the press conference will be the key to changing the market's expectations for interest rate cuts this year.
Today's gold trend analysis:
At present, according to the hourly chart, gold is still under pressure at the range resistance above 3400; on the one hand, the current tariff storm has cooled down, and on the other hand, the interest rate cut has decreased; and the news data to be released will cause a series of fluctuations in gold in the short term. At the same time, the market is currently betting that the gold price will have a further trend correction, which may cause capital outflows from the market, which will further hit gold bulls.
Quide believes that there is still room for operation in the short term. The resistance level of short-term upward movement is around 3400, but since the game between major powers has not stopped, there will be no major negative factors; if the news data does not fluctuate much, the market may not have a big dive.
Operation strategy:
Short around 3400, stop loss at 3410, and take profit in the range of 3370-3360.
Quide will always pay attention to important news and can provide professional analysis and suggestions for everyone in a timely manner.
I hope to help everyone recover their losses in the gold trading market.

Gold fluctuates in a narrow range ahead of the Fed rate🗞News side:
1. The situation between India and Pakistan escalates
2. China is willing to engage with the US, and the situation has eased
📈Technical aspects:
The price of gold fell sharply after the market opened today, once falling to around 3360. Currently, gold is oscillating slightly between 3375-3390. The market has no clear trading direction for the time being. Gold is not expected to change much before the Federal Reserve interest rate is announced. Today, gold prices have continuously tested the lower support 3370-3360, and the upper short-term resistance is focused on the 3390-3400 line. We maintain shock treatment for short-term trading. The focus will be on today’s Fed interest rate issues and talks between China and the United States.
If you agree with this view, or have a better idea, please leave a message in the comment area. I look forward to hearing different voices.
TVC:GOLD FOREXCOM:XAUUSD FXOPEN:XAUUSD FX:XAUUSD OANDA:XAUUSD

Gold range shock , Both long and short have a chance!📌Fundamentals:
1. There are signs of escalation in the India-Pakistan conflict
2. The US-Houthi ceasefire agreement
3. The Fed's interest rate decision dominates this week's market
4. The international trade situation disturbs market sentiment
5. Market sentiment and capital flows
📊Technical aspects:
The market came out in the Asian session. It stalled again later. We are used to seeing fluctuations of hundreds of points. A fluctuation of more than ten or twenty points a day is the same as no fluctuation. At present, the market is temporarily maintained in the range of 3400-3360, and there is not much fluctuation. At present, let's see where the market breaks through. If it retreats to around 3360, follow up with long orders. If it rebounds to around 3400, follow up with short orders.

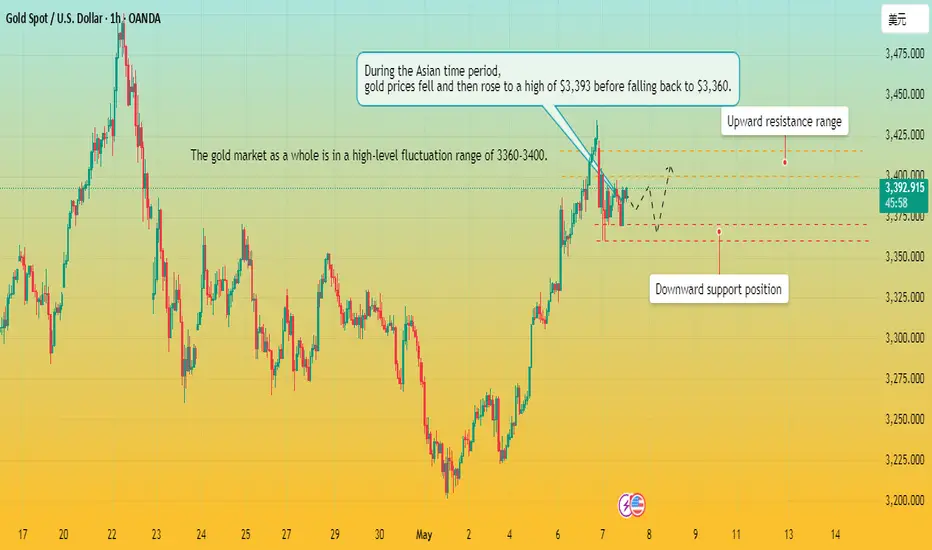
Gold bides its time. Bulls are suppressed at high levels?
Gold is waiting for the Fed's interest rate decision.
analysis in Asian time period:
Gold opened with a sharp drop due to international news, and continued to fluctuate at a high level in the 3360-3400 range predicted by Quaid. I predicted in the early Asian session that the price of gold would rise to around 3390 and then fall back to around 3370-3360. And its trend is just as Quaid predicted and analyzed, with a correction after the predicted high point.
Now it seems that gold has fallen into a high-level fluctuation range after a sharp drop in the early Asian session, which is in line with my expectations. Quaid believes that the trend direction of the European session is very important. The current upward suppression range is between 3400-3415, and the downward support level is between 3360-3370;
On the contrary, if the European session falls below the downward support range, it may continue to fall.
But Quaid believes that the overall upward trend of gold prices has not changed. Gold prices are just accumulating strength now, and will continue to rise after the adjustment.
Overall trend analysis:
Quaid recommends that the long strategy is still the main one. If the support range of 3360-3370 can resist the downward trend, then we can still carry out the long strategy after the price falls back.
Operation strategy:
Long strategy: Go long when the price falls back to 3365, stop loss 3350, take profit range 3400-3415.
Short strategy: Go short at 3395, stop loss 3405, take profit 3360.
XUA/USD) bullish trend analysis Read The ChaptianSMC Trading point update
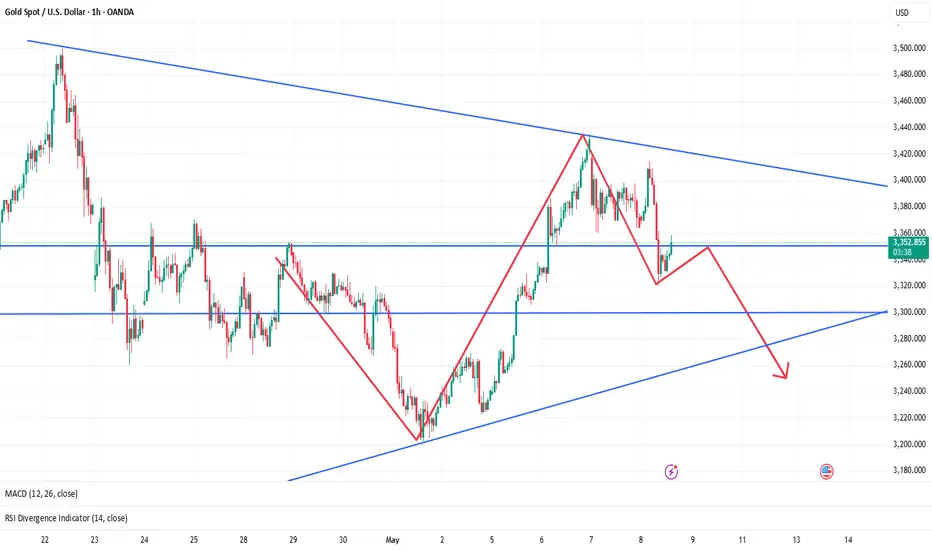
Technical analysis chart for Gold Spot (XAUUSD) on the 4-hour timeframe. Here's a breakdown of the key ideas behind the analysis:
1. Trend and Structure:
The overall trend shows a bullish move followed by a correction and now a potential continuation upward.
A bullish breakout from a descending trendline suggests a shift in momentum from bearish to bullish.
2. Key Zones:
Order Block / Buying Zone (~3,280-3,310): A demand area where price is expected to find support and potentially bounce higher.
Support Level (~3,320-3,360): Price is currently above this level, suggesting buyers are in control.
Resistance Level (~3,440-3,495): Marked as a potential short-term ceiling; a breakout above this level may signal strong bullish continuation.
Target Point (~3,494): This is the projected take-profit level for a bullish move.
3. RSI Indicator:
RSI is around 63–64, close to overbought territory but not yet extreme. This suggests moderate bullish momentum without signs of immediate reversal.
4. Projected Move:
The chart outlines a possible retracement to the support or order block zone, followed by a bounce and a push toward the resistance level and target.
Mr SMC Trading point
Strategy Implication:
Buy on pullback to the support or order block zone.
Stop-loss could be placed below the order block (~3,280).
Take-profit around the target zone (~3,494).
pales support boost 🚀 analysis follow)

XAU/USD) Bullish reversal analysis Read The ChaptianSMC Trading point update
technical analysis of Gold Spot (XAU/USD) on the 4-hour timeframe, projecting a bullish outlook. Here's a breakdown of the main ideas conveyed:
1. Support Level & Double Bottom
A strong support level is marked around the 3,177 area, with the price bouncing from it twice (highlighted by two black dots), indicating a potential double bottom pattern, which is typically a bullish reversal signal.
2. EMA 200 Support
The 200 EMA (Exponential Moving Average) lies just below the current price (~3,177), acting as dynamic support. The fact that price is holding above it adds strength to the bullish argument.
3. Bullish Divergence on RSI
The RSI (Relative Strength Index) shows a bullish divergence, where the price made lower lows but RSI made higher lows—another potential reversal indicator.
4. Price Projection
If the bullish move plays out, the chart outlines two upward targets:
Target Point: ~3,501.67
Next Target Point: ~3,729.23
These are based on measured moves from previous impulse legs (shown by vertical blue projections).
5. Entry Setup
The chart suggests a break above the short-term consolidation could trigger the bullish run toward the first target, aligning with bullish price structure and support confirmation.
Mr SMC Trading point
---
Overall Idea: The chart expects a bullish reversal from support, confirmed by double bottom, EMA 200 support, and RSI divergence, targeting higher resistance zones.
Pales support boost 🚀 analysis follow)

Gold price fell after a high? Trend reversal?Analysis of Asian morning session:
The recent high point of gold price reached 3437 US dollars, and it fell sharply after the Asian morning session opened. The gold market opened after the Asian holiday, and the bulls rose strongly; the Asian morning session was volatile, and the current lowest reached around 3360, a drop of 77 US dollars.
Then it adjusted back and reached a high of around 3404; this position can be used as an important resistance level at the opening time of the Asian session. Between the sharp rise in the morning of the past two days, and the upward continuity of the European and American sessions, coupled with the recent continuous rise and fall, the rapid fall in the Asian morning session.
Quaid believes that in this continuous upward pattern, once there is a sharp fall, it is also likely to be a signal of insufficient bullish power in the short term; then we need to consider whether the bears can reverse, and the current upper pressure position is at 3395 US dollars, and the lower support level is at 3360 US dollars, which is equivalent to the previous top and bottom conversion.
Operation strategy:
Short when the price returns to 3390, take profit at 3370-3360, stop loss at 3400.
Good luck to everyone.

The most important golden strategy📌Fundamentals:
Focus on the Federal Reserve's interest rate decision
📊Technological aspects:
From the golden hour chart, the Asian market is in line with a wave of continued gains and the subsequent adjustment to the 10 moving average of 3350 has stabilized. The European market has slowly moved higher and is approaching the Asian market high. This pattern is still very strong, and there is a high probability of a second rise tonight; The 10 EMA is above 3370 as the primary support and continues to be bullish. As each line closes, the moving support will slowly move up. As long as it does not effectively break, the short squeeze will continue. A breakthrough of 3410 will also happen at any time. If it breaks through, it will be easy to continue to storm above 3420. If it rushes higher and falls back in the evening and falls below the 10 EMA, then If it adjusts to the middle track for the first time, there will still be good support, just continue to be bullish; comprehensively speaking, today's short-term gold operation ideas suggest that the callback is mainly long, and the rebound is supplementary.
🎯 Practical Strategy:
Short strategy: short gold when it rebounds around 3425-3430, target around 3400-3380.
Long strategy: long gold when it pulls back around 3365-3370, target around 3400-3420.

Gold price breaks through 3400. Bulls take control?Gold price breaks through the 3400 resistance level I predicted. And there is a trend of continuous rise.
Next, Quaid will comprehensively analyze the current market situation for all traders.
Technical analysis:
From the daily chart, the gold price has broken through the important resistance level and formed a strong upward trend. Currently trading above $3400, it has successfully broken through the key resistance range of $3385-3400. The Bollinger Band indicator shows that the middle track is at 3231.01, the upper track is at 3485.06, and the lower track is at 2976.97, indicating that the current price is near the upper track of the Bollinger Band, showing strong upward momentum.
The RSI indicator shows that the current value is 64.8, which is in the neutral to strong area, and has not yet reached the overbought level, and there is still room for growth.
Quaid believes that in the short term, if gold stabilizes above $3,400, it may hit $3,430-3,450. Once it breaks through, it will open up the possibility of a higher price.
Market sentiment observation:
The current market sentiment is clearly biased towards risk aversion, and global geopolitical tensions have become the main driving force for gold to rise. The continued tension of geopolitical conflicts and political uncertainty in Germany have prompted market participants to seek safe assets. At the same time, expectations for the Fed's future monetary policy shift are also increasing. Although the possibility of a rate cut in May is extremely low, the probability of a rate cut in the June meeting is close to 30%.
Liquidity indicators show that the trading activity in the gold market has increased and institutional funds continue to flow in, indicating that bullish sentiment in the market has the upper hand in the short term. Technical indicators have not shown obvious overbought signals, which means that the current rally still has room to continue. Compared with other asset classes, gold's relative strength is outstanding, especially in the context of the possible challenges to the status of the US dollar as a safe haven asset.
Outlook for the future
In the short term: Gold prices may continue to rise to test the $3,400-3,500 area. The Fed's decision will be a key trigger for gold prices in the near term. If the Fed shows a dovish attitude, gold prices are expected to further break through historical highs.
Medium term: Global geopolitical uncertainty is expected to continue to support gold prices. If geopolitical conflicts escalate further or the situation in the Middle East deteriorates, safe-haven demand may push gold prices to hit the $3,600 level. At the same time, market expectations of a shift in the Fed's monetary policy will be another key factor affecting gold prices.
Long term: From a macro perspective, the current combination of slowing global economic growth and geopolitical tensions will continue to provide support for gold.
Short-term entry can be made at key points.📊Technical aspects:
|Gold showed a clear upward trend today driven by risk aversion, mainly because Trump announced a 100% tariff on films produced overseas, a move that triggered global concerns about trade wars and exacerbated economic uncertainty. In order to avoid risks, investors have turned to traditional safe-haven assets such as gold, resulting in a surge in demand for gold and a subsequent rise in prices. Currently, from the perspective of technical indicators, the 4-hour moving average is in a bullish arrangement, the Bollinger band is in an enlarged form, and the gold price is running close to the upper Bollinger band. Gold is still bullish, but the RSI shows overbought. Don't chase highs and beware of gold's highs and falls. It is recommended to go long again after a pullback.
🎯Practical strategy:
Go long when gold falls back to around 3385-75, with a target of around 3400. If it does not break, you can go short near 3400 and see a fall back near 3384.
