Long positions in the US market remain the main trend🗞News side:
1. The “demand shock” of the Trump administration’s tariffs on the global economy
2. The United States rejected Japan’s request for a comprehensive exemption from 10% reciprocal tariffs and country-specific tariffs in recent negotiations.
3. The conflict between Israel and the Houthis
📈Technical aspects:
The 4H golden moving average spreads upward, the MACD golden cross opens upward, and the 4H overall bullish trend is seen. Gold price encountered resistance at 3386 in the morning of the Asian session. This point can be used as a reference in suppressing the market outlook. If this resistance is effectively broken through, bulls are expected to continue to work towards the 3400 first-line mark above. The daily chart is positive, and the K-line combination is relatively strong. The US market is expected to break through 3386 and reach the space above 3400; the SMA10 moving average of 3370 continues to be bullish as the primary support, with strong resistance to 3400. Even if the price of gold in the US market rises and falls, the middle track of the Bollinger Bands still has good support. On the whole, we mainly focus on long positions in short-term trading. We can consider the 3370-3380 layout to go long, with the target looking towards 3400-3410 above.
If you agree with this view, or have a better idea, please leave a message in the comment area. I look forward to hearing different voices.
TVC:GOLD FOREXCOM:XAUUSD FXOPEN:XAUUSD FX:XAUUSD OANDA:XAUUSD
Goldpreis

Gold returns to the bull market as expected, follow-up layout🗞News side:
1. The “demand shock” of the Trump administration’s tariffs on the global economy
2. The United States rejected Japan’s request for a comprehensive exemption from 10% reciprocal tariffs and country-specific tariffs in recent negotiations.
3. The conflict between Israel and the Houthis
📈Technical aspects:
From a technical point of view, the 4H gold bulls are once again making an impact. At the top, we focus on the short-term suppression of the 3380-3390 line, focusing on the suppression of the 3400 line. Below, we focus on the short-term support of the 3350 line, and the important first-line support of 3335-3340. In terms of operation, we mainly go long by stepping back on 3350-3360, and the target is temporarily looking at 3380-3390. In the middle position, we should watch more and move less, pursue orders cautiously, and wait patiently for key points to enter the market.
If you agree with this point of view, or you have a better idea, please leave a message in the comment area. I look forward to hearing different voices.
OANDA:XAUUSD FX:XAUUSD FXOPEN:XAUUSD FOREXCOM:XAUUSD TVC:GOLD
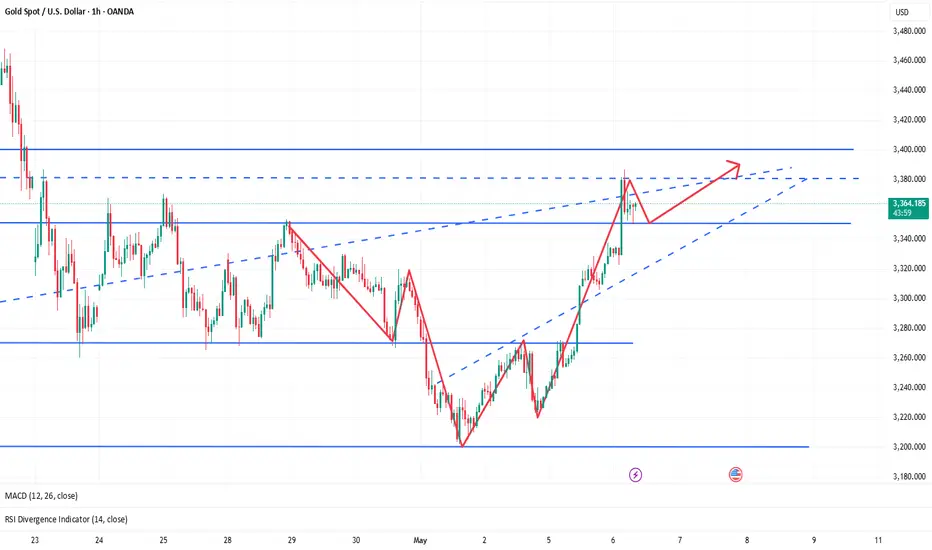
Gold is rising strongly. What is the reason?Analysis of today's market in Asian session:
Last week, the price of gold rebounded to above 3240, the lows were constantly rising, and the highs were broken; such a rebound is tempting traders to short.
In the morning of Asian session, the price of gold rose rapidly from 3320 to 3385 US dollars. In just two days, the price of gold recovered the decline during the Asian holiday. In the current market situation, it is not far away to rush back to the high point. The key to the price increase in the morning of Asian session may also support the European session and the US session. You can use a long strategy during this period.
However, you must pay attention to the continuity of the gold price. If there is an attack in the market transaction, there must be a defense; the downward or upward resistance level must be clear after the breakthrough position, how to operate to maximize the benefits and minimize the losses.
Quaid believes that if gold pulls back, its support point needs to focus on the 3340-3350 range, and the defense position is 3320; the position of the Asian morning rise should be paid attention to. If it falls below this position, you need to adjust the strategy in time.
Quaid believes that the upward trend is currently focused on $3380-3400.
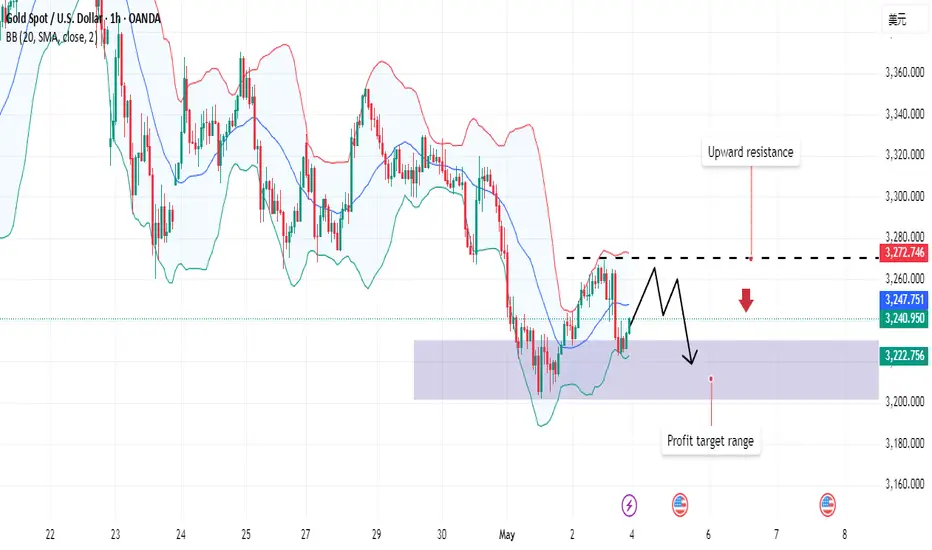
It’s the right time to short📌Fundamentals:
This week, the Federal Reserve will hold a rate decision, which is expected to dominate the market this week. In addition, we need to continue to pay attention to news related to the international trade situation.
📊Technical aspects:
The 1-hour moving average begins to turn, so the unilateral decline of gold has temporarily come to an end. However, the rise of gold has reached the key resistance area in the early stage, which is the starting point of the early stage of 3330. It is obviously not appropriate to chase more at this position, so the short-term may begin to adjust, and gold will go short at 3325 first. The market is changing rapidly. If gold breaks upward without stepping back, there will be no opportunity to go long. Then there is no need to chase more gold. Go short first and look at the decline and adjustment. On the whole, the short-term operation strategy of gold today is to go short on rebounds and go long on pullbacks. The short-term focus on the upper resistance of 3328-3330, and the support on the lower side is 3280-3293.
🎯Practical strategy:
Short gold when it rebounds to around 3325-3328, target around 3300-3280.
Buy gold when it falls back to 3280-3295, target around 3325-30.

Although the bulls are strong, don't chase them at high levels📌Fundamentals:
The market is still focused on Trump's tariffs, followed by geopolitical situations, such as the India-Pakistan conflict, the Israeli-Palestinian ceasefire, and the Russia-Ukraine negotiations.
📊Technical aspects:
From the 4-hour analysis, the upper pressure is around 3336-3345, and the lower support is around 3280-3293. Continue to rely on this range to maintain the main tone of high-altitude low-multiple cycles. In the middle position, watch more and move less, be cautious in chasing orders, and wait patiently for key points to enter the market.
🎯Practical strategy:
1. Short gold rebounds at 3336-45, with a target of 3280-3295.
2. Go long gold at 3280-3295, with a target of 3325-30.

Israel-Houthi conflict could put gold back on the bull run🗞News side:
1. The Israeli president said that they are on the eve of a "large-scale attack on the Gaza Strip"
2. The Houthi armed forces stated that all Israeli airports are their targets
3. The situation of the Russian-Ukrainian war and the follow-up events of the India-Pakistan conflict
📈Technical aspects:
From a technical point of view, the current 1H moving average of gold is spreading upward, resulting in a small retracement. The short orders we hold are also closed in time at 3310 to lock in profits. After gold broke through the previous range, the upward channel opened. The 4H MACD diverged from the bottom, the golden cross and the green column enlarged, opening upward, and the overall 4H trend was bullish. Moreover, the support effect of the middle rail of the Bollinger Bands is obvious, and the gold price is accumulating strength below the upper rail of the Bollinger Bands, with strong upward momentum. Pay attention to 3310. After the support stabilizes, you can consider participating in long positions near 3310-3320, focusing on the 3290 line below; focus on 3375 above, and then consider participating in short sales near 3355-3365 after the pressure is under.
If you agree with this point of view, or you have a better idea, please leave a message in the comment area. I look forward to hearing different voices.
TVC:GOLD FOREXCOM:XAUUSD FXOPEN:XAUUSD FX:XAUUSD OANDA:XAUUSD

Gold pullback continues to see bulls
In my first article today, I reminded everyone to be careful that gold will stand above the 3300 mark again.
And I also told you to rely on 3255-50 to do more, looking at the upper 3280 and 3300 positions.
Sure enough, after the opening of the European session, gold has made rapid progress, and the highest has reached above 3300 so far.
I also notified the real-time students to enter the market and do more near 3255 during the Asian session, and directly gave the target position of 3300.
At present, the target position of 3300 has been perfectly reached, and I also made a profit of more than 55 US dollars.
From the current 4-hour chart:
It can be found that gold is now completely above the trend line.
The only suppression position above is currently around 3350.
The support below is currently located at 3275-85.
If gold does not retreat, then the upper side will directly test the suppression near 3350.
On the contrary, if gold chooses to retreat next, then just focus on 3275-85.
As long as gold retreats and stabilizes in the 3275-85 range, you can directly enter the market and go long.
Continue to look at 3350 from above. If it breaks through and stabilizes above 3350 in the future, you will see the 3380-3420 range.

How to plan when gold’s rise encounters resistance🗞News side:
1. Pay attention to the recent trade situation and news about the Fed's interest rate cuts
2. Be wary of DXY trends
3. The situation of the Russian-Ukrainian war and the follow-up events of the India-Pakistan conflict
4.Trump imposes 100% tariff on non-US films
📈Technical aspects:
Compared with today's market, the morning rise happened to be a sideways price, breaking through the previous high point. In a volatile rise, it doesn't matter. It is very likely that in the later trend, the price will return to the starting point or even lower, but it can continue to rise. This is a feature of the shock. At the same time, the current market is not extremely strong, and it is still in a volatile rise. Therefore, do not chase long, but retrace as much support as possible.
🎁SELL 3315-3325
🎁TP 3280-3270
🎁BUY 3270-3280
🎁TP 3300-3310
If you agree with this point of view, or you have a better idea, please leave a message in the comment area. I look forward to hearing different voices.
OANDA:XAUUSD FX:XAUUSD FXOPEN:XAUUSD FOREXCOM:XAUUSD TVC:GOLD

Gold prices rose rapidly after falling. What happened?Gold prices rose in late Asian trading hours.
In the morning, gold prices stabilized above $3,250 as investors returned to defensive assets due to continued uncertainty in the US trade agreement with China and Japan, and increased geopolitical tensions in the Middle East and Ukraine.
The weak dollar before the Fed meeting and the decline in expectations for rate cuts also supported gold demand. The market focus remains on US trade news and the hawkish stance that the Fed may take this week.
Quaid's analysis of market views:
1. Despite the short-term adjustment in the market, the bullish logic of gold still exists, and bullish investors are more willing to buy when the price is low. The continued volatility of US government policies and the slowdown in US economic growth constitute strong support for gold.
2. During the previous Asian holiday, the gold market fell to the key support of $3,200. After the opening, Yanzhou buyers quickly bought at a low price, causing gold to rise rapidly in the short term.
Quaid believes that from a technical point of view, the gold price has reached the bottom resistance level of the range. If the price of gold does not react to the false breakout and continues to hit 3315-3320, then a breakout and consolidation above this level will strengthen it to 3320-3350.
Upward resistance: 3315, 3320, 3350
Downward support: 3265, 3250, 3220
Since the opening, the price of gold has retested 3269 twice. Buyers are testing the resistance level in the hope of a breakout. If the bulls break through 3315-3320 and consolidate above 3310, the possibility of an upside move will be high. However, the possibility of another test of the liquidity area of 3250 before the upside move cannot be ruled out.
If the price of gold breaks through the upward resistance, traders can try to go long in the short term and conduct scalping.
On the contrary, if the price of gold fluctuates sideways in the 3310-3315 range, Quaid recommends shorting in this range.

Gold fluctuates widely; short-term trading analysis.In the morning of the Asian market, spot gold fluctuated slightly and is currently trading around $3,270/ounce, an increase of about 0.9%.
As Mr. Trump's latest statement hit the market's risk appetite, the price of gold rose rapidly in the short term. The current London gold price has reached $3,270/ounce, climbing nearly $30.
In addition, the market focus has turned to the Federal Reserve's May FOMC meeting on May 7. Although the market has priced in a standstill, Powell's latest remarks and press questions after his radical statement in April will attract high attention.
Asian market morning analysis:
Gold prices rebounded again in the morning of the Asian market. Quaid believes that if gold does not break through strongly, it will still fluctuate within the range, and the current bullish situation has not reversed. If gold continues to maintain its strength, it can resume the bullish trend. But it has not broken through for the time being, so the possibility of shorting is still very large.
Gold's 1-hour moving average continues to be in a downward short position, and there is still room for gold shorting; gold was under pressure at 3270 in the early stage and fell back, and the early rebound was under pressure at 3270 and continued to fall. Gold is still fluctuating within the range in 1 hour, and Quide believes that the short-selling trading strategy is still the main one.
Operation strategy:
Short-term operation: short at 3265, stop loss at 3280, and profit at 3250-3240.
I hope Quide's analysis can help all traders make profits in the gold market in time and harvest the first gold of the day.

Gold fell as expected. What will happen next week?Gold fell within the range expected by Quid. Although it rebounded slightly, the final result did not change. Will the direction of gold change next week?
Quid's analysis:
Gold's 1-hour moving average is downward, and there is a trend of continuous downward development; gold is currently under pressure from the 3270 line, so 3270 will still be the key turning point for gold bears next week. Although gold has rebounded slightly, the magnitude of the decline is not large; if the upward resistance level of 3270 fails to break through next week, it may be in a sideways fluctuation.
The downward trend will not reverse for the time being, unless major news is released on the weekend, which directly affects the gold market.
Quid believes that the ups and downs of the market are normal. Gold has fallen by about $300 from its high point, and the overall trend in the near future is still downward; it continues to fall after a small rebound, which means that the strength of gold bears is still there.
Quide believes that it is always easy to follow its trend; violating its rules always makes oneself exhausted; the market is always right, and standing on the opposite side of the market will always be taught a lesson by the market. In the face of the overall trend, traders should not be lucky, and the market will not forgive your mistakes again and again.
Operation strategy:
Short around 3270, stop loss at 3280, take profit around 3220;
The latest gold strategy analysis and operation guidance📌Fundamentals:
This week, the US economic data was released intensively, and ADP employment, unemployment benefits, GDP and PCE price index were all bullish, but some data showed signs of weakness after Trump's tariff policy. The unemployment rate remained the same as the previous value of 4.2%, while the expected new employment of 130,000 was significantly lower than the previous value of 228,000. The market's concerns about the cooling of the economy provided support for the gold price.
📊Technical side:
Although the 1-hour moving average is still in a dead cross short arrangement, there are signs of turning around. At the same time, after the rebound, gold began to consolidate at a high level instead of continuing to fall, so the momentum of the bears was weakened. So today's closing is critical. Today, gold fell back to around 3230 under pressure from 3270. In the short term, this is a balance range. You can see the shock in this range at night. If gold finally closes above 3270, then gold will most likely continue to rise next week. If it closes below 3240, then gold bears still have a great chance. If you want to operate in the short term, then don't chase it for the time being. Since it is a shock, you can go short first at a high level. If it breaks through 3270, then wait until next week. On the whole, today's short-term operation of gold suggests that the rebound is mainly short, and the callback is supplemented by long. The top short-term focus is on the first-line resistance of 3265-3270, and the bottom short-term focus is on the first-line support of 3200-3197.
🎯Practical strategies:
Strategy 1: Go short when gold rebounds around 3263-3266, with a target around 3230-3210.
Strategy 2: Go long when gold pulls back around 3197-3200, with a target around 3220-3230.

Non-agriculture ended perfectly, Today’s closing is key!📌Fundamentals:
The US April non-farm payrolls data (177,000 new jobs) exceeded expectations, reinforcing the Fed's expectations of a smaller rate cut. The market's expectations for rate cuts this year have been lowered from 90 basis points to 85 basis points, and the strengthening of the US dollar has suppressed gold prices.
📊Technical aspects:
From the 4-hour analysis, gold fell after the negative news of non-farm payrolls today, but gold bottomed out and rebounded, and continued to fluctuate. It feels that non-farm payrolls have gradually lost its charm, and the market is not as good as usual. However, today's closing is very critical, and it is also the key to whether gold will turn around. The non-farm payrolls market has basically finished, and the upper side continues to pay attention to the suppression of 3260-68, focusing on the suppression of 3290-95 above, and the short-term support near 3235-3240 below.
🎯Practical strategies:
1. Go short when gold rebounds at 3260-65, cover short positions at 3378-85, and target 3240-3245.

Non-agricultural prospective data analysis Operation suggestions📌Fundamentals:
📊Technical aspects:
Technically, spot gold is in a downward trend in the short term, and there is a certain rebound or shock at the key support level. At the 4-hour level, the gold price is running above the lower track of the Bollinger Band, and the opening shows signs of contraction. The MACD indicator dead cross is gradually closing, and the RSI indicator is running in the 35-45 range, showing that the long and short forces are relatively balanced.
🎯Practical strategy:
3260-3270 light position short, target 3225-3200. When it reaches 3225-3200 and stabilizes, try to go long, target 3250-3270.

Maintain shock and short position before non-agricultural📌Fundamentals:
From the news perspective: the United States released a trade agreement and tariff reduction signal, the trade situation eased, resulting in a decline in market demand for safe-haven assets, triggering a sell-off in gold; the situation between Russia and Ukraine has eased, and the dawn of peace talks is approaching, which is a negative factor for gold; at the same time, the situation between India and Pakistan has heated up, which has supported the price of gold to a certain extent.
📊Technical aspects:
In the past few days, we have been emphasizing that gold should be bearish, and warned that gold is likely to break and fall sharply.
Gold, the general trend is as described in the continuous analysis. This round of price has fallen from the historical high of 3500. The first round of selling to 3260 rebounded to repair 3370; after rebounding to 3358 during the week, it weakened again, and the Asian market quickly sold off and fell below 3260. The subsequent analysis emphasized that the short-selling pattern of each cycle is good, and the shock bearish trend continued before the non-agricultural, and the target was adjusted to the parallel attack and defense range of 3193-3168;
European and American markets fluctuated and were bearish, which is in line with expectations; short-term resistance 3221, 3226, strong resistance 3231-3235; short-term support 3212, strong support 3202;
🎯Practical strategy:
It is recommended to rebound and sell: short near 3220-3230, target 10-15 points

Gold plummeted as expected. Operation strategy?In my last analysis, Quaid predicted that gold was at risk of falling and breaking.
Quaid promptly told everyone that they could short trade at 3310-3320.
At present, the market situation is basically consistent with Quaid's expectations. As of now, gold has fallen to a low point near 3215. And it has been maintained for some time.
Quaid speculates that gold will continue to maintain a bearish trend and continue to retreat.
Quaid data analysis:
From the hourly chart, gold is currently following a wave trend, and the highest point of 3352 is the starting point of wave A. The high point of wave b is at 3320. If the current 3220 is the beginning of the low point of wave C, then be careful of its continued decline.
Trading strategy:
In terms of the next operation, Quaid suggests waiting for short trading near 3225.
If gold falls below 3210 again, then the bottom can directly look towards the 3190-3200 range.
Quaid warned everyone not to think that the trading range is very large; because the trading markets in some Asian countries are closed, any terrible thing could happen. It is recommended that everyone take profits in time.

Gold starts a unilateral decline?
📌 Gold information
U.S. stock indexes fell sharply in midday trading due to disappointing U.S. economic data. On Friday, the U.S. Department of Labor will release the crucial monthly employment report. This is likely to be the most important U.S. data point so far this year.
In other news, Dow Jones News Service reported: "Tariffs are beginning to bring pressure, prompting the Eastern giant to increase stimulus to support economic growth.
📊Comment analysis
For international gold, what you need to do now is to follow the market. Don't think about bottom fishing. You can do a short-term rebound during the day. When the market has clearly broken the structure, you should choose to believe in the technical side, rather than speculate on the next support. This will only be endless. At this stage, if you fail to bottom fishing, are you still ready to try again near the integer of 3200? This is not over yet. Even if it falls below 3200, the 3180 horizontal support will be immediately below.
This round of decline is about to completely give up the second rise in the front end, depending on 3180. This is why I just said that 3200 will immediately encounter a new support. The reason why many people choose to go long above 3240 is also because it is the first stage of the high platform of the front-end surge, and it is necessary to defend. Unfortunately, the defense is not successful now. In other words, if you want to go short next, you have to look at the continued decline. What are the characteristics of the continued decline? You certainly can't tolerate it having an excessive rebound, so don't think about any high-altitude trading strategy.
💰Strategy Package
Short position:
Actively participate at 3230 points, and the profit target is around 3200 points
⭐️ Note: Labaron hopes that traders can properly manage their funds
- Choose the number of lots that matches your funds
- Profit is 4-7% of the capital account
- Stop loss is 1-3% of the capital account

The short position continues to approach the expected point📌Fundamentals:
From the news perspective: the United States released a trade agreement and tariff reduction signal, the trade situation eased, resulting in a decline in market demand for safe-haven assets, triggering a sell-off in gold; the situation between Russia and Ukraine weakened, and the dawn of peace talks was approaching, which was a negative factor for gold; at the same time, the situation between India and Pakistan heated up, which supported the gold price to a certain extent.
📊Technical aspects:
In the past few days, we have been emphasizing that gold should be bearish, and reminded that gold is likely to break and fall sharply.
From a technical perspective: the lower track of the Bollinger band at the 4-hour level broke through, and there was no sign of stabilization. The support of $3,250/ounce turned into pressure, the downward channel has been opened, and MACD has walked out of the hovering area, and the downward momentum has been strengthened; at the daily level, the MACD indicator is dead cross running, and the KDJ indicator enters the oversold area, showing that the short-selling force has an absolute advantage.
The short-term short-selling force of spot gold is strong, and the gold price is in a downward trend. Before there is an obvious reversal signal, the short-term trend is still bearish.
🎯Practical strategy:
Recommendation to short on rebound: short around 3235-3245, target 3220-3200.

Gold's evening rebound continues to be bearishAffected by the initial jobless claims data, gold has rebounded and risen again to around 3220 after touching around 3203. As we mentioned in the previous trading idea, short selling is still our main trading method before there is a big data impact. For the time being, we will first look at the first-line resistance of 3240-3250. If it breaks through this resistance range, we will further look at the key resistance of 3260-3270. If it does not break, we will go short.
There is an obvious downhill trend in the weekly line, which is expected to form a continuous negative trend. Then we look to the 3210-3200 support level to remain unchanged, and may even continue to look to the early low support line of 3193.
SELL 3240-3250
TP 3210-3200
Many friends who have read my posts have reported that my trading ideas and strategies are very helpful to them. I always firmly believe that profitability is the criterion for measuring strength, and seizing the opportunity is the key to victory. I will post every day to share my trading strategies and ideas for free. If you have just entered the market and don’t know how to make more profits, if you are already in it but the harvest is not ideal, then you might consider taking a look at my profile.
OANDA:XAUUSD FX:XAUUSD FXOPEN:XAUUSD FOREXCOM:XAUUSD TVC:GOLD

Gold’s short trend intensifies! Main empty follow up.📌Fundamentals:
📊Technical aspects:
Gold, the price of this round has fallen from the historical high of 3500. After the first round of selling to 3260, it rebounded and repaired 3370; it rebounded to 3358 during the week and then weakened again. The Asian market opened with a rapid sell-off below 3260 and is now trading around 3234; the short position in each cycle is good, and the pre-non-agricultural market continues to be bearish. The target is adjusted to the parallel attack and defense range of 3193-3168.
Short-term resistance 3235-3240, strong resistance 3246-3250, 3260 is not expected to arrive; short-term support 3220, strong support 3210-3194.
🎯Practical strategy:
Recommendation to short on rebound: short around 3240-3250, target 3220-3200.

GOLD...LONGPYTH:XAUUSD
Market structure suggests is preparing for its next move.
The AND level will likely play a critical role in the upcoming direction.
** If structure breaks and confirms the shift, a new bias might form after the retest. **

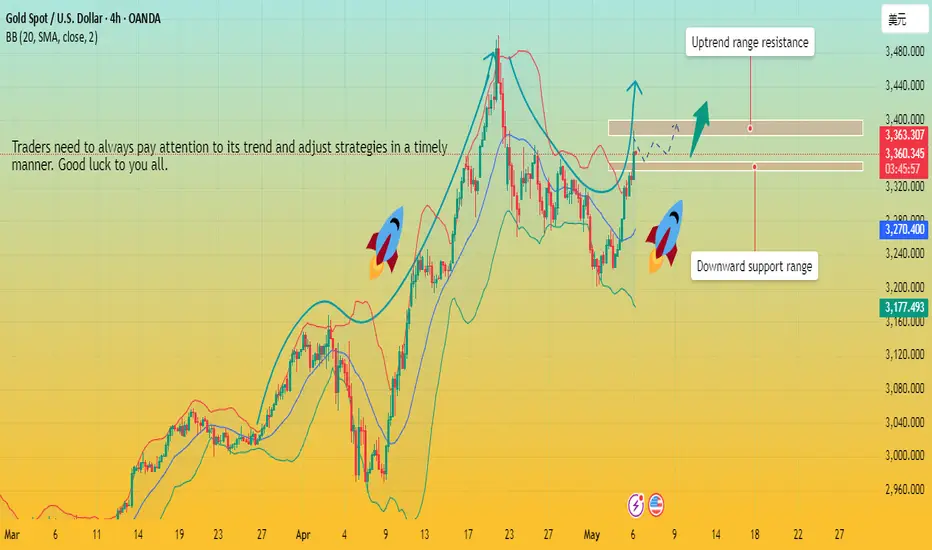
Gold key resistance not broken, Continuation of weak shock!📌 Pattern analysis and attention:
📊Technical aspects: The current golden week maintains a range of 3260-3360 fluctuations, showing a weak oscillation pattern of falling first and then rising, but with stronger downward momentum. Technical aspects show that 3360 is a short-term long-short watershed. If it cannot be broken through, it will maintain low-level fluctuations; 3340 is the core key position. If it stands firm, it will turn into a strong oscillation, otherwise it will continue to be weak. The first two days of the week closed below 3320, confirming short-term weakness.
🎯Practical strategy: Short sell when it rebounds to 3320-3325 area, target 3310-3300.

Gold suddenly rose. Be wary of gold’s retracement?The ADP report released in the morning said that the pace of hiring slowed sharply in April as companies prepared to deal with the possible impact of US President Trump's tariffs on US trading partners.
This month, the number of new jobs in the US private sector was only 62,000, the smallest increase since July 2024, significantly lower than the expectation of 115,000, and slower than the 147,000 increase after the downward revision in March.
After the data was released, spot gold rose in the short term and once touched around $3,320.
Gold fell to a low of 3,266 in the morning. With the release of ADP data, it was another short-term rise of $50-60.
Many traders may not know where to start with the current gold market and think it is still in the process of rectification.
Of course, it is definitely not wrong to look at it this way, after all, gold is still in the process of rectification.
However, traders should be alert that some Asian countries have entered a trading suspension state starting today, and it will last for about 5 days. The price of gold may fall during this period.
Quaid's analysis:
Gold rose to around 3320 in the morning, but failed to break through the upward resistance level of 3325. And 3320 is the 618 position of the trend Fibonacci from 3352 to the low point of 3266. If 3320 is the current high point of wave B, then 3352 is point A. Then point C is likely to appear around 3230.
Therefore, Quide believes that gold is likely to break down.
Operation suggestions:
Short at 3305-2210, stop loss at 3317, and take profit at 3250-3230.
Thank you for reading. If traders can leave your different suggestions, Quide will be very grateful to you.
