Gold may face sharp fluctuations,The risk of downside increases!Technical analysis: Gold daily line rose by more than $100 on Thursday, creating a rare single-day increase in more than ten years. The cumulative increase in three days exceeded $200, and the technical indicators were overbought. The current gold price is in the stage of accelerating to the top. In the short term, pay attention to the resistance of the 3245-3250 area, and be alert to the risk of falling back after a high. Although the trend is still strong, the effectiveness of technical analysis is weakened under the guidance of news. It is recommended to focus on high altitude. This week is the fifth week of rising, and the probability of a change on Friday increases.
Ⅰ: The daily indicator macd golden cross is initially established, and the smart indicator sto quickly repairs upward, representing the bullish trend of the price. At present, because it is a historical high, there is no resistance point to judge, so we can only try it based on the small cycle indicators. The current support point of the daily line is located near the moving average MA5 and MA10, 3096-3088, and it is not considered to be far away from the candlestick chart.
Ⅱ: The current macd high golden cross in 4 hours is oscillating with large volume, and the smart indicator sto is overbought, which means that the price is oscillating at a high level. Because the indicators are at a relatively high level, they may face short-term peak signals at any time. Currently, we are focusing on the support line of 3176 near the MA5 moving average.
Ⅲ: The hourly MACD is currently oscillating with large volume, and the dynamic indicator STO is overbought, which means that the hourly line is still oscillating strongly. The current focus is on the 3220 line*. If it breaks through 3220 this hour, it will continue to look for a high point. Otherwise, a small cycle peak signal will be formed at this position. The current support below the hourly line is located at the MA5 and MA10 moving averages, and the focus is on the MA10 support line of 3185. Comprehensive thinking: The current price is oscillating at a high level, and the short-term focus is on the 3220 line*. If it breaks through, the price will continue to move upward. The current focus below is the support near 3190. If it falls below, the price may move to around 3150-3135.
Strategy: Refer to 3440-45 for short selling
Goldpreis

Gold buying momentum is off the charts!Market news:
In the early Asian session on Friday (April 11), spot gold continued to rise, reaching a high of $3,220/ounce, setting a new record high. The unexpected slowdown in US inflation dragged down the US dollar, and the international trade war continued to push investors to safe-haven gold. As trade tensions intensified, market risk aversion suddenly heated up, and the price of gold in London soared by more than $200!The first monthly price decline in nearly five years released by the U.S. Department of Labor on Thursday also showed that demand was weak amid growing concerns about a recession caused by tariffs, which also led financial markets to expect that the Federal Reserve may cut interest rates by 100 basis points this year. After the release of the U.S. CPI data, traders bet that the Federal Reserve will resume rate cuts in June, and may accumulate a 1 percentage point cut by the end of this year. Low interest rates are usually good for international gold because gold does not pay interest. As the situation of declining confidence has already formed, Federal Reserve officials are worried that this will further suppress consumption and investment. This week, Fed policymakers said they still believe that tariffs are a blow to economic growth and increase the risk of rising inflation, putting monetary policy at a difficult crossroads. Several Fed officials will still speak on Friday, and investors need to pay attention to them. In addition, they need to pay attention to the performance of the March PPI data, the international trade situation and the changes in market risk aversion.
Technical review:
The gold daily line closed with a big positive line with a gain of more than $100 yesterday. This single-day gain is extremely rare in more than 10 years. The market has been extremely crazy with a rise of $200 in two trading days. On Thursday, gold hit a new high in the US market. Market sentiment completely followed the tariff war. Technical analysis is pale and powerless to grasp it. We can only control risks and reduce positions to operate. The gold price stood on the middle track and the short-term moving average 5MA, that is, the 3030-3040 line, and the closing price was just above the MA10 daily line. This morning, gold continued to rise strongly relying on the MA10 daily line, and the current highest has reached the 3220 line. With such a strong impact, the rapid decline in the three trading days on the daily line has turned into a bottoming out and rebound. Whether it continues to break high or buy correction, it is just that the impact of the tariff war has accelerated the amplitude and time. According to the previous large rise, if the buying sentiment continues to be high, the next position is 3300.
Today's analysis
Gold has risen strongly, continuously setting new historical highs, and the buying momentum is strong! At the 4-hour level, the support level has moved up. The 1-hour moving average of gold has formed a golden cross upward buying arrangement, indicating that gold buying still has the power to rise further. At present, the gold price has set a new historical high, and it is not advisable to rush to chase the rise at this time. The short-term operation strategy can wait for the price to step back, and after stabilizing below, buy in combination with the support level. Today, the highest gold in the Asian session has risen to 3220, and the demand for risk aversion has increased. Most people have a high degree of attention and willingness to buy gold. Judging from the market trend, gold has already stood firm at the previous high of 3167, and the buying trend has continued. In the past few days, the daily increase in gold has exceeded 100 US dollars. I believe that the increase in gold prices today will not be too small, and today's gold is expected to further move towards the 3300 mark. Wait for a correction during the session and buy on the trend!
Operation ideas:
Buy short-term gold at 3177-3180, stop loss at 3168, target at 3220-3230;
Sell short-term gold at 3233-3236, stop loss at 3245, target at 3200-3190;
Key points:
First support level: 3200, second support level: 3185, third support level: 3170
First resistance level: 3223, second resistance level: 3236, third resistance level: 3250

Insight into the gold market situation and seize the opportunityHello everyone! After in-depth research and analysis of the recent market conditions, I believe that the current market has entered the stage of accelerating to the top.
From a technical point of view, such as the MACD top divergence sign, the KDJ indicator oversold, etc., all signs show that the market's upward momentum is gradually weakening, while the price is rising rapidly, which is often a typical feature of the peak stage.
The focus needs to be on the 3225-3235 area. This range has important resistance significance and has dense locked-in disks. On the other hand, through technical analysis tools such as the Fibonacci sequence, this range is also an important pressure range.
For investors with short trading rights, this is a rare opportunity to go high and short. When the price reaches the 3225-3235 area, it is a relatively ideal time to enter the short market. The one-hour moving average golden cross is formed, but after the upper rail of the Bollinger band is broken, the technical overbought risk increases, and the support near 3150 is effective. 80 points are also possible, so don't look at the current trend with a conventional perspective.

Accurately capture the gold pullback, shorting is the right timeDuring this period, spot gold has been like a rocket, advancing all the way and firmly in the upward channel. I have repeatedly reminded everyone before that once the US tariff stick is swung, the gold price will definitely rush up like a chicken blood. No, the facts prove that our prediction is quite reliable!
Tonight, the market ushered in another "big news" - the release of CPI data. As soon as this data came out, it directly gave the gold price a "heart shot", and the gold price was instantly pushed to around US$3160. This rise is too crazy! Interpret this data as soon as possible and pay close attention to the reaction of the gold market.
However, when the gold price rose to the previous high of US$3158-3168, it was like hitting a wall and began to "struggle". From my technical analysis point of view, there is a relatively strong resistance level in this range. It's like a person climbing a mountain, climbing to a certain height, and encountering a steep cliff. If you want to continue to go up, you have to work hard. At present, the gold price is under pressure at this position, and there are some signs of a correction. This provides us investors with a small opportunity to consider trying a short position here and earn some spread profits. I also suggest that investors can properly seize this short-term opportunity.
For example, the current gold market is like a fierce football game. The long team is strong and has been attacking all the way, and is in a dominant position. The short team can only seize the opportunity occasionally and make a quick counterattack. We investors are like coaches, and we must arrange tactics reasonably according to the situation on the field. When the long side is dominant, we can use short selling to increase our profits in a timely manner. I hope everyone can accurately grasp the market rhythm like an excellent coach.

Will gold fall after a strong rise Goldmarket analysis referenceAnalysis of gold market trend: Today's gold is still fluctuating greatly under the influence of tariffs. Today, we have analyzed that gold has the risk of callback, and long positions are also falling back to lows! Trend realization analysis and ideas! From the surge on Wednesday, it can be seen that the risk aversion sentiment of gold has heated up again. The current highest is 3132, which is the first target point for the rise. If it continues to rise, it can see 3150 above, so there is still a lot of room above. Everyone should pay attention to trading with the trend as much as possible. In addition, there is another uncertain factor today. The US market will release CPI data, which will also bring abnormal fluctuations in gold. Therefore, the market will also fluctuate greatly today. Everyone should pay attention to controlling risks and managing positions well.
From a technical point of view, a positive line on the daily line directly changed the extremely weak adjustment state in the previous period. Now the positive line breaks the middle track of Bollinger and pulls up the moving average. Then, gold has entered an extremely strong state of bullish trend. In this state, it will continue to rise to the previous high of 3150. Therefore, the main direction today is definitely bullish. It is normal for the small cycle to adjust under the pressure of 3100. Now the Bollinger of the 4-hour cycle has just opened, and the unilateral trend has just taken the first wave of strength. There is no problem in the next wave to rise to the high point of the daily cycle. Therefore, as long as the 4-hour cycle falls back to the support of the unilateral moving average, it is an opportunity to do more. The support below is around 3070, and the rise of the hourly cycle is around 3060. Therefore, today's gold bullishness is expected to consider 3080 or 3070. The rise in the Asian and European sessions is still at 3130. If the US session breaks through 3136, consider seeing the high point of 3150. On the whole, today's short-term operation strategy for gold is to short on rebounds and to buy on pullbacks. The upper short-term focus is on the 3136-3155 resistance line, and the lower short-term focus is on the 3080-3078 support line. Friends must keep up with the rhythm. You must control your positions and stop losses, set stop losses strictly, and do not resist single operations. The specific points are mainly based on real-time intraday trading. Welcome to experience and exchange real-time market conditions.
Gold operation strategy reference: Short order strategy: Strategy 1: Short gold rebounds near 3133-3136, with a target of 3100-3090, and a break to look at the 3080 line.
Long order strategy: Strategy 2: Go long near the 3078-3080 pullback of gold, with a target of 3105-3125, and a break to look at the 3135 line.

Gold (XAU/USD) Bullish Breakout Trade Setup – Targeting 3,130Chart Analysis
Trend & Structure
CHoCH (Change of Character): Marked on the chart, indicating a potential trend reversal from bearish to bullish.
The price has broken above a descending trendline and is forming higher highs and higher lows, supporting a bullish bias.
EMAs
EMA 30 (red) and EMA 200 (blue):
EMA 30 has crossed above EMA 200, which is often considered a bullish signal.
The price is currently trading above both EMAs, reinforcing the upward momentum.
---
Trade Setup
Entry Zone
The purple highlighted area between ~3,026 and 3,035, acting as a potential demand zone (previous

XAU/USD(20250409) Today's AnalysisMarket news:
The U.S. Customs and Border Protection Agency reiterated that the specific tax rates for each country will be announced at 12:01 a.m. on April 9.
Technical analysis:
Today's buying and selling boundaries:
2993
Support and resistance levels:
3040
3022
3011
2974
2963
2945
Trading strategy:
If the price breaks through 2993, consider buying, the first target price is 3011
If the price breaks through 2974, consider selling, the first target price is 2963

Gold fell100 points for 3 consecutive days Market trend analysisStop loss is always right, even if it is wrong; holding on is always wrong, even if it is right. Stop loss is unconditional! Without trading principles and trading discipline, all technology is equal to zero!
Spot gold fell by $212 in three days, and the bears shined. A while ago, we warned of the risks, but many people scoffed at it, thinking it was alarmist and that gold would not fall. The money earned by the bull market will definitely be lost with the principal and interest under the belief of the bull market. The three-day plunge in gold is enough to make many people return to the time before opening an account in three days!
The market staged a "holiday conspiracy theory" market, because the heat has reached, and it is facing the implementation of equal tariffs. The previous surge in gold is to buy expectations and sell facts. The bullish atmosphere is unprecedentedly high, and the main force can harvest it.
How arrogant the bulls of gold were at the beginning, how embarrassed they are now; the bears are far stronger than the bulls, the bulls cut meat with a blunt knife, and the bears cut the Gordian knot with a quick knife! Gold plunged $112 from 3167 to 3055 last Thursday, $120 from 3136 to 3016 on Thursday, and $100 from 3056 to 2056 yesterday, Monday. Last year, there were five days with a plunge of nearly or more than $100, and three consecutive days recently. Because the price is high, there will be more single-day plunges of 100 or more this year.
Yesterday, all three major U.S. stock indexes stopped falling at the lifeline of bulls and ushered in an oversold rebound. The panic decline of crude oil and silver was also alleviated. Silver stopped falling at the key support of bulls at 28-28.5. It shows that risk sentiment has been alleviated to a certain extent. Market risk sentiment has been released, and gold shorts also need to rest. The main force of gold has cultivated too many bulls from January to April 2025, and cultivated the bull market thinking of retail investors. It will definitely kill the bulls with the help of this round of sharp decline, and gold can start to rise again! In the medium term, the rebound correction is for a better decline. 2956-50 will be broken, and then 2930-2880 will be broken, and the ultimate 2830 will be broken. Today is the fourth day of the decline. The decline stopped at 2956 in the early morning, which is the previous high point. At present, the first round of gold decline in the short term has been in place. Many people panicked after three days of sharp decline. Those who bought the bottom dared not buy the bottom, and those who did not short should chase the short. The main force will continue to wash the market! Today, the correction rebound is mainly seen. The upper resistance focuses on 3000, then 3030-25 and yesterday's high 3045-55 area.
The focus of the day is 2956-60, and the short-term support is 2970-75. In theory, if you want to wash the market, wash it harder. 3000 can't stop it. Pay attention to the 3020-35 range, and even rush to yesterday's high area and then fall. Gold fluctuates by more than ten or dozens of dollars in 5 minutes. The article can only give ideas and areas. More specific strategies need to be given offline in combination with real trading. Orders must be strictly carried out with losses to prevent being stuck in the wrong direction. In an emotional market, watch more and do less!
In today's market:
1: In 4 hours, the stochastic indicator temporarily forms a small golden cross, but the strength and continuity of the golden cross are not shown; MACD double lines are downward, which is a bearish signal; the indicator is not a resonant bearish signal, so the 4-hour bias is corrected; in terms of form, it breaks the bottom and sets a new low, constantly pierces, and constantly rebounds. The support near the low of 2950 is effective here, and the back and forth piercing near 2970 is of little reference significance; the second decline is around 3050 and around 3020;
2: In the daily K, the stochastic indicator continues to cross, so the main high-altitude treatment is used; MACD double lines diverge, which is a bearish signal; the daily K is a resonant bearish signal, so the main idea of shorting at highs is used; the current central axis position is around 3010;
To sum up: the intraday short-term trend is around 2950 in 4 hours, and the decline rebounds; after the correction rebound, we continue to treat it as a high-altitude; several pressure positions 3 010-3020,
The second is around 3050, followed by around 3090; on the long side, the layout is in the range of 2955-2965; the large range is positioned in the range of 3050-2950
Strategy:
Short around 3015-17, defend 3024, target 3000-2990, the operation has been made and is not considered
Long around 2995-97, defend 299 0, the target 3000-3010-3030 has been entered and is no longer considered
Intraday short around 3030-40, defense 3045, target 3000--2980-2960-2930
Intraday secondary long around 2962-64, defense 2956, target 2975-2990
After falling below 2955, it will reach 2930 and 2880.

Gold's slow rise approaches key resistance! Follow 3020Early layout plan for gold: On Tuesday, the public strategy suggested shorting gold at 3015, which was perfectly hit again, and successfully obtained high-altitude profits. In the real market, short orders near 3014 were also arranged, and the market closed at 3000-2998, and then 14-16 points of profit were collected!
Gold technical analysis: On Monday, gold went long and short, and then rushed up and fell back! Yesterday, it was also mentioned that it was still a high-opening strategy, and then gold rebounded and plummeted in the evening; from a technical point of view, the previous gold daily chart encountered resistance near the historical important resistance level of 3135 and then went down, pulling out a big negative line, which is a strong message for the shorts! Although the current gold price is close to the lower track of the Bollinger band below, the shorts are still very strong.
But at present, our general direction is still bearish. In addition, according to the current 4-hour chart, gold formed a double top pattern correction in the early stage. Although the short-selling force is strong at present, the long-selling force is not weak. The slow rise and pullback in the early trading has some strength. The upper resistance is still around 3020, and the key pressure is above 3035!
Gold operation strategy: short around 3015-3020, defend the key resistance of 30-35, and target 2990-80!
Investing shouldn't be so difficult. I will provide one-on-one real-time guidance and tracking services for each customer, and will also share professional opinions in time to closely grasp the market dynamics. Here, you don't need to face the complex market alone. I will help you capture opportunities accurately and keep a close eye on the market. You just need to go to work as usual and accompany your family with peace of mind. When the trading opportunity comes, I will notify you as soon as possible. You just need to do a good job of entry and exit operations and reasonable position control. Don't ignore risks due to greed or negligence to avoid major losses due to sudden changes in the market. At the same time, the market is like sailing against the current. If you don't advance, you will retreat. Investors need to continue to pay attention to market dynamics, continue to learn and improve their investment capabilities, and adjust investment strategies in time to cope with the ever-changing market. This is the relaxed state that investment should have. Only 1-5 orders a day, follow a stable strategy, and continue to reap profits. Whether it is to recover the cost or to achieve several times the growth of funds, you can do it. When the market trends come, I'll be there! Please follow and contact me in time!

XAU/USD) Bearish analysis Read The ChaptianSMC Trading point update
This chart analysis of Gold (XAU/USD) on the 2-hour timeframe appears to be a bearish setup based on Smart Money Concepts (SMC). Here's a breakdown
Key Elements:
1. Price Channel Break & CHoCH:
The price was in a rising channel.
A clear Change of Character (CHoCH) occurred after the price broke below the structure, signaling a shift from bullish to bearish.
2. Fair Value Gap (FVG):
There's a bearish Fair Value Gap (FVG) highlighted in the yellow box around the 3,047–3,075 level.
The expectation is that price may retrace into this FVG before continuing downward.
Mr SMC Trading point
3. Target Zone:
A major demand zone or target point is marked around 2,940, indicating a potential bearish move of around -148 points (~4.8%) from the FVG.
4. EMA & RSI:
200 EMA is around 3,047, acting as dynamic resistance now.
RSI is below 40 and trending down, showing bearish momentum with slight bullish divergence, hinting at a short retracement before another drop.
---
Summary of the Idea:
Bias: Bearish
Trade Plan:
Wait for price to retrace into the FVG zone (~3,047–3,075).
Look for bearish confirmation (like bearish engulfing or rejections).
Enter short with a target at 2,940, stop above FVG.
Let me know if you’d like help formulating a trade setup or risk management plan based on this.
Pales support boost 🚀 analysis follow)

gold buy signal. Don't forget about stop-loss.
Write in the comments all your questions and instruments analysis of which you want to see.
Friends, push the like button, write a comment, and share with your mates - that would be the best THANK YOU.
P.S. I personally will open entry if the price will show it according to my strategy.
Always make your analysis before a trade

Gold's 4-hour range has been broken, waiting for further declineTechnical analysis of gold: Gold continued to fall in the US market, and the price continued to return to the low point of the Asian market. The rise was not continuous, and the impact of tariffs remained. The market reported that the tariffs would be suspended for 90 days. It can be seen that US stocks, crude oil, gold and silver all rose rapidly, and then it was confirmed to be false news, and then fell back quickly. It can be seen that as long as the impact of the tariff news does not change, all assets will continue to be sold. However, the current fluctuations are too fast and the amplitude is too large. Short-term operations may not be easy to start, but the direction is still the most important, followed by the position. In other words, gold will continue to fall sharply. Gold continued to rebound at the opening today. The rebound amplitude actually exceeded our expectations, but the recent market is actually volatile. Because the fluctuations are relatively large, it is reasonable to have a larger amplitude, but it increases the difficulty of operation. Gold fell back after rising again, and now it is caught in a large range of fluctuations, but the overall trend is still bearish. The US market rebound is still bearish.
Gold's 1-hour moving average continues to cross the downward short divergence, and the short force has not weakened; the rebound is still short. Although gold rushed up after filling the gap in 1 hour, the upper shadow line quickly came down. The overall situation is still weak. It is under pressure near 3050 in the short term. The US rebound is under pressure at 3012 resistance, so it can continue to be short. The market is changing rapidly. Although gold seems to rebound strongly, it will eventually rush up and fall back. Gold is still the home of the shorts. However, it is now volatile. Pay attention to patiently wait for the rebound, and the volatility should not be underestimated. However, the thinking is still to maintain a high-altitude thinking. On the whole, the short-term operation of gold today is recommended to be short-selling on rebounds and long-selling on callbacks. The short-term focus on the upper side is 3012-3015 resistance, and the short-term focus on the lower side is 2950-2956 support. Friends must keep up with the rhythm. It is necessary to control the position and stop loss, set stop loss strictly, and do not resist single operation.
Gold operation strategy reference: Short order strategy: short gold rebound near 3012-3015, stop loss 10 points, target near 2980-2970, break to see 2956
Long order strategy: long gold callback near 2953-2956, stop loss 10 points, target near 2970-2980, break to see 3000

Gold rebounded sharply. Will gold climb again?Gold trend analysis: There are many points worth interpreting in the intraday market. Let's review and replay:
Today, the market bottomed out and rebounded in the morning. Did you chase the short position after the opening fell sharply? The 2980 first-line support was tested many times without breaking, which is a move to lure shorts, waiting for you to get trapped.
What was the result? Did it rebound at the 2980 first-line support? From the low point of 2972 to the high point of 3054, the hourly single-yang rebound amplitude reached 82 US dollars, which did not give you a chance to escape at all.
The position of 3054 is in line with the 3050-3060 regional pressure we mentioned at the weekend. It is a top-bottom conversion position. The low point of last Thursday broke the support and turned into pressure on Friday. Today, it must be shorted anyway.
Of course, there is also a false move here at 3054. The first time it touched the pressure and fell to 3036, and then it attacked again to test 3054 again. Did you chase the long position? Once you chase it, you're done. Then it fell to 3017, and the drop of 37 US dollars directly wiped out your extra money.
So, if you say whether technical analysis is useful or not, it is definitely useful. Of course, there are times when it fails, such as the straight-line decline of the whole process like last Thursday and Friday. Any analysis is meaningless, but this is a minority after all. The technical reliability of returning to normal trend is still trustworthy.
Gold technical analysis: Today is the third consecutive day of decline. From a technical point of view, such a continuous sharp decline generally lasts for about 3 days, and no more than 4 days at most, and it will turn positive. Therefore, the decline of gold today has slowed down significantly.
The intraday rebound is under pressure at 3054 and it is sideways. The European session is volatile and ready to guard against a high and fall at night. Focus on the break of the 3054 line of pressure. If it breaks through the intraday low of 3013 at night, then look at the second drop to the low of 2980-2972, and pay attention to whether a double bottom support structure can be formed here.

gold The plunge exceeded 100 points,The bearish trend is crazy!This week brings new trading opportunities, as well as new market opportunities. Nowadays, the market fluctuates greatly every day. Being a short-term trade means high frequency, fast in and fast out. As long as you do these well, you can make money in short-term trading. Don't be greedy for more. The most important thing in trading is stability. Going fast is not as good as going steadily. Do a good job in daily trading. If you can get two or three waves of profits, it will be enough for you. If you do not have the ability to flexibly respond to the market during trading, and are not good at adjusting your trading thinking and rhythm to the market rhythm in a timely manner, you can contact me and let us pursue more profits flexibly and stably in the volatile market!
The K-line of the Golden Week closed at a medium-sized Yin high with a long upper shadow. forming a top heavy-volume adjustment in the short term. The daily negative adjustment engulfed the previous rising space. In terms of form, there is still room for adjustment this week, which can be continued to 2972 and 2956, while the top touches 3168 to explore the high and fall back pattern. , there is a high probability of forming a short-term high, but whether the trend will change needs to be further observed. Beware of weekly negative singles without consecutive negatives. The short-term pressure remains at 3058 and 3076. It will bottom out at the opening and rebound. First look at the strength of the rebound. At the top, focus on the pressure of 3055 first, and then look at 3076 if it breaks. Do not blindly chase shorts. Don't blindly chase the short position.
Operation suggestion: Gold is short near 3070-75, stop loss at 3080, and look at 3055 and 3020; if it is weak, pay attention to the 3055 pressure to short!

Analysis of gold price trend next week!Market news:
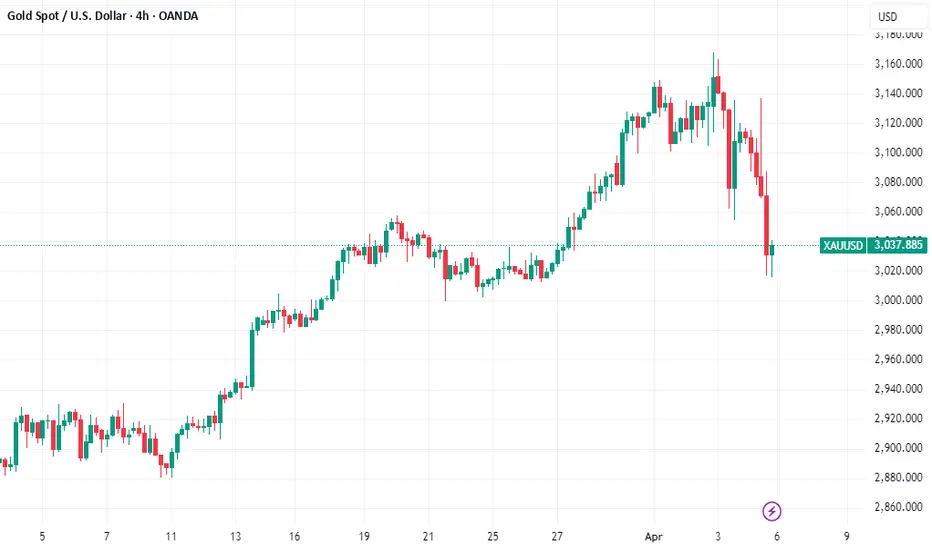
This week, the international gold price staged a "roller coaster" market. Spot gold continued to rise from Monday to Thursday, and on Thursday (April 3), it hit a record high of $3,167/ounce, but on Friday (April 4), it plummeted by more than $75 in a single day, falling to a low of $3,015, a drop of 2.44%, and finally closed at $3,038/ounce, narrowing the weekly increase to 1.2%. Precious metals such as silver and platinum fell simultaneously, among which spot silver fell by 7.2% in a single week, the worst performance since September 2020. This sharp fluctuation stems from two key events: Trump's tariff policy has caused global concerns to heat up, and Federal Reserve Chairman Powell's unexpected turn to hawkish monetary policy. The market liquidity crisis caused investors to sell gold to make up for stock market losses, and the US dollar index strengthened by 0.9%, further suppressing international gold prices. The better-than-expected non-farm payrolls report released by the United States on Friday was another reason for the blow to gold prices. The U.S. Department of Labor reported that after seasonal adjustment, non-farm payrolls in March recorded 228,000, an increase higher than the market expectation of 135,000. Non-farm payrolls data will help the Federal Reserve postpone interest rate cuts. International gold usually performs well in a low interest rate environment. Looking ahead to next week, investors need to focus on the verification of inflation expectations by the U.S. CPI data in March (April 10), the market reaction after the tariff measures are officially implemented, and whether the speeches of Fed officials will release more policy signals.
Technical Review:
After a series of large negative declines, gold is currently in a short-term trend that is bearish. The daily line has a large negative downward trend, breaking the short-term moving average and piercing the middle track, leaving a lower shadow below. The pattern shows a bearish signal of Yin Bao Yang engulfing. In the short term, it may rely on the middle track support to confirm the 10ma resistance and fall again. The 4-hour Bollinger Bands open downward, and the K-line continues to decline. The trend is bearish and downward. The gold market on Thursday and Friday this week can be described as thrilling, with a rise and fall of more than 200 points in two days! The gold market has changed suddenly, and there has been an extremely violent sweep. First, it rose rapidly to 3136 without any signs, and then fell back quickly at lightning speed, and fell below the intraday low. At present, the daily gold line has risen and fallen. The sharp rise in the early trading did not continue. It was under pressure at the high of 3168 and quickly entered an adjustment, with a downward adjustment space of more than 100 US dollars. After the high-level fluctuations of gold in the past two days, gold finally broke down on Friday night. In fact, the market was too active in the past two days, and the overall volatility was large. In fact, it was still a little difficult to operate. Although the overall outlook was bearish, the rebound amplitude was not small each time. Now sometimes it rebounded by more than 20 US dollars in a few minutes, so it may appear that it will continue to fall after a just loss. Now the high level of the gold daily line is covered by dark clouds, so how to operate next week?
Next week's analysis:
From the overall trend, the weak pattern of gold is beyond doubt, and it is reasonable to continue to be under pressure and downward. Therefore, it is recommended to pay attention to the 3050-3054 area next week, and continue to look at the 3060-3070 area above. The support that needs to be focused on is the 3000 mark shown by the weekly 5-day moving average slightly moving down. Above it, it will rebound, and breaking it will open a new round of downward space. The gold 1-hour moving average has formed a dead cross downward, so the gold bears still have power. The short-term gold can only rebound. After the gold rebounds, it will continue to sell, and then gold will enter a shock. After the gold falls sharply from a high level, it is more advantageous to sell in the short term. Unless there is a big profit to buy, it is difficult for gold to rise directly. The last physical K-line box of gold in the 1 hour will form a short-term suppression. The gold rebound resistance is 3076. If it is under pressure, then the gold rebound will continue to sell at highs.
Operation ideas:
Buy short-term gold at 3013-3015, stop loss at 3004, target at 3050-3060;
Sell short-term gold at 3063-3065, stop loss at 3075, target at 3020-3030;
Key points:
First support level: 3015, second support level: 3000, third support level: 2988
First resistance level: 3048, second resistance level: 3056, third resistance level: 3074

Gold (XAUUSD) Bullish Reversal Setup – FVG Entry to EMA 200 ResiThis chart shows a potential bullish setup for Gold (XAUUSD) on the 15-minute timeframe, with some key technical elements and a projected trade idea. Here's a breakdown of the analysis:
1. Current Market Overview
Price: Trading around $3,038.51.
Trend: Recent downtrend followed by a minor recovery.
Indicators:
EMA 200 (Blue): Currently at $3,090.41, acting as a dynamic resistance.
EMA 30 (Red): Positioned below the EMA 200, indicating a still bearish trend but with potential for a pullback.
2. Key Zones & Labels
Limit Entry Zone: Highlighted around $3,025.72 (bottom purple zone)
Labeled as “LIMIT ENTRY”, indicating a potential buy entry.
This area corresponds with a fair value gap (fvg) — often used in smart money concepts as a sign of institutional interest.
Target Zone: Around $3,082.22 (top purple zone)
Labeled as “target point EA”.
Lies just below the EMA 200 resistance level, which is a likely take-profit area for a bullish move.
3. Projected Price Action
A possible bullish retracement is anticipated:
Dip into the limit entry/fvg zone at ~$3,025.
Then, a rally targeting the $3,082 zone, possibly extending toward the EMA 200 at ~$3,090.
4. Trade Setup (Based on the Chart)
Entry: Around $3,025.72 (limit buy)
Target: Between $3,082.22 - $3,090.41
Risk: Likely below the FVG zone (~$3,015–$3,020), depending on risk appetite.
Conclusion
This is a smart money concept-based setup anticipating a liquidity grab or fair value gap fill before a bullish move. The trade aims for a reversal at a key demand zone, with confirmation from EMA confluence above as a profit target.
Would you like help plotting stop-loss levels or analyzing the risk/reward ratio?

Gold Price Drops on Tariff Selloff
Gold, long considered a safe-haven asset during times of economic uncertainty, experienced a sharp reversal of fortune this Friday, tumbling as much as 2.4% and extending losses from the previous session. This significant decline came as a surprise to many who had witnessed the precious metal steadily climb to record highs in recent weeks, fueled by persistent inflation concerns, geopolitical instability, and expectations of easing monetary policy. However, the resurgence of tariff anxieties has triggered a broad selloff across various asset classes, including gold, as investors recalibrate their risk exposure in the face of heightened economic uncertainty.1
The catalyst for this sudden shift in market sentiment has been the renewed threat of escalating trade tensions.2 While the specifics of the "tariff shock" are crucial in understanding the market reaction, the general principle is that the imposition or threat of tariffs can disrupt global supply chains, increase costs for businesses and consumers, and ultimately dampen economic growth.3 This increased uncertainty and the potential for negative economic consequences have prompted investors to reassess their portfolios and, in many cases, reduce their exposure to assets perceived as riskier or less liquid, even those traditionally considered safe havens.4
Gold's traditional role as a safe haven stems from its historical use as a store of value, its limited supply, and its lack of correlation with traditional financial assets during periods of stress.5 In times of economic turmoil, investors often flock to gold as a hedge against inflation, currency devaluation, and market volatility.6 This flight to safety typically drives up the price of bullion.7
However, the current market reaction suggests a more nuanced dynamic at play. The tariff shock appears to have triggered a broader reassessment of risk, leading to a selloff that encompasses not only equities and other riskier assets but also traditional safe havens like gold. Several factors could be contributing to this phenomenon.
Firstly, the prospect of tariffs can lead to concerns about slower global growth.8 If economic activity contracts, it could reduce overall demand, potentially impacting even safe-haven assets like gold, particularly if investors anticipate lower inflation in the long run. While gold is often seen as an inflation hedge, a significant deflationary shock could negatively affect its price.
Secondly, the imposition of tariffs can create uncertainty about future economic policies and international relations.9 This uncertainty can lead to increased volatility across all asset classes, prompting investors to reduce overall exposure and move towards cash or other highly liquid assets. In such scenarios, even assets perceived as safe havens might be sold off as part of a broader de-risking strategy.
Thirdly, the recent run-up in gold prices to record highs might have made it a target for profit-taking. After a significant rally, any negative news or shift in market sentiment can trigger a wave of selling as investors look to lock in gains. The tariff shock could have provided the catalyst for such profit-taking, exacerbating the downward pressure on gold prices.
Furthermore, the interconnectedness of global financial markets means that negative sentiment in one area can quickly spread to others.10 The fear of a trade war can impact equity markets, leading to margin calls or a general desire to reduce risk across portfolios, which could include selling gold holdings.
The extent of the gold selloff – a 2.4% drop in a single day is significant for a traditionally stable asset – underscores the severity of the market's reaction to the tariff news. This move also highlights the fact that even safe-haven assets are not immune to broad market dislocations and shifts in investor sentiment.
Looking ahead, the trajectory of gold prices will likely depend heavily on how the tariff situation unfolds and its actual impact on the global economy. If the tariff threats escalate into a full-blown trade war with significant negative consequences for growth and corporate earnings, we could see further volatility across all asset classes. In such a scenario, the initial reaction might be continued selling pressure on gold as investors prioritize liquidity and de-risking.
However, if the economic fallout from tariffs becomes more apparent and concerns about stagflation (slow growth with high inflation) resurface, gold's traditional safe-haven appeal could reassert itself. In a stagflationary environment, gold could once again become an attractive asset as a hedge against both economic stagnation and the erosion of purchasing power.
Moreover, any signs of easing monetary policy by central banks in response to slowing economic growth could also provide support for gold prices. Lower interest rates reduce the opportunity cost of holding non-yielding assets like gold and can also be inflationary in the long run.
In conclusion, the recent tumble in gold prices following the tariff shock demonstrates that even traditional safe-haven assets are susceptible to broad market selloffs triggered by significant economic uncertainties. The initial reaction appears to be driven by a general de-risking across asset classes and potential profit-taking after gold's recent record highs. However, the future performance of gold will depend on the evolving economic landscape, the actual impact of tariffs, and the response of monetary policy. While the immediate reaction has been negative, gold's role as a potential hedge against economic turmoil and inflation could see it regain its footing if the negative consequences of the tariff shock become more pronounced. Investors should closely monitor developments in trade policies and their broader economic implications to gauge the future direction of gold prices. The current volatility serves as a reminder that even in the realm of safe havens, market dynamics can shift rapidly and unexpectedly.
Gold market analysis, gold operation strategy and trend analysisGold early layout plan: intraday top and bottom capture is perfect! The strategy layout is truly presented, the strategy prompts shorting at 3135, accurately cashing in the high point, and falling sharply to 3070! Continue to arrange 3072 long positions to smoothly stop profit and exit at 3086.
Gold fell by 110 yesterday and rebounded by 80. Today it fell by 30 and rebounded by 50. The volatility is too big. However, the risk comes first. Strictly set a stop loss. Loss of $5-$20 makes no difference. It is not a big loss. Secondly, grasp the key points. Pay attention to a few points of non-agricultural data and cooperate with the five-minute entry on the right side. As for long and short, it is really not very important. What is important is the key position and starting point. After multiple cycles of quantification, pay attention to a few important points at night. After the operation is in place, enter the market with the resonance of one minute and five minutes. The loss is 5-6 points, and the target is 15-20 points.
Operation strategy 1: It is recommended to buy at 3018-3025, and the loss is 3005, and the target is 3035-3045

4.4 Gold is low and long, wait for non-agricultureYesterday, the gold market opened at 3134.1 in the morning. The market first fell back to 3122.6 and then rose strongly. After breaking the previous high, it reached a high of 2167.9. After that, the market began to fall under the cooperation of fundamentals and technical profit-taking. The intraday low was 3053.6. After that, the market rose strongly and reached 3135.8 before consolidating. The daily line finally closed at 3114.1. The daily line closed in a spindle shape with a very long lower shadow. After this shape ended, after the break of 2940 and 2958, the long positions were reduced, and the stop loss was followed up at 3050. If it falls back to 3082 first today, the long stop loss is 3075. The target is 3115 and 3132. If it breaks, the target is 3140 and 3150.

Structural analysis and operation suggestions after gold washAnalysis of gold market trend: Gold fluctuated quite a lot yesterday. It rose at the opening yesterday, rising to nearly 60 US dollars, and then fell back after being blocked at the 3167 line. However, it fell below 3100, and the lowest to the top and bottom conversion was around 3054, a drop of nearly 114 US dollars. Beyond expectations, it pulled back to 80 US dollars, and the daily line finally closed with a cross Yin line. The rapid roller coaster is too scary. The market volatility is too large, so you can only watch more and do less. If you encounter non-agricultural data, according to yesterday's trend, the market may not be so big today. After all, it has already ended yesterday. When the price fell sharply, and then there was a sharp rebound to stand firm at 3100, the market of gold yesterday was thrilling, a super roller coaster, and the difficulty of gold operation has increased a lot. However, this kind of market is rare after all. After the ups and downs of gold, it will return to normal. Although today's non-agricultural data, I personally tend to fluctuate in a large range. It is estimated that it will not break yesterday's high point or yesterday's low point. If combined with silver, gold is still oscillating and bearish. At present, it should peak in the short term, and it will choose a direction after a correction.
Gold technical analysis: Therefore, gold is not as strong as before, so it is possible for gold to rise or fall in this state. Pay attention to the previous high of 3150 on the upside, and pay attention to the gains and losses of 3055 on the downside. The 4-hour cycle has cleverly entered the oscillation range. Although the market has gone out of the big drop space, the 4-hour cycle Bollinger has not opened, and the moving average system has not diverged. The effective range for the time being is within 3085/3135. Therefore, if there is no large fluctuation on Friday, you can refer to the range of the 4-hour cycle to do high-altitude and low-multiple transactions. The 1-hour moving average of gold still shows signs of turning downward, but the rise of gold in the US market has not allowed the 1-hour moving average of gold to enter the dead cross pattern, but the gold bulls are not very strong. Of course, there is also the impact of non-agricultural data. It is expected that after the big rise and fall on Thursday, the impact of Friday's data will not be great. Before the release of non-agricultural data, we should operate in the range of 3120-3066. On the whole, the short-term operation strategy of gold today is to short on rebound and long on pullback. The short-term focus on the upper side is 3120-3125 resistance, and the short-term focus on the lower side is 3054-3066 support. Friends must keep up with the rhythm. We must control the position and stop loss, set stop loss strictly, and do not resist single operation. The specific points are mainly based on real-time intraday. Welcome to experience, exchange real-time market conditions, and follow real-time orders.
Gold operation strategy: Short order strategy: Strategy 1: Short gold rebound near 3120-3125, stop loss 6 points, target near 3100-3085, break to see 3065 line;
Long order strategy: Strategy 2: Long gold pullback near 3070-3065, stop loss 6 points, target near 3100-3090, break to see 3110 line;

Gold (XAU/USD) Technical Analysis: SMC Trading point update
This chart is a technical analysis of Gold (XAU/USD) on a 4-hour timeframe. Here’s a breakdown
1. Ascending Channel:
The price is moving within an upward channel, showing a bullish trend.
Higher highs and higher lows confirm the uptrend.
2. Support and Resistance Zones:
Yellow Boxes: Key support zones where price previously consolidated before moving higher.
Red Arrows: Marking resistance zones where the price faced rejection.
Green Arrows: Indicating support levels where the price bounced.
3. Current Price Action:
Price recently dropped to a key support zone (around $3,050).
A bullish reaction is expected from this level.
If support holds, the price may continue the uptrend toward the target of $3,186.
4. Projected Move:
The black zigzag line suggests a potential bounce from support.
If the support level holds, price could move back up within the channel.
Mr SMC Trading point
Conclusion:
If price respects the support zone, there could be a good buying opportunity.
A break below the support zone would signal potential bearish movement.
Monitoring price action around the yellow zone is crucial for confirming direction.
Pales support boost 🚀 analysis follow )

Is the golden large-scale "roller coaster" near miss?Gold took a large "V"-shaped reversal pattern on Thursday, with the highest hitting 3167 in the Asian session, and continued to fluctuate and fall in the European session. It successfully fell to the lowest 3054 before the US session and then rebounded. As of now, gold has deeply bottomed out and rebounded to 3135. It has now started the oscillation mode. Gold continues to fluctuate in the range of 3100-3135, waiting for the release of the initial jobless claims data in the US session. The data is bearish, and the shorts broke through the 3080 line. After all, the technical adjustment is almost done, and everyone can find opportunities to go long. Later, gold hit the 3054 line and rebounded quickly, and the long orders also recovered the losses. This process is full of thrills and excitement. After all, such a large bottoming rebound is relatively rare. If your current gold operation is not ideal, I hope I can help you avoid detours in your investment. Welcome to communicate with us!
From the 4-hour analysis, pay attention to the short-term suppression of 3130-35 on the upper side, and pay attention to the short-term support around 3100-3106 on the lower side. Pay attention to the support of 3083-3087. After stabilizing above this position, continue to follow the low-long rhythm, and stick to the idea of going long after stepping back. I will remind you of the specific operation strategy during the trading session, so pay attention to it in time.
Gold operation strategy: Go long at 3105-3095

The battle for the 3200 mark is imminentThe United States has officially launched a tax increase policy on major global trading partners. The wide range of goods involved and the high tax increase are rare in history. The essence of the tax increase is to require countries to have the same tax rate on US goods as the US export tax rate to them. For example, if Indian motorcycles face a 2.4% tax in the United States, and American motorcycles are taxed 100% in India, the United States will reversely tax Indian motorcycles at 100%. This "tit-for-tat" mechanism directly leads to a surge in the price of imported goods, and companies are forced to restructure their supply chains. Next, once the Federal Reserve starts to cut interest rates, gold is bound to reach a new level. Cutting interest rates is the general trend. When the economy is down, only by cutting interest rates can economic development be stimulated, and raising interest rates will only push the economy to the brink of collapse. The US economy is already in collapse, not on the edge!
After the tariff news, gold quickly retreated to 3105 and then soared, reaching a high of 3168. Gold, hold the position of 3100 US dollars, which is the key to determine the long and short positions. The rising market is not about staring at the high point speculation, but the gains and losses of the key support area. As long as the key support is not broken, the rising trend will not see the top.
Gold operation suggestion: long around 3120-3110
