The long-short sweep may still explodeThe tariffs were also successfully implemented. In response, the market bulls and bears also responded strongly. After all, the 3105-3142 area rose and fell in seconds, which was a terrifying market. Of course, to be honest, this wave of turbulence was mostly caused by institutions. After all, the market smashing was also extremely strong. However, I don’t agree with the impact of the tariffs implemented last night. First of all, looking back at the market situation, Trump said that tariffs would be imposed on many countries, which actually meant a 20% retaliatory tariff on the European Union. As for some other countries, only a 10% general levy was implemented, which relatively resulted in an unequal tariff situation. Of course, Trump also reiterated that Canada and Mexico still have tariff exemptions in a limited range of goods. So what impact will this situation have on the bulls and bears of gold? To be honest, personally, I have undoubtedly overestimated the announcement of this tariff. In other words, the implementation of this tariff is a bit insufficient in my eyes. After all, I expected that Trump would make major changes in his previous speech. As a result, it is a significant reduction compared to his previous years in office. This has also limited the outbreak of risk aversion. Of course, trade risks definitely exist, but through the matter of adding Mexico, this is completely negotiable. For this tariff event, I don’t think there is a big risk stimulus. Of course, the key is to see whether the market buys it. If the market thinks it will stimulate long-term risk aversion, then it will inevitably be pushed up by buying. However, the intensity of yesterday’s tariffs was not strong in my opinion. This may also limit the outbreak of longs to a certain extent. After all, the market’s expectations for it were too strong in the early stage, which also led to the early rise of longs, which also included the digestion of news. For this, you still need to be cautious.
Then looking back at the current market, the tariffs have been implemented, and in a blink of an eye, we will also welcome the announcement of non-agricultural data. As far as the current market is concerned, the various US economic data have also improved relatively. After all, the substantial growth of ADP has undoubtedly dispelled the rumors of economic downturn. After all, the warming of the labor market undoubtedly reflects the warming of the US economy. Under the influence of tariffs, it has indeed boosted the US economy. Of course, the impact of the data is not just that. The current remarks about the slowdown in inflation are self-defeating. Due to the implementation of tariffs, inflation is likely to rise further. This directly hits the Fed's expectations of a rate cut, and the warming of the labor market has further limited the possibility of the Fed implementing a rate cut. In this regard, no matter what the final result of the market outlook is, based on the current situation, I personally think that it is really difficult for the Fed to implement a rate cut this year, which has also led to a reduction in the momentum of gold bulls. Moreover, if this situation continues, the Fed does not rule out the possibility of being forced to implement a rate hike. Although Trump is also calling on the Fed to cut interest rates, the fact is that it cannot be implemented at present, unless the US talks with other countries again during this period to discuss a reduction, as it did with Canada and Mexico. Otherwise, as time goes by, as the tariff issue intensifies, inflation will be restricted, thus affecting the implementation of the Fed's policy. At this time, you can pay more attention to the market dynamics.
So for today, although gold is currently stimulated to rise, I don't quite agree with the emergence of new highs for gold bulls. To put it bluntly, for now, even if a new high appears, gold breaks through 3160, which is more of a possibility of inducing more. I am not saying that I am blindly bearish, but you have actually seen that gold is blocked at a high level, and the momentum of falling back is also extremely strong, especially gold started three consecutive positives last Friday, and as of Tuesday this week, it stopped falling near the highest point of 3149. The bull outbreak is already facing exhaustion. Even if the bulls rise again today, where can they rise, to 3200? Then what? You should know that it is cold at the top. Unless there is absolute bullish momentum to support gold to continue to rise, there will be a peak at any time. The short space is still large, just waiting for an opportunity. In particular, the sharp increase in ADP has led to the market betting on the negative non-agricultural data. Once gold is blocked from rising, it will inevitably collapse in an instant. Especially when this kind of news stimulates gold to rise, retail investors in the market will not consider its fundamentals. They will only think that interest rate cuts are absolutely good for bulls and the implementation of tariffs is absolutely good for bulls, which will lead to buying. This is also a chance for institutions to snipe bulls. For this, for today and tomorrow, even if gold breaks a new high, you should not blindly follow the trend. Remember to guard against the possibility of a resurgence of shorts. In this regard, I personally prefer the possibility of shorts looking back at the possibility of breaking 3100 and falling to 3080-3050. You can be cautious about this.
As for today's opening, gold opened high at 3141, and encountered a flash crash at 3128 at the opening, and then rebounded to 3139 and then flash crashed to 3123. This performance can be said to be extremely strong. In this case, I certainly cannot notify the operation. After all, the fluctuation is too fast. With a quote every second, even if you give an order, you may not be able to enter the market in time. For this, you still need to wait for the market to calm down. As for today's market, the fluctuation may be relatively strong. You can wait and see and be cautious. As for the specific operation details, I will give them in real time. Remember to strictly follow my requirements to control the position and stop loss.
Goldpreis

Gold Market and the Impact of Trump’s Tariff PolicyGold prices hit a new all-time high as investors seek safe haven assets amid growing uncertainty in the global economy. After several rounds of market turmoil, investors have recovered somewhat in Asian markets this week. In the coming week, the focus will be on the reciprocal tariff plan that Trump will announce on April 2. If Trump decides to take tough measures and implement high tariffs across the board, it may have a big impact on the market. However, if there is some relaxation of tariff policies, such as tax exemptions for specific countries, then the market may have a chance to rebound.
Trump was proud of Wall Street's record highs during his first term, but now seems to be less concerned about the stock market and more focused on the adjustment of overall economic policies. I think this may be the time to make structural changes to the US economy, although these adjustments may bring challenges in the short term, but the hope is that the economy will recover before the mid-term elections next year.
In addition, Asian stock markets have also been affected by volatility, especially the automotive industries in Japan and South Korea are under pressure. The automotive manufacturing industries in these countries face the challenge of change due to the upcoming 25% tariffs. Investors are full of doubts about Trump's tariff policy, and market sentiment is cautious, and all parties are waiting for the policy announcement on April 2.
In short, although the market has rebounded in the short term, future trends still need to focus on Trump’s tariff decisions and their potential impact on the global economy.

Regional shocks, friends holding positions should pay attention!Technical analysis of gold: Gold first rose and then fell, but the subsequent rebound was indeed quite strong, exceeding our expectations. Gold fell into a large range of fluctuations, which added a certain degree of difficulty to the operation. Although gold rebounded beyond expectations, it still did not break through today's high point, so it is still under pressure in the range of the head and shoulders top pattern. At most, it is still a shock, and there is no need to think about whether it will rise sharply.
The 1-hour moving average of gold has gradually begun to show signs of turning, and the 1-hour gold is also a head and shoulders top pattern. Even if it is pulled back and forth again, gold will continue to fluctuate in a large range. There are more data in the second half of this week, and there are also important events. So gold still needs to wait for news or data to let gold go out of a new round of direction. If gold does not break through the intraday high, we will continue to focus on high altitude. Retracement is supplemented by long positions.
Gold operation strategy: short gold when it rebounds to 3130-3035, stop loss at 3140, target 3120-3110; long gold when it falls back to 3110-3100, target 3120-3130.
Trading discipline: 1. Don't blindly follow the trend: Don't be swayed by market sentiment and other people's opinions, operate according to your own operation plan. Market information is complicated and blindly following the trend can easily lead to the dilemma of chasing ups and downs.
2. In gold trading, we will continue to pay attention to news and technical changes, inform us in time if there are any changes, strictly implement trading strategies and trading disciplines, move forward steadily in the volatile market, and achieve stable asset appreciation.

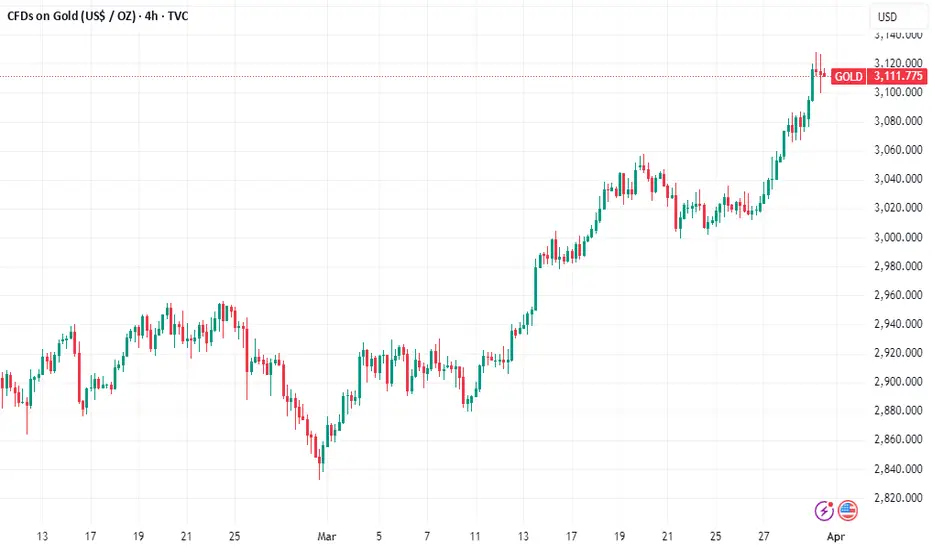
Beware of gold tariff changes! Intraday Gold Trading Buckle UpGold news: In the early Asian session on Wednesday (April 2), spot gold fluctuated in a narrow range and is currently trading around $3114.90/ounce. Gold prices rose and fell on Tuesday. Spot gold rose to around the 3150 mark earlier, setting a new record high of $3148.85/ounce, but then fell back due to profit-taking, closing at $3114.03/ounce, down about 0.3%. US President Trump plans to announce comprehensive tariffs on countries with trade imbalances with the United States on April 2, which has spawned a large number of safe-haven buying, helping gold prices to continue to rise, but near the last moment, some bulls took profits in advance. Gold has always been seen as a hedge against geopolitical and economic uncertainties. On Monday, gold closed with its strongest quarterly performance since 1986 and broke through $3,100 per ounce, becoming one of the most significant gains in the history of precious metals.
Technical analysis of gold: Gold 4-hour chart retreated to the middle track and paused for a while. Today, the battle between the high point 3148 and the 4-hour middle track will be fought. Losing the middle track will further increase the adjustment space. On the contrary, holding the middle track to recover the high point will continue the slow rise. The market outlook will continue to cooperate with the slow rise method of one step back and one turn back. That is, the repeated high-exploration and fall method. From the 1-hour chart of gold, the rising volume at the end of the wave-shaped tail is usually not sustainable, accompanied by the one-step back and one-step wash-out method. After yesterday's retreat, today's early trading rose quickly, accompanied by a big negative line in the hourly chart to retrace and correct, and stepped back to the local high of 3150. The fluctuation base is large and the adjustment space can be large or small. It is not easy to chase high at the current position. Although shorting is against the trend, the implementation of overbought tariffs on the technical level will also be realized, and the room for adjustment cannot be underestimated. We should use ultra-short-term combined with medium and long-term short-term to respond to short-term adjustments. On the whole, today's short-term operation of gold recommends shorting mainly on rebounds, supplemented by longs on callbacks. The top short-term focus is on the first-line resistance of 3138-3140, and the bottom short-term focus is on the first-line support of 3100-3083. Friends, you must keep up with the rhythm. It is necessary to control the position and stop loss, set stop loss strictly, and do not resist the order operation. The specific points are mainly based on real-time intraday trading. Welcome to experience and exchange real-time market conditions. 🌐Follow real-time orders.
Gold operation strategy reference: Short order strategy: Strategy 1: Short stop loss of 6 points near 3136-3138 when gold rebounds, target around 3115-3100, break the position and look at 3085 line;
Long order strategy: Strategy 2: Go long when gold pulls back around 3105-3095, stop loss 6 points, target around 3120-3110, and look at the 3130 line if the position is broken;
Trading discipline: 1. Don’t follow the trend blindly: Don’t be swayed by market sentiment and other people’s opinions, and operate according to your own operation plan. The market information is complicated and complex, and blindly following the trend can easily lead to the dilemma of chasing ups and downs.
2. In gold trading, we will continue to pay attention to news and technical changes, notify you in time if there are any changes, strictly implement trading strategies and trading disciplines, move forward steadily in the volatile market, and achieve stable asset appreciation.

3100 Danger? Has a short trend emerged after gold’s sharp fall?If you persist in doing something for three days, it is just a whim! If you persist in doing it for three months, it is just a start! If you persist in doing it for 10 years, it can be considered a career! Whether in life or trading, if you want to succeed, it is like sailing against the current. If you don’t advance, you will retreat. Only by working hard, persisting, moving forward bravely, and overcoming obstacles can you reap your own "success"! A new day begins, and every step of the strategy is the beginning of a battle. Execute the operation, if you don’t move, you will be fine, but if you move, you will be thunderous! 1-5 current price transactions per day make the operation easier!
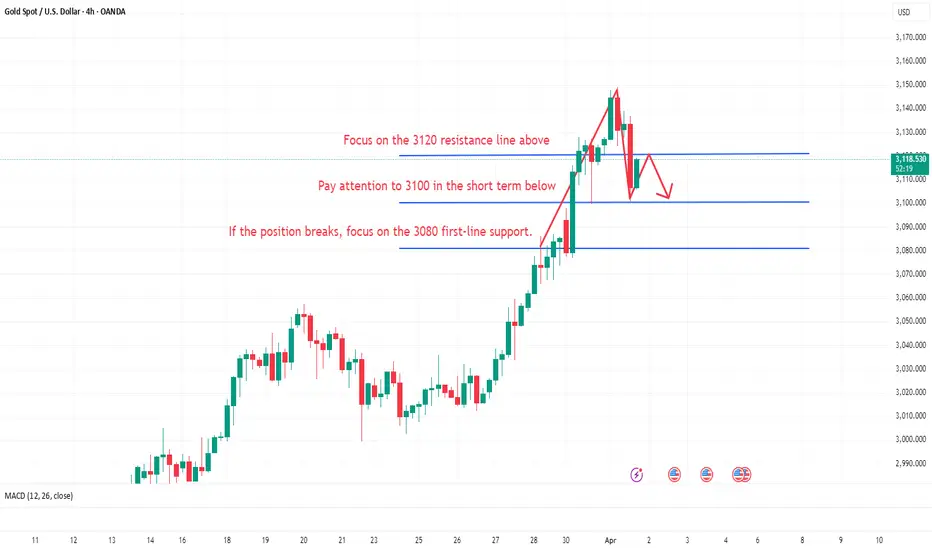
Gold technical analysis: After the gold surged, it appeared under pressure. The price reached 3149 and then retreated. The US market continued to decline after the shock. Don’t do more if it falls below 3120 in the evening, and be alert to the possibility of retreating to 3100. The short-term means that the bulls have temporarily come to an end and began to retreat and adjust the trend.
In addition to Trump’s announcement of tariffs this week, there will also be non-agricultural data, so this week is destined to be extraordinary. This is also the risk that has been repeatedly reminded. Don't be blindly overwhelmed by bulls. You need to respect the market at all times. After falling below 3120, there is room for a retracement, but whether the overall trend has turned is still uncertain. This week is very critical. There are important fundamental news. It is necessary to confirm whether it will change the fundamentals. Only when there is a change will the trend turn. Pay attention to the 3120 first-line resistance on the top of the 4-hour chart, and pay attention to the 3100 support on the bottom in the short term. It is recommended to operate in the range. Gold operation suggestion: short selling near 3115-3119, stop loss 3130, target 3105-3100
Trading discipline: 1. Don't blindly follow the trend: Don't be swayed by market sentiment and other people's opinions, operate according to your own operation plan, market information is complicated, and blindly following the trend is easy to fall into the dilemma of chasing ups and downs.
2. In gold trading, we will continue to pay attention to news and technical changes, inform you in time if there are changes, strictly implement trading strategies and trading disciplines, move forward steadily in the volatile market, and achieve stable asset appreciation.
The bulls continue to reach new highsEarly layout plan for gold: As mentioned in our previous article, we decisively laid out gold short positions when entering the market at key points in the early stage, strictly implemented the fast-in-fast-out trading strategy mentioned in our article, perfectly hit the stop-profit target TP, and successfully made profits.
Gold technical analysis: Gold bulls dominate the screen, continuously breaking new historical highs. The current highest has reached 3149. The daily line has also closed positively, galloping in the market, invincible, and also let the bears flee. The current trend is basically in a regular form. The bullish trend is still strong. The early opening sprint broke through the 3130 line. We directly went long in the real market and successfully reached the target 3140-3145. Yesterday, the technical side of gold ushered in an accelerated rise in the Asian market. In the afternoon, the bulls in the European market continued to break through and stand above the 3100 integer mark to reach 3120 and continue to fluctuate strongly. Last night, the US market retreated twice to confirm that it stabilized at the 3100 mark and further continued to break through the 3127 mark and closed strongly. Our real market and the analysis of the article before the US market last night also successfully entered the long order at the 3103 line. I believe that friends who follow me can see that if your current gold operation is not ideal, I hope I can help you avoid detours in your investment. Welcome to communicate!
From the 4-hour analysis, today's short-term support is around 3117-3124, with a focus on the 3100-3106 line. Intraday operations follow the retracement and continue to be long. The short-term bullish strong dividing line focuses on the 3096-3100 line. The daily level stabilizes above this position and continues to maintain a low-long rhythm. Short selling can only enter the market at key points, and enter and exit quickly, without fighting. I will remind you of the specific operation strategy during the session, so pay attention to it in time.
Gold operation strategy: 1. Gold retracement 3117-3124 line long, retracement 3100-3106 line long, stop loss 3097, target 3145-3150 line, break and continue to hold;
Trading discipline: 1. Don't blindly follow the trend: Don't be swayed by market sentiment and other people's opinions, operate according to your own operation plan, market information is complicated, blindly following the trend is easy to fall into the dilemma of chasing ups and downs.
2. In gold trading, we will continue to pay attention to news and technological changes, notify you in a timely manner if there are any changes, strictly implement trading strategies and trading disciplines, move forward steadily in the volatile market, and achieve steady asset appreciation.

Verified again, bulls continue to hit new highsGold technical analysis: Gold opened at 3130 in the morning. Yesterday, gold technically accelerated in the Asian session. The European session bulls continued to break through and stood above the 3100 integer mark to reach 3120 and continued to fluctuate strongly. The US session stepped back twice to confirm the stabilization of the 3100 mark and further continued to break through the 3127 mark and closed strongly. Friends who follow me can see that our real-time analysis and the analysis of the article before the US session also successfully entered the long order at the 3103 line. This also verifies the 3127-3130 line suppression given in my article last night. The daily K-line closed with a shock and broke through the high-middle Yang. The overall gold price ushered in the rhythm of bulls accelerating the rise after breaking through the 3050 mark. The daily level closed with a strong medium-yang for three consecutive trading days. If your current gold operation is not ideal, I hope I can help you avoid detours in your investment. Welcome to communicate!
From the 4-hour analysis, today's short-term support is around 3118-3124, with a focus on the 3100-3106 line. Intraday operations follow the retracement and continue to be long. The short-term bullish strong dividing line focuses on the 3096-3100 line. The daily level stabilizes above this position and continues to maintain a low-long rhythm. Short selling can only enter the market at key points, and enter and exit quickly, and do not fight. I will remind you of the specific operation strategy during the session, so please pay attention to it in time.
Gold operation strategy: 1. Gold retracement 3116-3124 line long, retracement 3100-3106 line continue to cover long positions, stop loss 3097, target 3145-3150 line, and continue to hold if it breaks.
Trading discipline: 1. Do not blindly follow the trend: Do not be swayed by market sentiment and other people's opinions, operate according to your own operation plan, market information is complicated, and blindly following the trend can easily fall into the dilemma of chasing ups and downs.
2. In gold trading, we will continue to pay attention to news and technical changes, inform you in a timely manner if there are any changes, strictly implement trading strategies and trading disciplines, move forward steadily in volatile markets, and achieve steady asset appreciation.

Strong acceleration to the top? Gold trading analysis strategyGold early layout plan: Long and short strategies in the real market all the way to stop profit, lucrative profits, witnessed by the whole network!
News: On the fundamentals, last week's re-strengthening, in addition to the escalation of tensions in the global economy and trade, there is also support from the Middle East tensions and the optimistic impact of the Ukraine negotiations that are not as expected; and this week will usher in Trump's tariff week, and countries are currently relatively tough and oppose the unilateral imposition of tariffs by the United States. And a comprehensive response is about to be made. This will increase economic concerns and the safe-haven demand for gold. Therefore, although there are some profit-taking and resistance suppression in the gold price at present, under the mutual game of global trade tariffs and the intensification of geopolitical tensions, a temporary retracement is still creating entry opportunities for bulls, and in the short term, it is still expected to refresh the historical high to around US$3,150. In the day, we will pay attention to data such as the Chicago PMI in March and the Dallas Fed Business Activity Index in March in the United States. It is expected that the impact will be limited. According to the trend of last week, there is also momentum for strengthening again. Therefore, the day will still be bullish and rebound-oriented. This week, the focus will be on the implementation of global trade tariffs on Wednesday and the non-farm payrolls report on Friday, which may strengthen gold's safe-haven appeal. Other important data include Tuesday's ISM manufacturing PMI and JOLTS job openings, Wednesday's ADP employment, and Thursday's ISM non-manufacturing PMI and initial jobless claims.
Gold technical analysis: Gold technical analysis: Gold is really simple, you can make money with your eyes closed, and now it has reached the point where everyone can make money. On the contrary, I began to become cautious and timid. Gold jumped high in the early trading, quickly sold off and washed the market, and successfully got many people off the bus with a trick of fishing for the moon in the bottom of the sea, and then pulled up all the way, which was really strong. I emphasized before that gold would not peak if it did not soar by hundreds of dollars, and now this rhythm is getting closer and closer. Today, it rose by 50 US dollars a day. I dare to guarantee that there will be another day of 100 US dollars this week, which means that the top is just around the corner. Go long with the trend, but don't be a long-term investor. Today, we will focus on the breakout of 3127-30. If it fails to break higher, then this point may become a short-term high point. It is best to go long when it falls back to around 3100-3105. Finally, I would like to advise the majority of retail investors that when the market fluctuates violently, if you cannot control yourself and go with the trend, overall, today's short-term operation strategy for gold is to go long on pullbacks and go short on rebounds. The short-term focus on the upper resistance of 3128-3130 and the short-term focus on the lower support of 3100-3097. Friends must keep up with the rhythm. Maintain the main pullback and go long. In the middle position, watch more and do less, be cautious in chasing orders, and wait patiently for key points to enter the market. I will remind you of the specific operation strategy during the session, and pay attention to it in time. If your current gold operation is not ideal, I hope that your investment can avoid detours. Welcome to communicate with us!
Gold operation strategy: Go long on the 3100-3105 line of gold.
Trading discipline: 1. Don’t blindly follow the trend: Don’t be swayed by market sentiment and other people’s opinions. Follow your own operation plan. Market information is complicated and blindly following the trend can easily lead to the dilemma of chasing ups and downs.
2. In gold trading, we will continue to pay attention to news and technical changes, inform us in time if there are any changes, strictly implement trading strategies and trading disciplines, move forward steadily in the volatile market, and achieve stable asset appreciation.
(Note: The above strategy is based on the current trend, and will be adjusted according to real-time fluctuations during trading. It is for reference only)

Gold's Historic Ascent: Breaking the $3,100 Barrier
Gold, the timeless safe-haven asset, has surged to unprecedented heights, breaching the $3,100 per ounce mark for the first time in history. This remarkable rally, fueled by a confluence of geopolitical tensions and economic anxieties, underscores gold's enduring appeal as a hedge against uncertainty. The recent surge, surpassing the previous record set just days prior, signals a potent shift in investor sentiment, driven significantly by the United States' imposition of new levies.
The Catalyst: US Levies and Geopolitical Turmoil
The primary catalyst for gold's dramatic ascent is the escalating geopolitical landscape, particularly the United States' implementation of new levies. These levies, often associated with trade disputes and economic protectionism, inject uncertainty into global markets. Investors, seeking to mitigate potential losses, flock to safe-haven assets like gold, driving its price upward.
Beyond the immediate impact of US levies, a broader sense of economic fragility permeates the market. Concerns about inflation, rising interest rates, and potential economic slowdowns have created a climate of apprehension. In such environments, gold's historical role as a store of value becomes increasingly attractive, bolstering its demand.
Gold's Safe-Haven Status: A Time-Tested Phenomenon
Gold's allure as a safe-haven asset is deeply rooted in its intrinsic properties and historical performance. Unlike fiat currencies, which are susceptible to inflation and government policies, gold retains its value over long periods. In times of economic and political instability, gold tends to outperform other asset classes, serving as a reliable hedge against market volatility.
This safe-haven status is further reinforced by gold's limited supply and its universal recognition as a valuable asset. The precious metal's physical nature and its role in various industries, from jewelry to electronics, contribute to its enduring demand.
The Market Reaction: A Surge in Investor Confidence
The surge in gold prices reflects a significant shift in investor confidence. As traditional investment avenues become increasingly risky, investors are turning to gold as a means of preserving capital. The influx of funds into gold-backed exchange-traded funds (ETFs) and other gold-related investments underscores this trend.
The market's reaction also highlights the interconnectedness of global economies. The US levies, while originating from a single nation, have reverberated across international markets, triggering a flight to safety. This demonstrates the profound impact of geopolitical events on investor behavior and asset prices.
Analyzing the Price Surge: Factors at Play
Several factors contribute to gold's current price surge:
• Currency Fluctuations: A weakening US dollar can make gold more attractive to investors holding other currencies.
• Inflationary Pressures: Rising inflation erodes the purchasing power of fiat currencies, increasing the appeal of gold as an inflation hedge.
• Interest Rate Policies: Lower interest rates can reduce the opportunity cost of holding gold, as it does not generate interest income.
• Geopolitical Instability: Political conflicts, trade disputes, and economic sanctions create uncertainty, driving demand for safe-haven assets.
• Central Bank Purchases: Central banks often hold gold reserves as a hedge against currency fluctuations and economic instability. Their purchasing activity can influence gold prices.
•
Looking Ahead: The Future of Gold Prices
Predicting future gold prices is inherently challenging, as they are influenced by a complex interplay of factors. However, several trends suggest that gold's upward trajectory may continue:
• Persistent Geopolitical Tensions: Ongoing political conflicts and trade disputes are likely to sustain demand for safe-haven assets.
• Economic Uncertainty: Concerns about inflation, rising interest rates, and potential economic slowdowns are expected to persist.
• Increased Investor Interest: The recent surge in gold prices has attracted significant investor attention, potentially leading to further inflows of funds.
However, potential headwinds could also impact gold prices:
• Strengthening US Dollar: A stronger US dollar could make gold less attractive to international investors.
• Rising Interest Rates: Higher interest rates could increase the opportunity cost of holding gold.
• Improved Economic Outlook: A more optimistic economic outlook could reduce demand for safe-haven assets.
The Significance of Gold's Milestone
Gold's breach of the $3,100 mark is a significant milestone, reflecting the profound impact of geopolitical tensions and economic anxieties on global markets. It underscores gold's enduring role as a safe-haven asset and its ability to preserve value in times of uncertainty.
As investors navigate the complexities of the global economy, gold is likely to remain a key component of diversified investment portfolios. Its historical performance, intrinsic properties, and universal appeal make it a compelling asset in an increasingly uncertain world.
3.31 Gold US market operation analysis suggestions!Gold intraday analysis and operation: How to judge the next step after gold breaks through 3130!
Gold's strong rise in the Asian session has brought the price of gold close to 3130 and finally stagnated at 3127. The impact of the US market has not yet appeared, but with the current trend, the volatility of gold tonight will not be too small. The overall idea is to maintain the low north. The intraday volatility range is maintained within the range of 40 points between 3090 and 3130. The current increase has exceeded market expectations. Although there is selling pressure, it is all suppressed by the bulls!
US market pressure focus: 3130-3150 above and 3110-3095 below
The above analysis is a personal analysis suggestion, I hope it can bring some gains to everyone!
We will update regularly every day and introduce to you how we manage active ideas and settings. Thank you for your likes, comments and attention, we are very grateful

Gold surges and then falls, indicating an imminent fallGold early stage layout plan: Long and short strategy all the way to stop profit in the actual market, huge profits, witnessed by the whole network!
Technical analysis of gold: At present, Trump's tariff policy will be officially announced on Wednesday. Today, Asian stock markets fell across the board in the Asian session, because Asian stock markets opened the earliest. According to historical laws, the stock market's reaction is the fastest. European stocks may also fall across the board. The short-term decline in the stock market often brings a short-term rebound in the price of gold. Focus on the trend of the US stock market. Once the US stock market falls sharply and rapidly, it is often accompanied by a rapid decline in the price of gold. In the morning, the price of gold has rebounded by more than 50 points from the low of 3076 to 3127. After rebounding by more than 50 points, we can intervene in short selling at 3120-25, and close the position when it falls back to around 3105-15. Today, the European and American sessions focus on the breakout of 3127-30. If the European session fails to break higher, then this point may become a short-term high point. It is best to take long positions when it falls back to around 3105-3100. Finally, I would like to advise all retail investors that when the market fluctuates violently, if you cannot control yourself and go with the trend, then shorting may be the best choice. It is better not to do it than to make mistakes! Watching more and doing less is also a suitable strategy. I will remind you of the specific operation strategy during the trading session, and you should pay attention to it in time. If your current gold operation is not ideal, I hope that your investment can avoid detours. Welcome to communicate and exchange!
Gold operation strategy: short gold at 3120-25, target 3105-3115, and go long at 3110-3100.
Trading discipline: 1. Don't blindly follow the trend: Don't be swayed by market sentiment and other people's opinions, and operate according to your own operation plan. Market information is complicated and blindly following the trend is easy to fall into the dilemma of chasing ups and downs.
2. In gold trading, we will continue to pay attention to news and technical changes, inform you in time if there are any changes, strictly implement trading strategies and trading disciplines, move forward steadily in the volatile market, and achieve stable asset appreciation.
(Note: The above strategy is based on the current trend, and will be adjusted according to real-time fluctuations during trading. It is for reference only)

Next week’s opening trend forecast and layout!Early layout plan for gold: long and short strategies in the real market, all the way to profit, rich profits, witnessed by the whole network!
Technical analysis of gold: Gold rose again at the end of Friday, and finally closed the daily line with a bald positive line. After a brief adjustment, it rose again. Then, there will be high points to see next week. Continue to maintain the main decline and long, and do not guess the top for the bullish trend. This week is also a long and short strategy to stop profit all the way, and the intraday harvest is rich! The daily support is near 3057, but the strong will not have too much retracement, otherwise it will turn into shock, and the low point of the fall is near 3073. On Monday, the strong will rely on this position to be bullish. The upper pressure is near 3087. Don’t chase more before breaking the position. Breaking the position will gradually see above 3100! Next week, we will continue to focus on retracement and long, but don’t chase more. After all, the technical side needs to step back and adjust. Stepping back and long is the way to go with the trend. Maintain the main retracement and long, and watch more and move less in the middle position. Be cautious and chase orders, and wait patiently for key points to enter the market. I will remind you of the specific operation strategy during the trading session, please pay attention to it in time. If your current gold operation is not ideal, I hope that your investment can avoid detours. Welcome to communicate with us!
Gold operation strategy: Go long when gold falls back to 3070-60.
Trading discipline: 1. Don't blindly follow the trend: Don't be swayed by market sentiment and other people's opinions. Follow your own operation plan. Market information is complicated and blindly following the trend can easily lead to the dilemma of chasing ups and downs.
2. In gold trading, we will continue to pay attention to news and technical changes. Once there are changes, we will inform you in time, strictly implement trading strategies and trading disciplines, move forward steadily in the volatile market, and achieve stable asset appreciation.
(Note: The above strategy is based on the current trend, and will be adjusted according to real-time fluctuations during trading. It is for reference only)

GOLD XAUUSD ShortI m short. Gold can go even to 3100.No matter I sell more
Wall Street goes full bull with tariffs and payrolls looming
Gold surges toward $3,100 amid unrelenting rally
Smart money knows one thing very clearly: a large part of the bad news is already baked into the prices, and there is limited room for further downside. Especially considering the parabolic moves we’ve seen
Never the less we are in overbought zone,A correction coming.That will be good chance to buy Gold again

Accurately predict the timing of short position entryAs of now, we have made profits during the trading session. But gold hit the 3048 area yesterday. What should we do if some brothers did not close the order in time? We have made corresponding adjustments according to the current market.
Gold news:
On Friday, the price of gold climbed to 3083, mainly driven by factors such as rising risk aversion, the Federal Reserve's interest rate cuts, the global central bank's gold buying boom and increased inflationary pressure. The tense situation in the Middle East, global economic uncertainty and expectations of a depreciation of the US dollar have further enhanced the attractiveness of gold. This week, gold is expected to rise for the fourth consecutive week. The US PCE (personal consumption expenditure) data to be released tonight has attracted much attention from the market because it is the core indicator of the Federal Reserve to measure inflation and may have a significant impact on market expectations and asset prices. If the PCE data triggers concerns about stagflation, it may cause US Treasury yields to rise, further boosting gold prices. If the data eases inflationary pressures, it may boost risky assets, but gold may rise simultaneously due to rising expectations of interest rate cuts. Boosted by risk aversion, gold advanced all the way yesterday afternoon, hitting a new high of 3059 during the US trading session. Today's market continued to rise at the opening, and the current highest has reached 3086. Gold bulls rose like a tiger, where is the top?
Gold technical analysis: From the wave point of view, the large level is no longer repeated. The daily line 2832 runs a standard 5-wave structure upward, wave 1 2832-2929, wave 2 2929-2880, wave 3 2880-3057, wave 4 3057-2999. Yesterday's market broke through 3057 and rose. The current market is in the 5th wave. From the wave rule, wave 1 runs 97 US dollars. If the amplitude of wave 1 and wave 5 is equal, the high point of wave 5 can be seen near 3097. Using the Fibonacci retracement extension line, pay attention to the two resistance levels of 3088-3108 above. Therefore, the short-term continues to follow the trend of low-multiple bullishness. Pay attention to whether there is a structure to go short near 3108 above. Gold is currently high, and it is bound to fall back. This crazy bull trend cannot last long. This is inevitable. The gold price is currently seriously off track, that is, it is directly off track. This is unreasonable. Return is inevitable. There must be a deep fall today. The support below is around 3050, which is also the target of the fall.
Gold operation strategy: Short gold 3075-70 to increase the number of transactions. Target 3060-3050
Trading discipline: 1. Don't blindly follow the trend: Don't be swayed by market sentiment and other people's opinions. Follow your own operation plan. Market information is complicated and blindly following the trend is easy to fall into the dilemma of chasing ups and downs.
2. The short profit area of 3060-3050 is all closed.
3. In gold trading, we will continue to pay attention to news and technical changes, inform in time if there are changes, strictly implement trading strategies and trading disciplines, move forward steadily in the volatile market, and achieve stable asset appreciation.

Summary of this weekThis week, the gold market continued its bull market, breaking through the historical high of 84 and closing. The gold price broke through the psychological barrier of 3,000. The market sentiment continued to be optimistic.
In this week's trading, we took the main approach of going long, holding long positions, buying back, and making significant profits, achieving the expected goals.
Next week, we will continue to make steady progress and formulate a more efficient profit plan.
If you also want to learn gold trading skills and profits in the market, then join my team.
Wish you all: Have a good weekend

XAU/USD(20250328) Today's AnalysisToday's buying and selling boundaries:
3044.62
Support and resistance levels
3086.39
3070.78
3060.65
3028.58
3018.45
3002.84
Trading strategy:
If it breaks through 3060.65, consider buying, the first target price is 3070
If it breaks through 3044.62, consider selling, the first target price is 3028

Public strategy all correctSo far, everyone has made a profit by following the trading plan. We arranged short orders at 3032 and 3052 for gold, but the short-term trend was strong, so we all left the market at 3038! We collected another 80 points of profit! The operation idea is very clear.
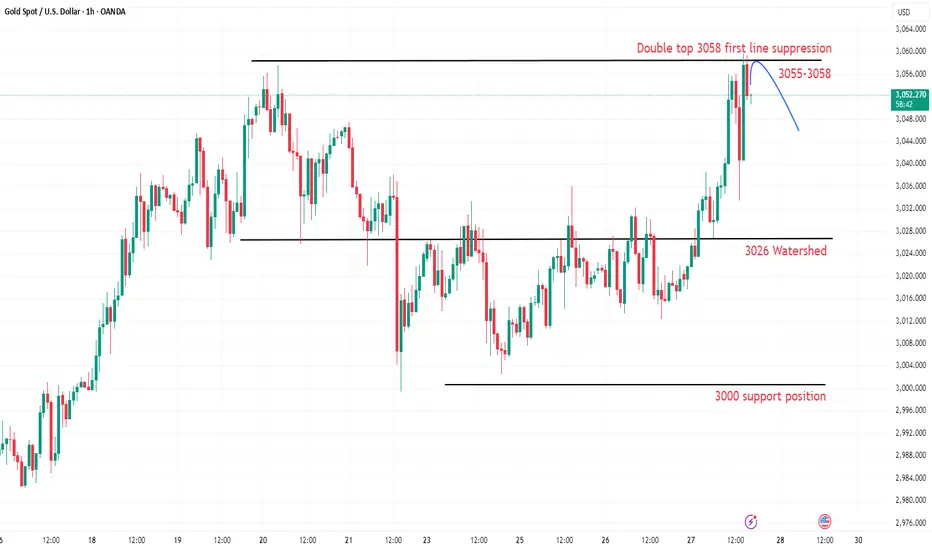
News analysis: Why is 3026 so critical? Looking back at the rebound of gold prices in the past few days, it is not difficult to find that many previous rebounds have retreated near 3026. At the same time, this point is also the first time that gold prices have bottomed out and rebounded from 3056 before this round. After breaking through, it rebounded many times but failed to pass. This is a typical watershed between longs and shorts. In fact, yesterday's gold price had already meant to break upward, but the market tension was limited yesterday. The first wave of impact to 3038 this morning has already sounded the horn of the bulls' charge. Unfortunately, it was not sure whether 3026 could be held at that time. If the high position is near 3030, the defense should be placed below 3020, which is a little big. There is no reverse follow-up to keep up with the rhythm of this wave of rebound.
Technical analysis of gold: The current idea of the end of the trading day is very clear. We chose to take short positions below the previous historical high of 3055-57 for the second time. The short positions of 3050-52 have now retreated to around 3038. Since there has been a high-level decline, it shows that the bulls are not that strong. There has been no breakout in one go. The probability of breaking 3055 tonight is gradually decreasing. The end of the trading day will most likely remain in the 3030-50 range for consolidation, and the focus will be on tonight's closing point. If the high-level close is above 45, the gold price may set a new high tomorrow; if the closing line is below 35, it will maintain a high level of volatility tomorrow, Friday.
Operation strategy: If gold falls back to around 3030-35, you can take long positions. Gold can still be shorted around 3055-58
Trading discipline:
1. Don't blindly follow the trend: Don't be swayed by market sentiment and other people's opinions. Operate according to our operation plan. The information in the market is complicated. Blindly following the trend can easily lead to the dilemma of chasing ups and downs.
2. All short-selling profit-taking areas 3050-3045 are closed.
3. In gold trading, we will continue to pay attention to news and technical changes. Once there is a change, we will inform you in time and strictly implement trading strategies and trading disciplines to move forward steadily in a volatile market and achieve steady appreciation of assets.
Gold shocks converge, trading strategy fully analyzedTechnical analysis of gold: Gold has slightly risen and fallen during the day, and the overall trend remains in a volatile trend. Gold is currently maintaining a narrow range of fluctuations on the daily trend, but the short-term moving average has gradually diverged downward, and there are signs of weakening in the short term on the daily line. The 4-hour level trend is temporarily maintained in a volatile state, and the price is temporarily compressed between 3010-3030. The short-term moving average continues to maintain a state close to adhesion and flattening, tending to maintain a volatile trend in the short term. It is necessary to pay attention to the continued downward trend after a small break in the 4-hour level trend. In the small-level cycle trend, after touching the previous support band, there are signs of stabilization again. Pay attention to the short-term adjustment.
Gold is about to explode in a big market. The obvious box-shaped oscillation triangle is converging, that is, it has become narrower, and the oscillation has lasted too long. If it can break through 3038 with consecutive positive lines, then today will basically continue a wave of pull-ups, so there is a high probability that the 4-hour middle track or the daily 5-day moving average will break. On the contrary, if the psychological barrier of 3000 is lost, the market may fall back to the support zone of 2971-2997 for correction. On the whole, today's short-term operation of gold suggests that callbacks should be the main focus, and rebound shorts should be supplemented. The top short-term focus is on the first-line resistance of 3030-3036, and the bottom short-term focus is on the first-line support of 3010-3012. Friends, you must keep up with the rhythm. Gold operation strategy: short gold rebound near 3028-3035, and go long on the pullback of 3015-3010.

How to break the position of gold as it narrows in shock?Technical analysis of gold: Gold has slightly risen and fallen during the day, and the overall trend remains in a volatile trend. Gold is currently maintaining a narrow range of fluctuations on the daily trend, but the short-term moving average has gradually diverged downward, and there are signs of weakening in the short term on the daily line. The 4-hour level trend is temporarily maintained in a volatile state, and the price is temporarily compressed between 3010-3030. The short-term moving average continues to maintain a state close to adhesion and flattening, tending to maintain a volatile trend in the short term. It is necessary to pay attention to the continued downward trend after a small break in the 4-hour level trend. In the small-level cycle trend, after touching the previous support band, there are signs of stabilization again. Pay attention to the short-term adjustment.
From the overall situation, gold is definitely in the bull market stage. At present, there is strong buying defense at the 3000 mark, and the "W" double bottom Zou shape has appeared below. If it successfully breaks through the 3035 watershed, it is expected to test the pressure near 3045 and the historical high of 3057. Now the low point of the callback begins to move up slowly, showing a small upward trend. First, we will overestimate and undervalue in the 3030-3010 range. We can see that the current gold trend is also narrowing. There is no problem with short-term shock operations, but pay attention to the breakout after continuous shocks. The daily cycle hovers around the angle of the short-term moving average. There is a choice of direction at any time. Follow the breakout. Overall, today's short-term operation strategy for gold is mainly long on callbacks, and short on rebounds. The short-term focus on the upper resistance of 3030-3036, and the short-term focus on the lower support of 3010-3012. Friends must keep up with the rhythm. Gold operation strategy reference: short gold rebounds near 3030-3034, with a target of 3020-3015, and long gold callbacks near 3010-3014, with a target of 3020-3025.
If your current gold operation is not ideal, I hope to help you avoid detours in your investment. The information I recently shared about the gold market has received a lot of feedback, and everyone said it was very helpful! If you don’t know when to enter the market, you can follow me 🌐, I will release specific signals in real time, remember to pay attention to the bottom 🌐 signal in time.

Gold has been in a good range recently, which is perfect!Congratulations to everyone for realizing the range idea again。It should be noted here that since the bulls rose strongly in the early stage, the market turned to bearish, or the rhythm of bullish adjustment will not be so fast. Therefore, yesterday's daily line turned positive, not the return of bulls, but a correction in the process of decline. On the one hand, the adjustment of bulls is not enough, and the indicators show that there is still further exploration. On the other hand, although the current shock has rebounded, the strength is not strong and the continuity is poor. It is a shock upward trend and may fall at any time. Be cautious when looking at bullish. Only by matching the market and the time point can you get the correct direction. Trading focuses on ideas and planning, and doing yourself well is more important than anything else.If your current gold operation is not ideal, I hope to help you avoid detours in your investment. The information I recently shared about the gold market has received a lot of feedback, and everyone said it was very helpful! If you don’t know when to enter the market, you can follow me 🌐, I will release specific signals in real time, remember to pay attention to the bottom 🌐 signal in time.
Gold hourly line pattern chart;
Gold once touched the 3002 line to stabilize, and the daily line level fell back three times in a row. There is still room for decline in the short term. Pay attention to the obvious support of the 3000 mark below. If it does not break, it will still be a repeated trend. On the contrary, there will be a continuous decline. In terms of operation, continue to go short on the rebound! Operation suggestion: short at 3025-3030. The target is 3016-3010. On the contrary, if it falls back to 3010-3005, go long and the target is 3020-3025.

So amazing! Accurate again, follow-up strategyToday, the first wave of gold price retreated from around 3026 to around 3013 in the Asian session. The lower support is obviously moving up gradually. Yesterday's white session also started to rise from above 2310. The two retracements before the US session only reached 3014 before rebounding quickly. At present, the focus on the upper side is the suppression of 3030-35. The hourly line of gold is now oscillating in the range box. Only after gold breaks through the box, will the gold market appear. Gold hit the 3035 line on Tuesday, but gold quickly fell back after hitting the high. We actually shorted at the 3032 line. The perfect harvest was harvested after stepping back. Gold did not break through the 3030-35 line suppression we mentioned above. If it breaks through the 3035 line and stands firm, then the bulls will rise and hit a new high. Our operation of stepping back to do more ideas remains unchanged, but we should not chase more directly, otherwise the adjustment of stepping back will be more uncomfortable. Be a steady hunter and wait quietly for the appearance of prey.
From the 4-hour trend, the upper short-term resistance focuses on 3030-35, and the lower support focuses on 3000-3005. Relying on this range, the layout of the long and short oscillation range is maintained. In the middle position, watch more and move less and chase orders cautiously, and wait patiently for key points to enter the market. I will inform you of the specific operation strategy in time. Gold operation strategy: 1. Go long when gold falls back to 3010-3000. If the subsequent market breaks through the 3035-3040 resistance line, we will adjust whether to go short based on the technical and news aspects and notify everyone in time.If your current gold operation is not ideal, I hope to help you avoid detours in your investment. The information I recently shared about the gold market has received a lot of feedback, and everyone said it was very helpful! If you don’t know when to enter the market, you can follow me 🌐, I will release specific signals in real time, remember to pay attention to the bottom 🌐 signal in time.

Interval oscillation, opportunities are within your graspMy dear friends, the gold range idea has been fulfilled again. Do you still remember the batch shorting gold strategy we laid out before? Facts have proved that our vision and judgment are extremely accurate! At present, the gold price has successfully reached the target area. Congratulations to everyone for making a profit again. This wave of operations is simply beautiful. I am honored to be recognized and encouraged by everyone. We set sail on the road of trading. I will bring my trading strategy plan, and you will bring your execution discipline. I believe we will definitely have good results.
But investment is never a one-shot deal. The current profit is only a phased result. The gold market has always been turbulent, and the subsequent trend is full of uncertainty. The operation strategy plan can first refer to the unchanged range thinking method I mentioned earlier, the high-altitude and low-multiple operation strategy, and conduct in-depth technical and news analysis. Gold will temporarily maintain a volatile thinking approach. The large range focuses on 3035-3000, and is in horizontal consolidation. In the 4H cycle, the Bollinger Bands are also in a closed state, and the K-line is interlaced at the middle track. In the short-term sideways consolidation and accumulation stage, the operation relies on 3035 as the critical point of adjustment. Below this position, continue to look at the callback, recover and stabilize, and then adjust the thinking. Pay attention to the support of 3012 and 3000 below. Maintain high-altitude and low-multiple operations as a whole, and follow up after the breakthrough. The specific operation is combined with the short-term pattern. Once there is a new change, I will inform you as soon as possible. Operation suggestion: Gold is short near 3030-35, and the target is 3020 and 3015! It is long near 3010-3000. The target is 3015 and 3026!If your current gold operation is not ideal, I hope to help you avoid detours in your investment. The information I recently shared about the gold market has received a lot of feedback, and everyone said it was very helpful! If you don’t know when to enter the market, you can follow me 🌐, I will release specific signals in real time, remember to pay attention to the bottom 🌐 signal in time.

Go long and win, then go short on the reboundToday, the layout of gold is to go long in batches near 3005-3008, and 3020 is a successful profit. Now the rebound continues to go short.
In terms of the daily line structure, yesterday's rebound of gold first touched the pressure of the 5-day line, and then the market retreated to the vicinity of the 10-day line. The overall trend is in line with expectations, fluctuating within the daily average range, and the rhythm of rising first and then falling also increases the expectation of the continuation of the short-term market adjustment. The pressure of the 10-day line can continue to be paid attention to on the upper side of gold during the day, but the 10-day line has now moved down to the vicinity of 3027, and today's market opened near the 5-day line 3012. Combined with the trend of the hourly chart, gold fell again to the vicinity of 3000 overnight, indicating that the short-term trend still follows the technical trend, but the main sentiment of the market is still controlled by the bulls. If the fundamentals unexpectedly break out with good news, the bulls' sentiment may go crazy at any time. In the day, we can pay attention to the pressure near the short-term trend line 3025 on the upper side of gold, and continue to pay attention to the competition around 3005-00 on the lower side. If 3000 is lost, we will look for a larger space to retrace. If the market has been fluctuating above 3000 today, the risk of short-term market variables will increase.
For specific operations, it is recommended to be short at 3020-3025, and look at 3015-3005.
If your current gold operation is not ideal, I hope to help you avoid detours in your investment. The information I recently shared about the gold market has received a lot of feedback, and everyone said it was very helpful! If you don’t know when to enter the market, you can follow me 🌐, I will release specific signals in real time, remember to pay attention to the bottom 🌐 signal in time.
