Gold----Buy near 3374, target 3399-3420Gold market analysis:
Yesterday, Monday, gold rose strongly, reaching a high of around 3402. This range is still relatively rare at the beginning of the week. Let's not worry about whether it is caused by fundamentals. Judging from the market's morphological indicators, we can be very sure that it is a buying trend. Yesterday's buying has broken the 3377 position. The breaking position of this position has determined the new buying position. In addition, the daily moving average has also begun to diverge. The morphological support is around 3370 and 3374. Today, relying on this position, the moving average is bullish. Yesterday, it rose too much. I estimate that there will be a need for repair today. The retracement during the repair is our opportunity to get on the train again. On the weekly line, 3400 is a hurdle. The previous multiple stops were only short-lived, so we need to be cautious when buying above 3400.
There is a signal of closing negative in 4H. The Asian session needs to be adjusted and repaired. It is better to buy at a low price. 3402 is a small pressure. We cannot estimate where it will be repaired. We can determine the support below and buy near the support. There can also be short-term selling opportunities above 3400 in the Asian session. It is only in the Asian session, and the buy order is the main target.
Fundamental analysis:
There is no major news in the recent fundamentals. The situation in the Middle East is still relatively stable. There is no new rest in tariffs, and the impact on the market is limited.
Operation suggestion:
Gold----Buy near 3374, target 3399-3420
Goldpreis

Can gold continue to fall slowly sideways? Focus on the 3375 wat
On Tuesday, spot gold fell back mildly after yesterday's surge. The current gold price is around $3,384/ounce. Spot gold prices surged more than 1% on Monday and hit a five-week high. The main reason was that the US dollar and US bond yields plummeted, and investors were uneasy about the approaching deadline for tariff negotiations on August 1. The market is facing various uncertainties, which does provide support for gold.
Views on today's gold trend!
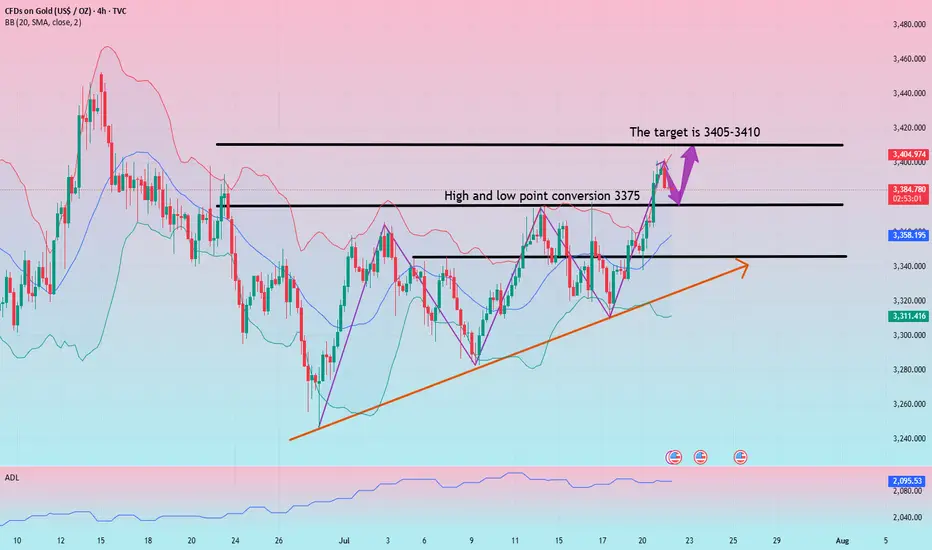
After more than a month of volatile trends, gold once again broke through the integer mark of 3,400 on the first trading day of this week. Under the current bullish sentiment of creating a new high, the previous short-term downward trend ended. From the daily chart, gold is still in an upward trend in the long term. The previous market rebounded effectively after touching the downward trend line, and the rebound force was considerable. With the restart of the bullish force, the main idea can carry the trend and buy on dips.
From the 4-hour chart, the continuous rise of gold and the turning of the moving average have made the market bulls more aggressive, which means that the previous short-term downward trend has ended. At present, a new trend is opening up in the 4-hour chart. The rise of gold has also established an upward trend line. You can consider buying on dips against the 3375 watershed.
Gold: Buy near 3375, defend 65, and target 3405-3410!
XAU/USD) Bullish trend analysis Read The captionSMC Trading point update
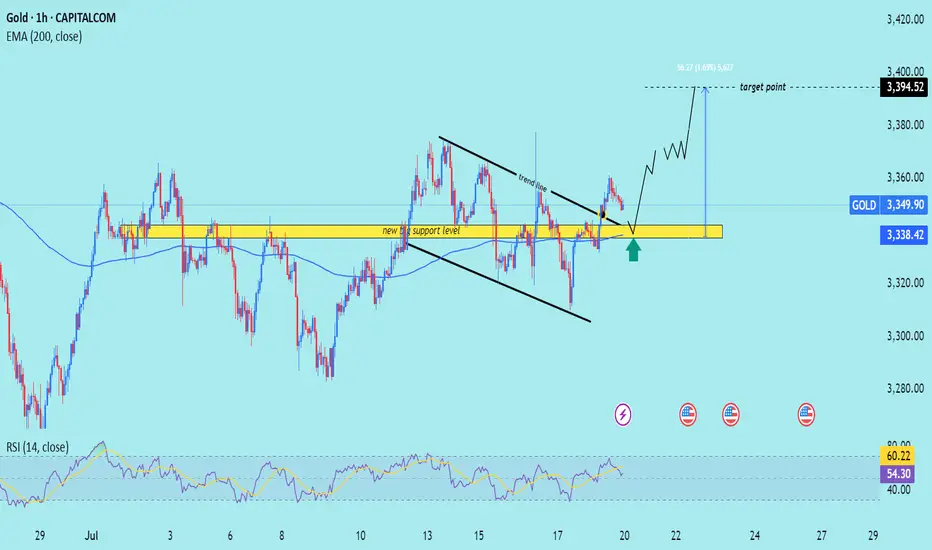
Technical analysis of XAU/USD (Gold) on the 1-hour timeframe. Here’s a breakdown
---
Technical Analysis Summary
Descending Channel Breakout
Price action previously formed a descending wedge/channel, shown by the two black trendlines.
A bullish breakout occurred above the trendline, signaling a shift in momentum from bearish to bullish.
Key Support Zone
The yellow highlighted zone (around $3,338–$3,340) is marked as the “new key support level”.
Price is expected to retest this area (confluence with 200 EMA), which aligns with standard bullish breakout behavior.
The green arrow indicates potential bounce confirmation.
Bullish Projection
After the retest, price is projected to climb steadily toward the target point at $3,394.52.
The setup anticipates around 56.27 points upside, or roughly +1.69% gain from the support zone.
---
Target
$3,394.52 – defined using the previous range breakout height and horizontal resistance.
---
Trade Idea
Entry: On bullish confirmation near $3,338 support zone.
Stop Loss: Just below the yellow zone (e.g., under $3,330).
Take Profit: Near $3,394.
Mr SMC Trading point
---
Conclusion
This is a classic breakout-retest-play, supported by trendline structure, a key horizontal support zone, and RSI strength. As long as price respects the highlighted support, the bullish outlook remains valid.
Please support boost 🚀 this analysis)
Gold rises continuously and then moves unilaterally? 3375 is the
At the beginning of this week, international gold prices rose, benefiting from the weaker dollar, while investors paid attention to news on trade progress before the US tariff deadline on August 1. As US inflation data was lower than expected and the market may have some defensive bets against tariffs, gold finally rebounded from the main upward trend line again. The lower-than-expected US inflation data did not trigger the market to re-price more hawkish rate hike expectations.
From a larger perspective, as the Fed's easing policy progresses, real yields may continue to fall, and gold should maintain an upward trend.
Views on today's trend!
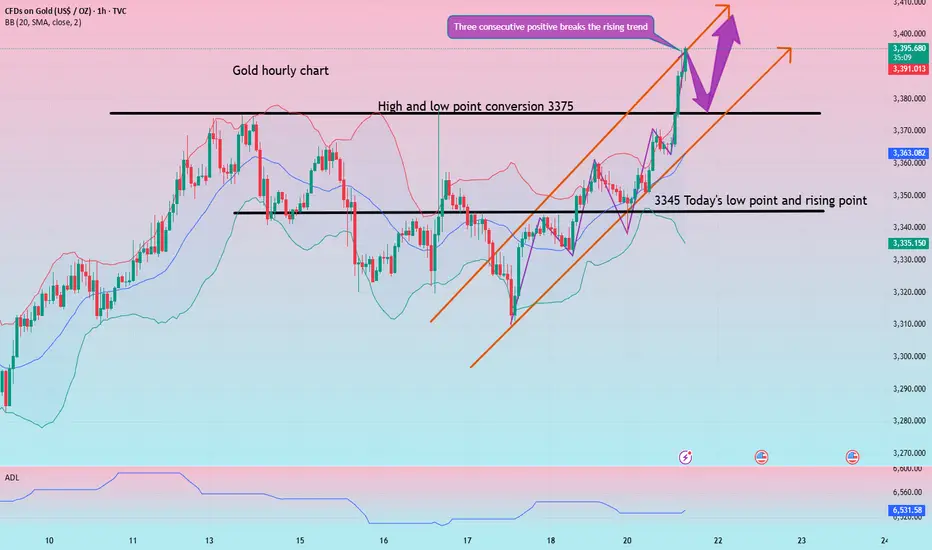
Today, gold is rising slowly, and basically there is no chance of a correction, so it also led to our opening directly chasing a wave of gains, and the market has actually had some risks after the rebound to above 3370. After all, the 3373-75 line was a dense pressure area before.
From the current hourly chart, gold has been moving along the upper track of the moving average and has accelerated since breaking through the 3375 line. It is possible that it will test the 3410 line today. After all, it is already at the 3395 line, and today's strength and weakness watershed has actually shifted from 3340 to 3375. After all, the top and bottom conversions are raised synchronously!
Gold: Long around 3375, defend 3365, and target 3395-3405!
Gold----Buy near 3344, target 3360-3377Gold market analysis:
Recently, the daily gold line has been switching back and forth. If you look at the daily line from around June 25 to around July 21, it is a large range of fluctuations, and there is no big change in structure. The weekly line has not run too far in the past three weeks, and it is also a small range of fluctuations. We need to adjust our thinking in time in operation. For example, the market from Thursday to Friday last week was a market with rapid conversion of buying and selling. We adjusted our thinking in time on Friday to make a profit from the bullish 3337 layout. Moreover, our analysis chart also clearly shows that gold has fallen back at 3357, and gold began to fall back at 3361. Today, we must buy at a low price to be bullish. 3377 is a hurdle on the daily line, and it is also a barrier that is difficult to cross for buying. If the highest position can be reached this week, it can be confirmed that it is a real buy. Otherwise, it is a daily line structure of fluctuations. The support of the weekly line this week is around 3308 and 3000. Only when this position is broken on the weekly line can the weekly selling position be confirmed. Otherwise, it depends on the daily line structural fluctuations of 3300-3377.
In the Asian session, we will first arrange long orders at the small support of 3344. The larger support is the 1-hour pattern support near 3331. In the Asian session, we must first look for opportunities to buy at low prices. If 3331 is broken directly, we have to think whether it is a volatile market again. The volatile market is repeated. Don't get on the bus in the middle position. We should grasp the rhythm more, so that we can get both buying and selling profits.
Support 3344 and 3331, pressure 3361 and 3377, the watershed of strength and weakness in the market is 3344.
Fundamental analysis:
Today is a holiday in Tokyo, Japan. In addition, there is no major data this week. We focus on the fundamentals. Trump's tariffs are still a focus.
Operation suggestions:
Gold----Buy near 3344, target 3360-3377

In-depth analysis of gold price trends this week!Market news:
During the Asian morning session on Monday (July 21), the London gold price rose slightly to above $3,350 and is currently trading around $3,356/ounce. The weakening dollar and continued geopolitical and economic uncertainties have boosted demand for safe-haven spot gold, supporting international gold prices, but the rebound in the University of Michigan survey index may limit gold's gains.Although gold prices may face correction pressure in the short term, international gold has limited room to fall. Factors such as economic slowdown, lower interest rates and rising inflation will attract more buyers to enter the market. The continued purchases by central banks over the past two and a half years have also provided solid support for gold prices. The tension between Trump and Powell is the main reason why gold prices remain high.Looking ahead, the market focus will shift to this week's ECB monetary policy meeting. Economists generally expect the ECB to keep interest rates unchanged, and preliminary manufacturing data released this week may also trigger some market fluctuations. This week's economic data and Fed dynamics will be key variables in the trend of gold prices. No matter how the market fluctuates, the long-term value of gold cannot be ignored, and investors need to pay close attention to macroeconomic changes and political events.
Technical Review:
Technically, the daily chart of gold still maintains the adjustment of the middle track of the Bollinger Band, forming a yin-yang alternating shock consolidation. However, on Friday, the gold price closed with a small positive K, and the price MA10/7-day moving average closed above 33/42. From the indicator point of view, the MACD indicator momentum column shortened, and the RSI indicator ran around 50, indicating that the market buying and selling forces were balanced.The 4-hour chart shows that the gold price fluctuated and tended to buy and consolidate at 3330-3360. At present, the moving average system opened upward. As long as gold does not lose 3320, it is expected to continue to sprint upward to 3375/3400. On the contrary, if it loses the support of 3320/10 again, it is regarded as a short-term weak shock downward. On the whole, the current trend of gold is oscillating and tending to buy and consolidate. Today's trading idea is mainly to buy at a low price and sell at a high price.
Today's analysis:
Since there is no major economic data this week, in the absence of geopolitical risks and emergencies, it is expected that gold will still see a small range of shocks and consolidation this week, and the range can be focused on 3400-3300. The daily Bollinger Bands continue to close, with the upper track at 3375 and the lower track at 3288. The short-term moving averages are intertwined near the middle track, suggesting that gold will still be dominated by fluctuations in the short term. In terms of operation, keep the idea of selling at high prices and buying at low prices. Do not chase the rise and sell at the fall. Wait for the breakthrough signal to be confirmed before following the trend. Today’s support is at 3340. You can use this as a key point to arrange buy orders during the day. The key point above is 3361, which is the high point of last Friday. 3361 is a short-term pressure point. If there is no correction today and it directly breaks 3361, we can follow the trend directly. If there is a correction, pay attention to the bottom structure above 3340 and buy at the bottom!
Operation ideas:
Buy short-term gold at 3340-3343, stop loss at 3332, target at 3370-3390;
Sell short-term gold at 3377-3380, stop loss at 3388, target at 3340-3320;
Key points:
First support level: 3340, second support level: 3332, third support level: 3320
First resistance level: 3375, second resistance level: 3388, third resistance level: 3410

Ultra-short-term trading. Profit of $10/ounceThe order to buy XAUUSD successfully made a profit. The current gold price is 3367. Stimulated by the weekend news, the expected trend was achieved smoothly, and the short-term bulls were strong. Buying can continue to be the main focus. Relying on the half-hour and one-hour trends, trading can be carried out in the London market for the purpose of buying and profit. The increase is about $10/ounce.
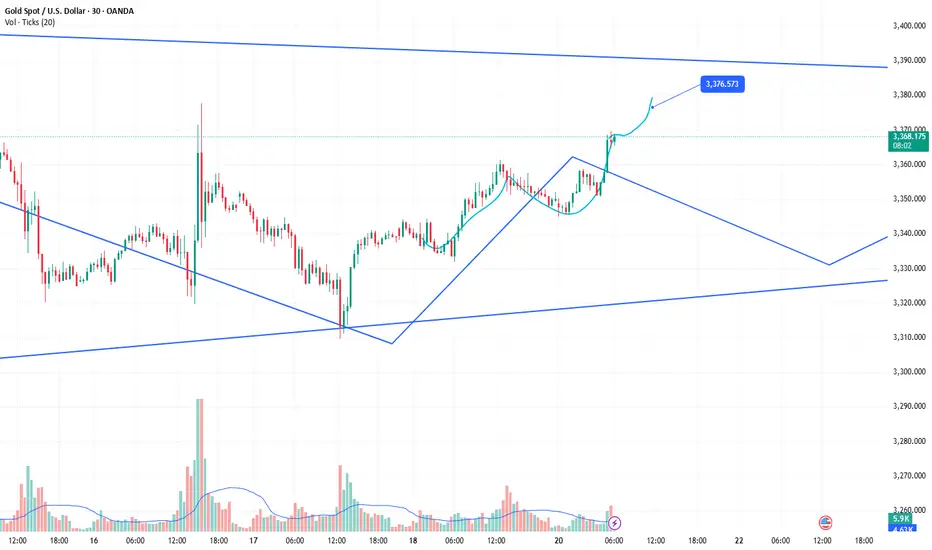
Gold is waiting for a pullback to break through 3400In the short term, gold is stuck in a sideways trend near 3365. It is not recommended to enter this point regardless of long or short positions. It is expected that there will be certain variables in the NY period. If gold retreats and falls in the short term as we expect, it may first touch around 3361. If it falls below 3361, it is expected to touch around 3353, which is also the point I gave this morning to see support.
Judging from the market, our focus on the upper side is still the 3375-3385 resistance area. If it can be effectively broken through, it is expected to hit the 3400-3420 mark. Although the daily MACD is oscillating near the zero axis, the 4H market shows that the oscillation is strong. Our trading strategy remains unchanged in the short term. The pullback in the NY period provides an opportunity, and we can consider going long. If there is new news during the day that requires adjustment, I will notify you immediately. Bros, please be patient and wait for trading opportunities.
OANDA:XAUUSD

XAUUSD 21/07 - Will the Bullish Momentum Continue?In today’s session (July 21), the 1H chart of XAUUSD shows a confirmed breakout above the medium-term descending trendline. The bullish momentum originated from a strong rebound at the confluence zone of support, EMA, and ascending trendline — suggesting a high-probability continuation setup for the short term.
Technical Analysis Overview:
🔹 Price Action Structure:
Price broke out of a falling wedge / descending triangle with a strong bullish Marubozu candle, confirming the breakout move.
Breakout was supported by increased volume, indicating strong institutional buying near 3,346–3,350.
🔹 Trendlines and EMA Outlook:
Price is currently holding above the ascending yellow trendline.
Short-term EMAs (e.g., EMA20/50, not shown) are likely sloping upwards and sitting below price, confirming bullish market structure.
🔹 Key Support and Resistance Levels:
Immediate Resistance: 3,370 USD – recently tested previous swing high.
Major Resistance: 3,378 – 3,385 USD – Fibonacci projection and previous supply zone.
Short-term Support: 3,359 USD – minor pullback zone and EMA alignment.
Major Support: 3,346 USD – the breakout retest zone and price structure support.
Suggested Trading Strategies:
Scenario 1: Buy the Dip
Entry: Near 3,359 – 3,346 USD (on minor retracement)
Stop Loss: Below 3,338 USD (to invalidate the breakout zone)
Target 1: 3,370 USD
Target 2: 3,378 – 3,385 USD
Scenario 2: Breakout Continuation Buy
If price breaks above 3,370 with strong candle + volume:
Entry: Around 3,372 – 3,374 USD
Stop Loss: 3,359 USD
Target: 3,385 – 3,392 USD
Additional Indicators to Watch:
RSI (not shown): If approaching 70+, watch for bearish divergence or exhaustion signals.
Volume: Sustained or increasing volume will confirm strength of the uptrend.
Conclusion:
XAUUSD is showing strong bullish technical signals after breaking the descending trendline and successfully retesting the breakout level. As long as price holds above 3,346 – 3,350, the short-term bullish structure remains intact.
- Follow for more high-quality trading strategies and daily gold analysis. Save this idea if you find it useful for your trading setup!
What’s your view on this analysis? Let’s discuss more in the comments below!

gold buy signal. Don't forget about stop-loss.
Write in the comments all your questions and instruments analysis of which you want to see.
Friends, push the like button, write a comment, and share with your mates - that would be the best THANK YOU.
P.S. I personally will open entry if the price will show it according to my strategy.
Always make your analysis before a trade

Monday market forecast, pay attention to the 3339 retracement📰 News information:
1. The Trump administration puts pressure on the Federal Reserve to cut interest rates
2. The continued impact of tariffs and the responses of various countries
📈 Technical Analysis:
This week's basic judgment and forecast on the gold market trend were consistent, but on Friday, the overall gold fluctuations were not large. The overall trend of the daily line fluctuated around 3345, and the 3345 line also became a short-term long-short watershed. Although prices are likely to rise more easily than fall in the short term, it should be noted that the three-month adjustment cycle is coming to an end while the fundamentals of the bull market have not changed. It is recommended that you focus on preventing risks from short position operations next week. At the same time, the overall strong shock pattern, the anti-pulling momentum has not reached the top suppression position, and the area around 3339 below is the previous intensive trading area, which constitutes a certain support in the short term. If the market fails to effectively break below next week, it will greatly boost the bullish momentum, and it is not ruled out that there will be a possibility of refreshing the high point near 3380 next week.
On the whole, the short-term focus next week is the 3345-3335 area below. If it falls back to this point, you can consider arranging long orders. The short-term target is 3355-3365, and the strong trend is expected to continue to touch 3375-3385.
🎯 Trading Points:
BUY 3345-3335
TP 3355-3365-3375-3385
In addition to investment, life also includes poetry, distant places, and Allen. Facing the market is actually facing yourself, correcting your shortcomings, confronting your mistakes, and strictly disciplining yourself. I hope my analysis can help you🌐.
TVC:GOLD PEPPERSTONE:XAUUSD FOREXCOM:XAUUSD FX:XAUUSD OANDA:XAUUSD FXOPEN:XAUUSD

How to seize deterministic trading opportunities?The rebound momentum of the gold market has been significantly enhanced today. After breaking through the 3345 resistance in the Asian session, it has continued to rise. It has now reached around 3360, and has rebounded by more than US$50 from this week's low of 3310, setting a new rebound high in the past three trading days. After the gold price effectively broke through the key resistance band of 3340–3350, it triggered some short stop loss trading and trend funds to enter the market, driving the price to accelerate the upward trend. Judging from the hourly chart, the trading volume has increased by about 30% compared with the same period yesterday, indicating that the market's recognition of this round of rebound has increased significantly.
A physically full sun candle chart has been closed in the 4-hour cycle, successfully standing on the Bollinger middle track, further confirming the upward structure, the mid-track support area 3340–3345 has become a key position for bulls' defense, and the short-term structure of the market is still relatively strong. Overall, the intraday retracement range of gold is limited, and the probability of continuing to rise is relatively high. In terms of strategy, it is still recommended to go long. In the short term, focus on the 3340–3345 area retracement support, and the stop-profit target is 3365–3370; if the upward breakthrough, pay attention to the suppression performance of the 3370–3375 line, beware of highs and falls, and pay attention to controlling risks.
Gold---sell near 3355, target 3330-3320Gold market analysis:
The gold buying and selling game in the past two days is quite fierce. The daily line is washed back and forth, with a combination of one Yin and one Yang. The upper and lower shadows of the daily line are relatively long. Yesterday, the daily line closed with a standard hammer candle pattern. After breaking the strong support of 3320, the price did not continue to fall, but bottomed out at 3308 and began to rise strongly, which eventually led to the short-term selling dream being shattered again. The daily line and K showed alternating conversions. The short-term trend is vague, but the long-term trend is still buying. This wave of repairs has the participation of fundamentals and the repair of gold itself. In the big cycle, it is difficult to form a daily selling trend without breaking the position of 3281. In addition, the fundamentals all support gold. I think the possibility of a deep fall in gold in the near future is very small. We are just a follower. In the short term, we focus on the intraday trend to operate. Yesterday, the daily line had a tail, and the possibility of continuing to fall today is small. Let's look at the repair rebound in the Asian session first. The first suppression position for buying rebound is around 3357. This position is also a form suppression and an indicator suppression. The other suppressions are around 3366 and 3377. Note that gold is not unilateral. When encountering great pressure, we must also consider selling opportunities. Today, I think it will rebound first and then fall back.
Support 3327 and 3320, strong support 3308, pressure 3344.3357.3366.3377, and the strength and weakness dividing line of the market is 3340.
Fundamental analysis:
There are not many fundamentals this week. The data released yesterday still suppressed gold as a whole, but the gold tail market still bottomed out and rebounded.
Operation suggestions:
Gold---sell near 3355, target 3330-3320

Gold prices are on the rise again!Market news:
In the early Asian session on Friday (July 18), spot gold fluctuated in a narrow range and is currently trading around $3,336 per ounce. London gold prices staged a thrilling "deep V" market yesterday, hitting a daily low of $3,309 during the session and recovering to 3,339 at the end of the session. Strong US retail sales and employment data drove the dollar to rebound and US Treasury yields to rise, putting pressure on interest-free assets such as gold. Despite this, geopolitical tensions and rising tariff risks are still providing bottom support for the gold market. The international gold market is currently in a multi-game of Fed policies, US economic data, US dollar trends and tariff policies. The Fed's position of postponing interest rate cuts, strong retail and employment data, and the rise in the US dollar and US Treasury yields have suppressed gold prices in the short term. This trading day needs to pay attention to the preliminary value of the University of Michigan Consumer Confidence Index in July and US real estate market data, pay attention to the G20 Finance Ministers and Central Bank Governors Meeting hosted by South Africa, and pay attention to news related to the international trade situation.
Technical Review:
Gold closed with a small positive line with a long upper shadow yesterday. Although it ended the continuous negative trend, it still faced sideways resistance below 3374, and the overall market still needs to be treated as a shock consolidation. From a large cycle perspective, gold has entered a convergent triangle consolidation phase of nearly three months. Among them, the lower track support line gradually moved up to above 3310. The support strength of this position continues to increase as the consolidation time lengthens. If the price touches or approaches this point, you can decisively try to buy the bottom layout.For two consecutive trading days, gold has been consolidating in a larger range of 3377/3310, and finally closed at the starting point of the daily Bollinger band middle track at the end of the trading day. Gold returned to the middle axis of the range at 3340. The daily chart Bollinger band middle track, the RSI indicator middle axis flattened, the four-hour chart hourly chart Bollinger band middle track, and the RSI indicator neutral middle axis. On Friday, the layout of the day will still be based on a wide range of fluctuations. Look at the 3320/3360 range first. Alternating buying and selling cycles, large range of wide fluctuations!
Today's analysis:
In the past two days, gold has always risen in the US market due to news. Last night, Trump called on the Federal Reserve to cut interest rates, and gold rose again. However, judging from the recent market, the market stimulated by the news is still unsustainable. Since gold has rebounded now, gold will continue to sell at a high level in the early trading.
Excluding yesterday's market affected by Trump, the gold price operation pattern this week is close to perfect, and it has been steadily operating under the suppression of the downward trend line. Therefore, the market has given a clear direction. It is OK to sell when the Asian market rebounds to the pressure level. Gold is still in a fluctuating downward trend in 1 hour!
The downward trend resistance of gold has moved down to around 3350. Before gold effectively breaks through 3350, gold is under pressure at 3350 and continues to sell at high prices. Today, Friday, the probability of gold having a big market is relatively high, and if there is a big market on Friday, it is basically weak throughout the day. If it is strong, it is strong throughout the day. As long as gold continues to be weak in the European market, it is likely that gold will continue to fall today.
Operation ideas:
Buy short-term gold at 3317-3320, stop loss at 3308, target at 3340-3360;
Sell short-term gold at 3352-3355, stop loss at 3364, target at 3330-3310;
Key points:
First support level: 3323, second support level: 3310, third support level: 3290
First resistance level: 3348, second resistance level: 3360, third resistance level: 3377

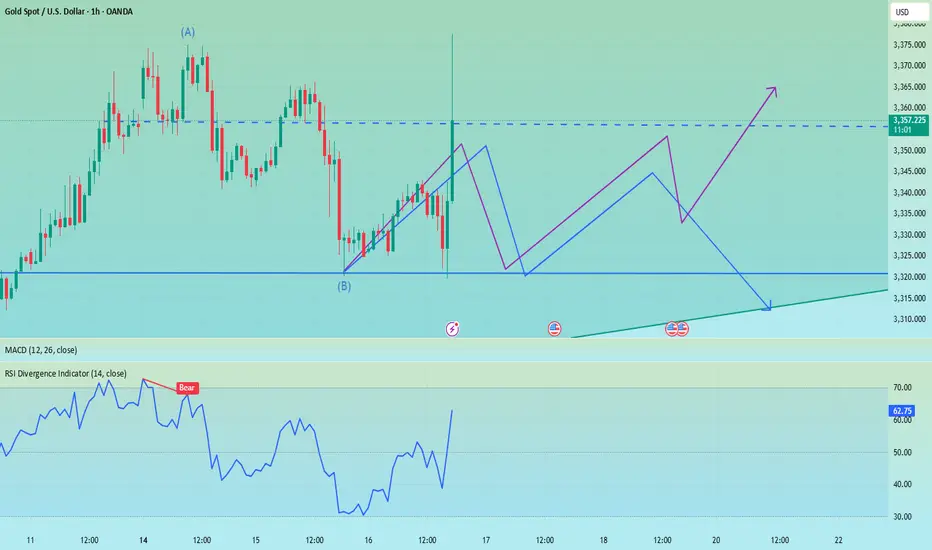
XAU/USD) bearish Trend Read The captionSMC trading point update
Technical analysis of XAU/USD (Gold Spot vs US Dollar) on the 1-hour timeframe. Here's a breakdown
---
Technical Breakdown:
1. Descending Channel:
Price is trading within a clearly defined downward-sloping channel (black trendlines).
This suggests a short-term bearish trend.
2. Resistance Zone (Yellow Box at 3,335–3,340):
Price recently rejected from this resistance area.
This zone aligns with both the 200 EMA and previous structure, strengthening its validity.
3. EMA Confluence:
The 200 EMA (3,336.798) is acting as dynamic resistance.
Price is currently below the EMA, confirming the bearish bias.
4. Support/Target Zone:
The projected target zone is around 3,313.266, labeled as a support level.
This level has acted as previous structure support, increasing its significance.
5. RSI Analysis:
RSI is at 37.18, close to the oversold region, but not yet fully exhausted.
Suggests there’s still room for a downside move before any potential bounce.
Mr SMC Trading point
---
Trade Idea Summary:
Bias: Bearish
Entry: Below the resistance zone (~3,335–3,340)
Target: 3,313 (support zone)
Invalidation: Break and hold above 3,340–3,345
Risk Note: Watch for potential consolidation or fakeouts before continuation.
Please support boost 🚀 this analysis)

Gold fluctuated downward. Stuck in a stalemate.Information summary:
Global investors have experienced the longest night this year. There are reports that Trump has drafted a letter to fire Federal Reserve Chairman Powell. The incident triggered a strong reaction in the financial market. An hour later, Trump came out to clarify that "there is no plan to take any action" and denied drafting a letter to fire Powell.
Due to the impact of the incident, gold experienced a roller coaster market, soaring more than $50 at one time, hitting a three-week high of $3,377.17, and then narrowed its gains to 0.68%, and finally closed at $3,347.38. In today's Asian market, gold fell slightly and is currently hovering around $3,325.
Market analysis:
The current volatility pattern has not changed. In the short term, the market shows signs of weakness, which is also affected by CPI data, and expectations for interest rate cuts have weakened. In the current state where there is no break in the pattern, waiting and watching is still the best strategy.
The first support level is around 3,310, which is the starting point of last week's high. The second is around 3280, which is the historical low since July and also the starting point of the rise in the first week of July.
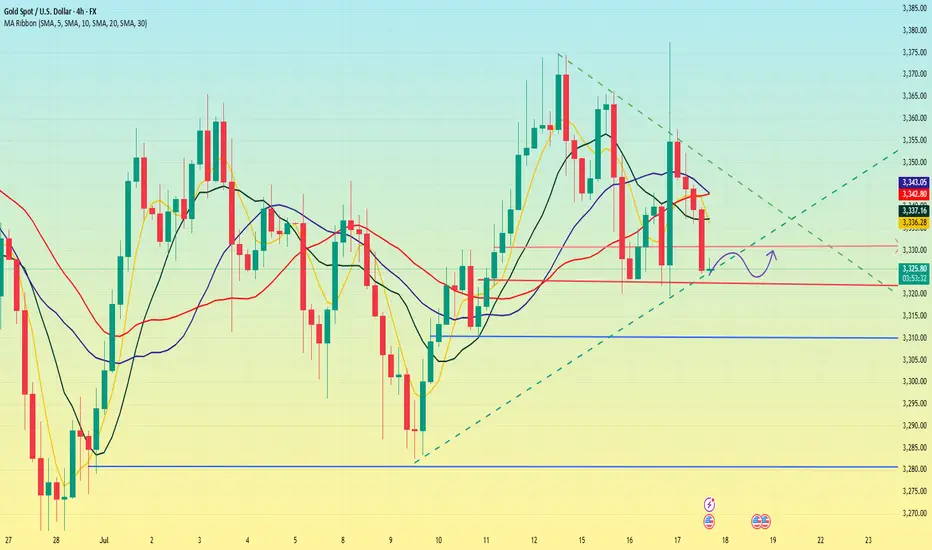
XUA/USD) Bearish Analysis Read The captionSMC trading point update
Technical analysis of XAU/USD (Gold vs USD) on the 1-hour timeframe. Here's a breakdown
Technical Analysis Summary
1. Descending Channel:
The price is moving within a clear descending channel, indicating a bearish market structure.
Recent price action rejected the upper boundary of the channel, strengthening the downtrend bias.
2. Resistance Rejection:
A key resistance level around 3,340–3,345 was retested (marked with a red arrow) and rejected.
Price has already shown early bearish candles post-rejection, suggesting weakness at that level.
3. 200 EMA (Exponential Moving Average):
Price is currently hovering around the 200 EMA, and a clean break below it could accelerate the bearish move.
4. RSI Indicator:
RSI is around 46, below neutral 50, showing bearish momentum is building but not yet oversold.
No divergence is present, supporting the idea of continuation.
---
Bearish Playbook
Entry Idea: After the rejection at the resistance zone and confirmation of lower highs.
Target: 3,313 – 3,310 zone (marked as the “key support level” and “target point”).
Risk Management: A stop loss above 3,345 (above the resistance zone) would be a prudent protection level.
---
Confluences Supporting the Short Setup:
Rejection at horizontal resistance.
Alignment with the descending trendline/channel.
Price trading near or below the 200 EMA.
RSI slightly bearish.
Caution:
Watch out for any macroeconomic news or high-impact events (highlighted with the economic event icons) that could inject volatility.
A strong break back above the resistance could invalidate this bearish setup.
Mr SMC Trading point
Conclusion:
This setup anticipates a bearish continuation targeting the 3,310 support zone. Ideal for short-term traders looking for downside opportunities, provided price respects the trend and fails to reclaim the resistance.
Please support boost 🚀 this analysis)

The firing of Powell set off the market, don't chase the longsTrump showed a draft of the letter to fire Powell, but whether Powell will be fired in the end remains to be seen, but the impact on the gold market is undoubtedly huge. The wolves have now smelled a very dangerous scent. Don’t chase high prices. Don’t chase high prices! ! ! After all, the impact of the news comes and goes quickly, and there is a high possibility of a reversal later in the evening. The final suppression position of the current gold daily line is 3340. If the closing line today can maintain above 3340, then gold will usher in a real bullish trend in the future.
OANDA:XAUUSD
Gold price fluctuates! Gold operation guide!Market news:
In the early Asian session on Thursday (July 17), spot gold fluctuated in a narrow range and is currently trading around $3,341 per ounce. Rumors that Trump plans to fire Federal Reserve Chairman Powell caused violent market fluctuations. The US dollar once plummeted, and then narrowed the decline; while the London gold price gave up most of its gains after soaring. If Powell is fired in advance, it may be unfavorable to the US dollar, because it will shake the outside world's confidence in the US financial system and the safe-haven status of the US dollar.
Trump's repeated statements have caused the international gold price to experience violent fluctuations in a short period of time. The market's concerns about the independence of the Federal Reserve have become an important driving force for the rise in gold prices. However, geopolitical tensions still support gold prices. Israel launched an airstrike on Damascus, Syria on Wednesday, destroying the Ministry of Defense building, which is very close to the Syrian presidential palace. Trump's trade policy has further injected uncertainty into the gold market.
Technical Review:
The news that Trump's big mouth "considered replacing Federal Reserve Chairman Powell" caused violent fluctuations in the financial market. Although the storm subsided after Trump's denial, Wall Street has sounded the alarm. Rumors that Trump will fire Powell caused market volatility, and the US dollar index plunged and closed down 0.36% during the session. Spot gold was on a roller coaster ride, rising sharply from 3320 to 3377 in the late trading, then plunged back to 3336 and then rose again to 3357 before closing sideways around the 3350 mark.Technical daily chart structure alternates between positive and negative cycles to maintain the adjustment of the Bollinger band middle track, the indicator is neutral, the Bollinger band closes, and the RSI indicator is flat. The four-hour chart and hourly chart indicators are neutral. Affected by market news, the gold price alternates between long and short cycles and fluctuates widely, the moving average is glued, the RSI indicator middle axis is flat, and the Bollinger band is flat and closed. Gold maintains a wide range of fluctuations, selling at high prices and buying at low prices.
Today's analysis:
The gold market last night was quite exciting. In the middle of the night, Trump claimed that he would fire Powell. After the news came out, gold soared by more than 50 US dollars in a short period of time, but the market was only controlled by emotions in a short period of time. After all, the chairman of the Federal Reserve is independent, and Trump cannot have the right to fire Powell. Once the emotions passed, although gold fell sharply, it also pushed up the trend of gold prices to a certain extent! At present, after the strong rise of gold in 1 hour, it quickly fell back and closed with a long upper shadow line. The change in gold buying did not successfully stabilize. Then this market is actually a kind of catharsis of the news. The confidence of gold buying in directly rising again is not very sufficient. The gold 1-hour moving average is still in the form of dead cross selling. So gold rebounds or continues to sell.The gold 1-hour pattern excludes the influence of the upper shadow line stimulated by yesterday's news. In fact, the whole rhythm is still fluctuating and falling. The upper shadow time is not long, and it is probably just a temptation to buy. After the ups and downs of gold last night, it rebounded again to the 3360 line or continued to fall under pressure. So gold continued to rebound under pressure and continued to sell at high prices below 3360.
Operation ideas:
Buy short-term gold at 3325-3328, stop loss at 3317, target at 3350-3370;
Sell short-term gold at 3357-3360, stop loss at 3368, target at 3340-3320;
Key points:
First support level: 3330, second support level: 3319, third support level: 3303
First resistance level: 3358, second resistance level: 3370, third resistance level: 3386

XAU/USD(20250717) Today's AnalysisMarket news:
The annual rate of PPI in the United States in June was 2.3%, lower than the expected 2.5%, the lowest since September 2024, and the previous value was revised up from 2.6% to 2.7%. Federal Reserve Beige Book: The economic outlook is neutral to slightly pessimistic. Manufacturing activity declined slightly, and corporate recruitment remained cautious.
Technical analysis:
Today's buying and selling boundaries:
3348.05
Support and resistance levels:
3405
3383
3369
3326
3312
3290
Trading strategy:
If the rise breaks through 3348, consider entering the market to buy, the first target price is 3369
If the fall breaks through 3326, consider entering the market to sell, the first target price is 3312

Fake news stirs up the market, market trend analysis📰 News information:
1. Beige Book of Federal Reserve's economic situation
2. European and American tariff trade negotiations
📈 Technical Analysis:
Today, our overall trading can be said to have accurately grasped the trading points, and both long and short positions have earned us good profits.The gold market surged due to Trump's intention to fire Powell. Trump then denied the plan, which dissipated the risk aversion in the gold market and the overall rhythm fell back to a volatile pattern. The current market price of gold closed with a long upper shadow line, indicating that there is a certain need for adjustment in the market. Although the news stimulus has pushed it up to 3377, we need to be vigilant against the risk of a decline after a high rise. Pay attention to today's closing. If it closes below 3345, the bearish trend may continue in the future.
OANDA:XAUUSD PEPPERSTONE:XAUUSD FOREXCOM:XAUUSD FX:XAUUSD OANDA:XAUUSD FXOPEN:XAUUSD

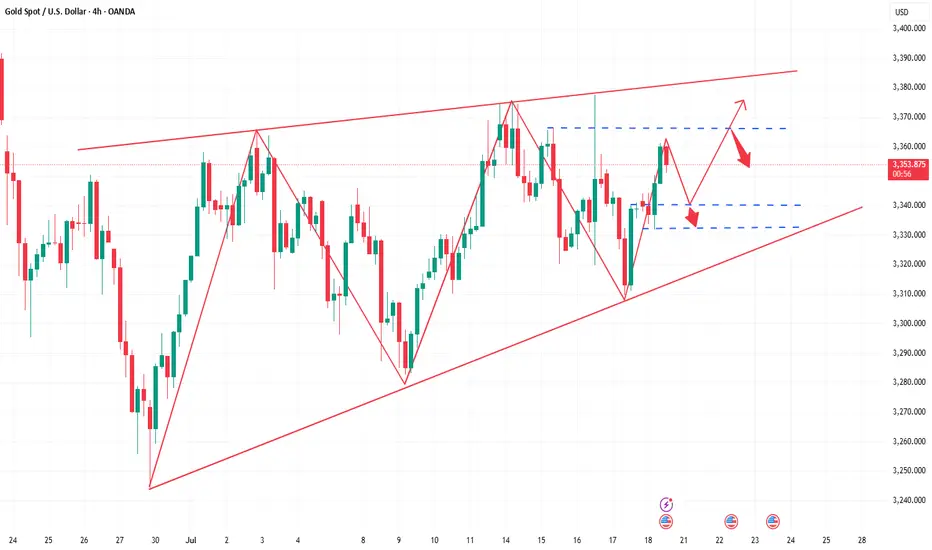
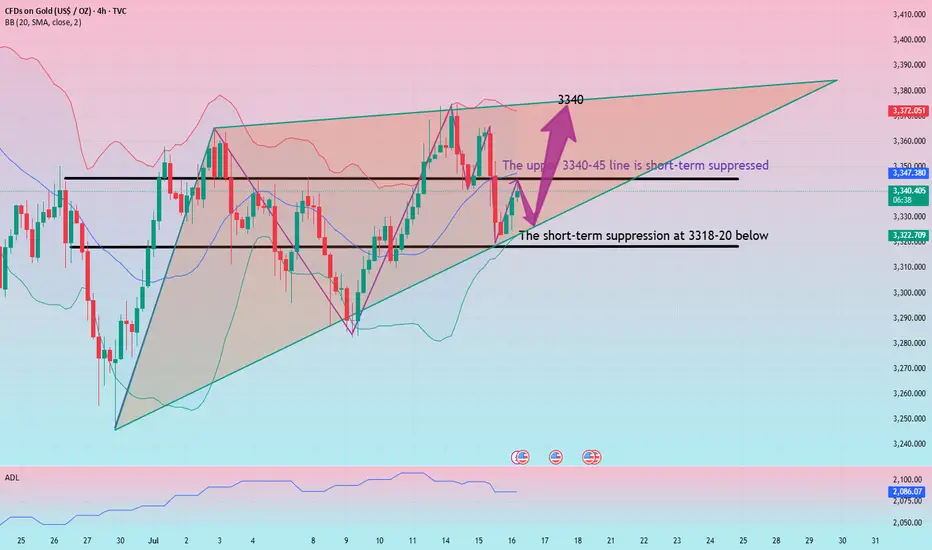
Gold adjustment is complete and continue to be long
Gold rebounded at 3322 today. Technically, it needs to rebound and repair when it falls back to 3318-25, so we can find opportunities to go long below to seize the profit space of the rebound. If your current gold operation is not ideal, I hope I can help you avoid detours in your investment. Welcome to communicate with us!
From the 4-hour analysis, the upper short-term pressure focuses on 3340-45, and the lower short-term support focuses on 3318-20. Relying on this range, the main tone of high-altitude low-multiple cycle participation remains unchanged during the day. In the middle position, watch more and move less, and follow orders cautiously, and wait patiently for key points to enter the market.
Gold operation strategy:
Gold falls back to 3318-25 and goes long, stop loss 3312, target 3340-45, and continue to hold if it breaks;
Public short selling profit, NY short-term multiple layoutInterest rate futures data showed that the results were in line with our previous expectations, with a lower rate cut this month and a higher probability of a 25 basis point cut in September. In the short term, gold may first take profits and then rebound. NY session trading has just begun. Bros can pay attention to the 3335-3330 area below. If it falls back and stabilizes, you can consider participating in long positions, defending 3325 and targeting 3355-3365.
OANDA:XAUUSD
