XAU/USD(20250716) Today's AnalysisMarket news:
Sources said that after Trump's latest trade tax threat, the European Central Bank will discuss a more negative scenario next week than expected in June. The ECB is still expected to keep interest rates unchanged at its meeting on July 24. Discussions on rate cuts are still postponed to September.
Technical analysis:
Today's buying and selling boundaries:
3353.05
Support and resistance levels:
3386.70
3374.12
3365.96
3340.13
3331.97
3319.40
Trading strategy:
If it breaks through 3353.05, consider buying in, the first target price is 3365.96
If it breaks through 3340.13, consider selling in, the first target price is 3331.97
Goldpreis

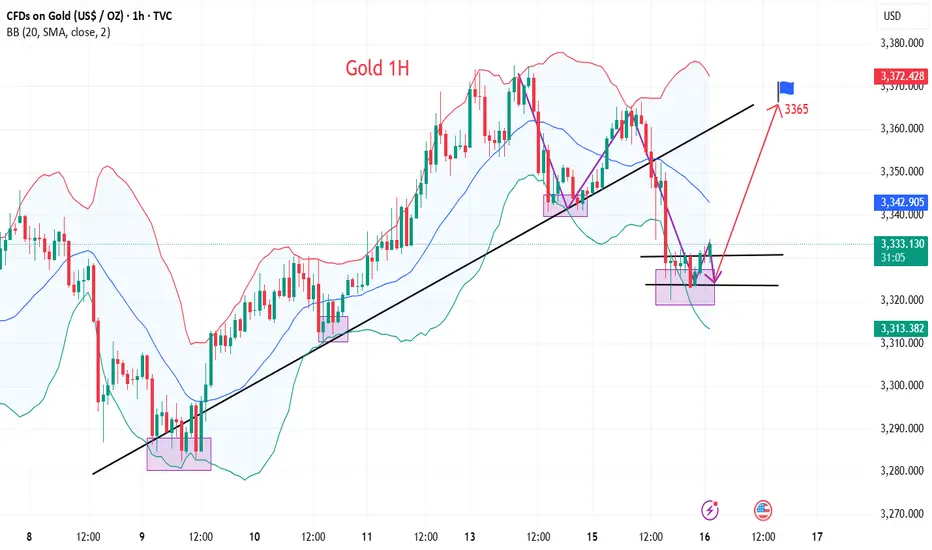
Beware of false decline and real rise of gold
💡Message Strategy
On Tuesday, the dollar index continued to rise, eventually closing at a high of 98.68, after a mild inflation report sparked speculation that the Federal Reserve might keep interest rates unchanged for the time being.
Spot gold gave up its intraday gains after the release of CPI data, once touching the $3,320 mark, falling for the second consecutive trading day.
📊Technical aspects
In the hourly chart, gold has already touched the support trend line overnight.
Therefore, at present, it may be inclined to rebound, and gold still maintains an upward trend as a whole.
However, the upper 3340-45 is a short-term suppression position. If it cannot stand firm and break through 3340-45 today, it is not ruled out that it will continue to maintain 3320-40 for consolidation.
On the contrary, as long as it can stand firm above 3345 today, then gold will really rise in the future.
It is very likely that the high point of 3375 at the beginning of this week may be refreshed.
Therefore, in terms of operation, I suggest paying more attention to 3320-30. After all, 3320 is the overnight low. As long as it is not broken again, the probability of gold rising is very high.
However, if it falls below 3320 again today, it is not ruled out that it will continue to refresh the low.
💰Strategy Package
Long Position:3320-3330,SL:3305,Target: 3365
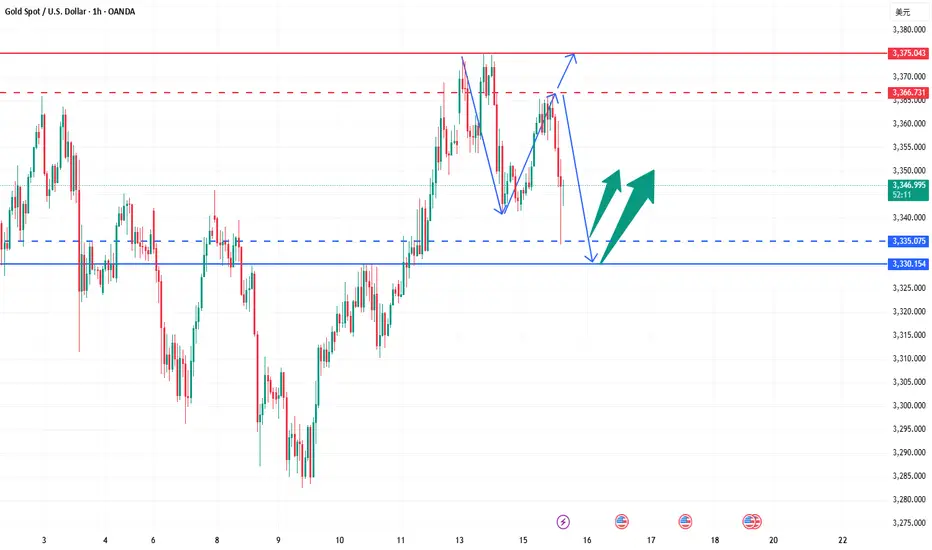
Gold bearishness once again in line with expectationsThe data released so far show that the US inflation data is stable and tends to decline, which increases the possibility of the Fed's monetary policy. The US dollar index fell first and then rose. Gold opened at around 3344 and rebounded all the way. The current highest rebound is around 3366. It fell back to 3352 before the data was released, and then quickly rebounded to 3360. After the data was released, it fell again quickly, and the current lowest touched around 3346. The short orders around 3360-3365 that we shared with brothers before were basically the highest short orders of the day, and we successfully completed our first goal. The brothers who participated in it all made good profits. Judging from the current trend of gold, we continue to participate in short orders during the rebound, and the long position is still around 3335-3330. After the release of the CPI data, it is bearish overall. The core is that it is lower than market expectations but higher than the previous value. Inflation has heated up again, which has once again suppressed the expectation of interest rate cuts. After this data, it also laid a good foundation for the decline in the market. If the price goes up again, it will still rely on the 3365 level to go short again. The data is obviously bearish, and it scared a lot of long positions before it was released.
Gold reference ideas:
Continue to short when it rebounds to around 3358-3365, with a target around 3350-3340;
Go long when it falls back to around 3335-3330, with a target around 3350.
GOLD...Hello friends
Due to the entry of buyers and the strong breakdown of the indicated resistance, the price is expected to move to the indicated targets.
*Trade safely with us*

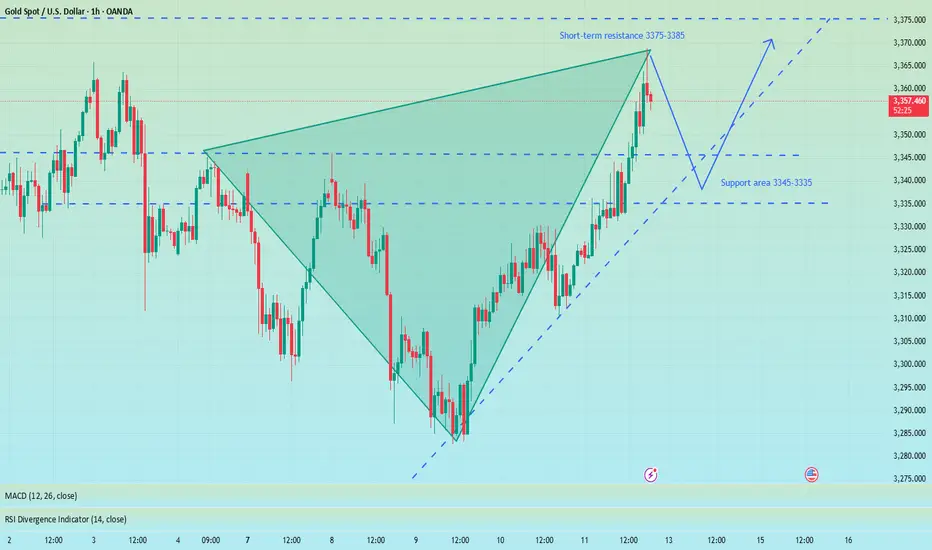
Bullish adjustments are ready to counterattack at any time
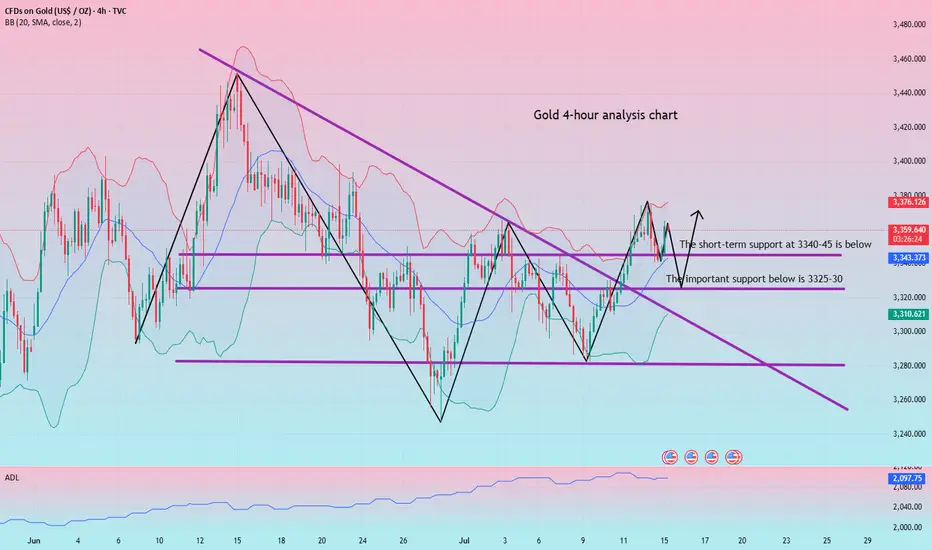
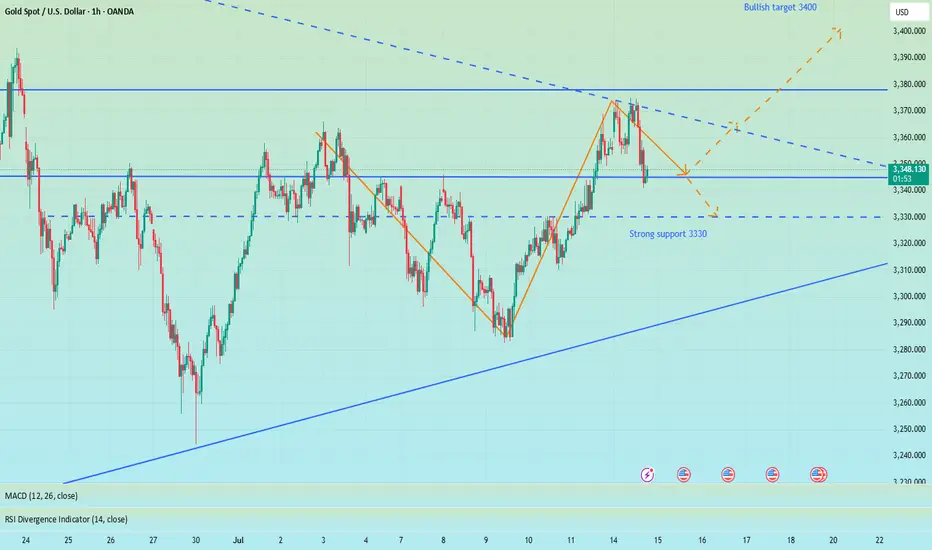
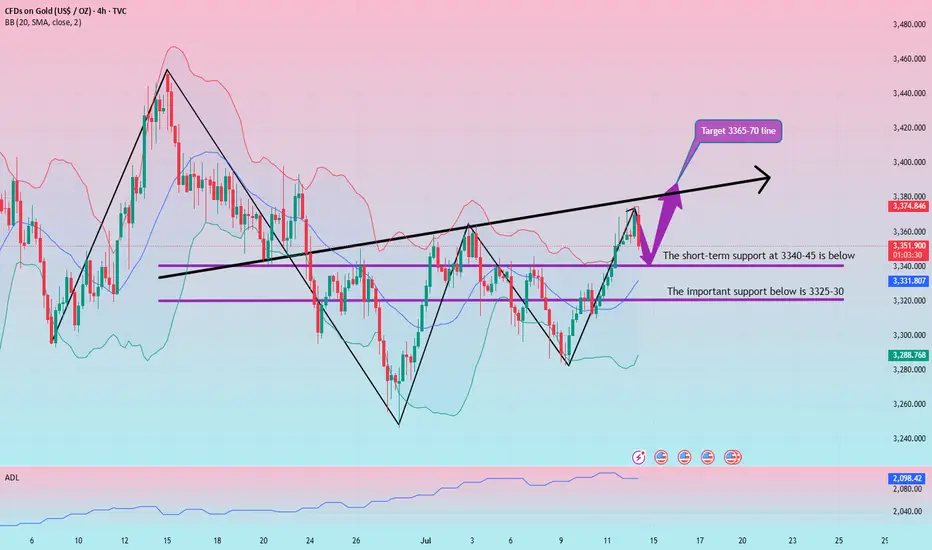
Today, we will first look at the adjustment of gold. The current overall price framework is relatively favorable to bulls. After all, after the continuous breakthrough in the previous period, the current daily line has also stood firmly above the short-term moving average. Whether it will reverse again in the future is also the key trend in the later period. Although the US market was in a retracement yesterday, it did not break the key support of 3325-30 below. This position can also be used as the key support point and watershed position in the later period. Only if this position continues to fall, it may turn from long to short in the later period. Yesterday, we had a long order at 3341 and successfully made a profit at 3348. After three consecutive trading days of rebound, the overall price finally came under pressure at the 3375 mark and ushered in a suppressed decline and shock adjustment. Although there was a shock decline adjustment in the short term, the overall technical pattern is still in the bullish shock upward rhythm. If your current gold operation is not ideal, I hope I can help you avoid detours in your investment. Welcome to communicate!
From the 4-hour analysis, the bullish strong dividing line below is 3325-30. Below, we focus on the short-term support of 3340-45. The daily level stabilizes at this position and continues to maintain the bullish rhythm of falling back and following the trend. The short-term pressure focuses on the vicinity of 3370-75. The overall main tone of high-altitude low-multiple cycle participation remains unchanged based on this range.
Gold operation strategy:
Gold falls back to 3340-45 and goes long. Fall back to 3325-30 and add more positions. Stop loss 3317. Target 3365-70. Continue to hold if it breaks;
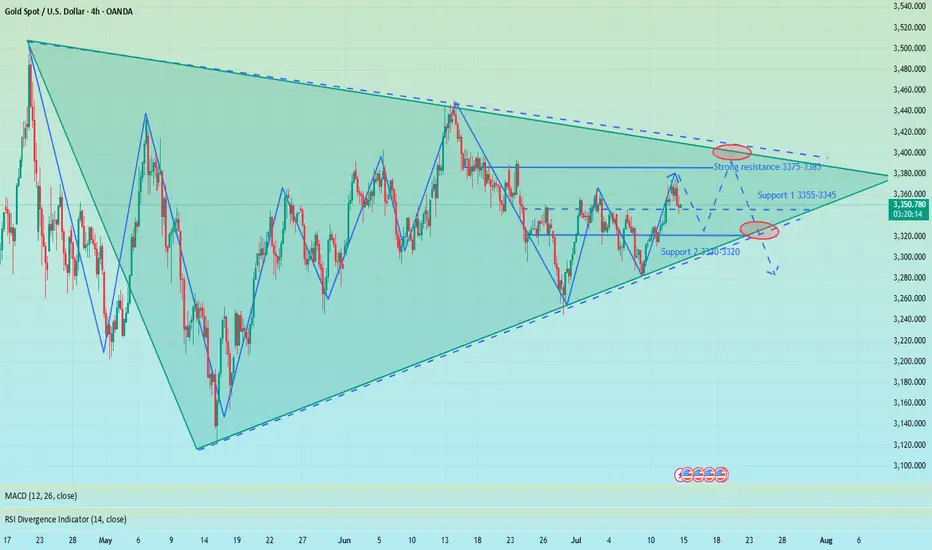
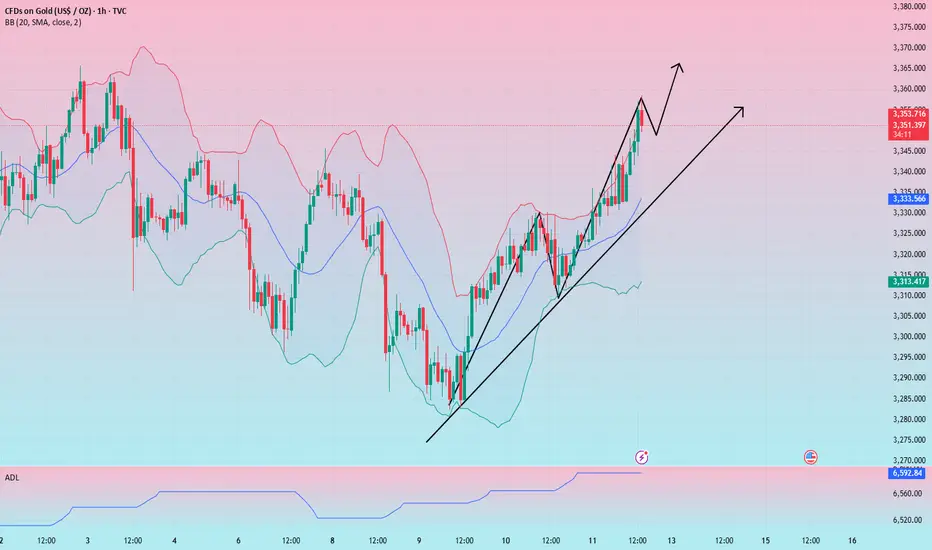
Converging triangle, may rise again in the short termUnder the influence of recent tariffs and the Federal Reserve's interest rate cuts, the main trend of the gold market remains bullish, but from the weekly and monthly level analysis, there is a high probability that it will pull back again after this round of highs and maintain a large range of fluctuations at a high level. Technical analysis shows that gold currently does not have the conditions for a unilateral surge at the daily level. Although the key level of 3345 has been broken, the continuity of the market is extremely poor, and volatility is still the main theme. At present, the trend of gold has formed a converging triangle pattern, and it may rise again in the short term. However, we need to be vigilant that the weekly line may form a high-rise and fall pattern, and the price of gold may fall back to 3300! Therefore, in today's late trading, you can consider retreating to the 3335-3330 area to go long
OANDA:XAUUSD
XAU/USD(20250715) Today's AnalysisMarket news:
Sources said that after Trump's latest trade tax threat, the European Central Bank will discuss a more negative scenario next week than expected in June. The ECB is still expected to keep interest rates unchanged at its meeting on July 24. Discussions on rate cuts are still postponed to September.
Technical analysis:
Today's buying and selling boundaries:
3353.05
Support and resistance levels:
3386.70
3374.12
3365.96
3340.13
3331.97
3319.40
Trading strategy:
If it breaks through 3353.05, consider buying in, the first target price is 3365.96
If it breaks through 3340.13, consider selling in, the first target price is 3331.97

Today's summary and tomorrow's market forecast📰 News information:
1. Focus on tomorrow's CPI data
2. Bowman's speech at the Federal Reserve
3. Tariff information outflows and countries' responses to tariff issues
📈 Technical Analysis:
Bros, I had some things to deal with just now so I went out for a while. Now I come back to share my ideas. When the market is blindly chasing longs, I chose to give a bearish trading opportunity. I know that after I proposed the idea of shorting to test the support level of 3340-3330 below, many people were skeptical and even looked at it with a sarcastic attitude. After all, most people in the market are long. But facts and results have proved that only by following the trend can there be better room for operation. When doing transactions, you must first have a clear goal. Those who follow the crowd will often only blame their mistakes on others or luck.
Regarding the arrangements for future trading, first of all, 3375-3385 above is still an important short-term resistance. If today's closing is above 3360, then 3375 will most likely be tested again during the Asia-Europe trading session. Once it goes up again, it is very likely to break through the resistance area of 3375-3385. Before the US data, the price may stay at 3390 or 3400. On the contrary, if today's closing is below 3360, then the price still has room for adjustment. In this way, 3340 will not be the low point of this week. The bearish volatility in the Asian and European sessions will also test the strong support of 3330-3320.
In addition to investment, life also includes poetry, distant places, and Allen. Facing the market is actually facing yourself, correcting your shortcomings, facing your mistakes, and exercising strict self-discipline. I share free trading strategies and analysis ideas every day for reference by brothers. I hope my analysis can help you.
OANDA:XAUUSD PEPPERSTONE:XAUUSD FOREXCOM:XAUUSD FX:XAUUSD TVC:GOLD FXOPEN:XAUUSD
Gold----Buy near 3348, target 3369-3389Gold market analysis:
Looking back at last week's market, the market performance on Monday and Tuesday last week was quite abnormal, belonging to the rhythm of a big oscillation. The following three trading days were basically relatively normal, and the market rose all the way after the buy-in. The overall market was a bottoming-out and rebounding market. Recently, investors are very confused about whether the general trend is bullish or bearish? First of all, we need to distinguish how long the general trend cycle is? If you look at the weekly line, you can at least see a 2-4 week trend. If you want to see a trend for a month, then you have to look at the weekly K-shaped and monthly trend. I understand that the long-term trend is at least a trend of one month to half a year. With the current instability of the international situation, the trend of Russia and Ukraine, the situation in the Middle East, and Trump's global tariff war, I think the half-year trend is bullish. We are short-term traders, and basically can't see that far. Looking at the trend of one week at most is the limit. Playing with long-term trends requires a 100-point mentality, and playing with short-term trends only requires technology. The first thing every Monday is to figure out the trend of the week. Buy short-term climb at the weekly close. This week's thinking is bullish first. We estimate that there will be a decline in the second half of the week. Today's weekly line is treated as a low-price buy first, and pay attention to the retracement to the support to buy. The low point of Friday's retracement near 3348 is a new support, and it is also the starting point of the pattern support 3344. In addition, the hourly stepping point is near 3342. If it does not break 3342 today, insist on buying. If it breaks, adjust the thinking to be bearish in time. A small step on the Asian session is also an opportunity to get on the train.
Pressure 3397, support 3348, 3345, 3342, the watershed of strength and weakness in the market is 3342.
Fundamental analysis:
Last week, Trump increased tariffs on Canada and will soon increase tariffs on Brazil. There is no signal of stopping the tariff war. It is long-term bullish for gold. The situation in the Middle East has not completely stopped, and it is also a long-term suppression of the US dollar to support gold.
Operation suggestion:
Gold----Buy near 3348, target 3369-3389

Gold fluctuates downward, go long again when it falls back
Gold is currently fluctuating downward. Although the trend is bullish, we must not rush into the market. The technical side needs to step back. We need to be cautious when going long. We need to grasp the entry position and step back to 3340-45 and then more!
From the 4-hour analysis, the short-term support below focuses on the neckline of the hourly line of last Friday, 3340-45, and the focus is on the support of 3325-30. The intraday step back continues to follow the trend and the main bullish trend remains unchanged. The short-term bullish strong dividing line focuses on the 3325 mark. The daily level stabilizes above this position and continues to follow the trend and bullish rhythm. Before falling below this position, continue to follow the trend and follow the trend. The main tone of participation. I will remind you of the specific operation strategy in the VIP group, and pay attention to it in time.
Gold operation strategy:
Gold goes long at the 3340-45 line when it steps back, and covers long positions at the 3325-30 line when it steps back, stop loss 3317, target 3365-70
The market is bullish, but I am bearish. Don't regret it.📰 News information:
1. Focus on tomorrow's CPI data
2. Bowman's speech at the Federal Reserve
3. Tariff information outflows and countries' responses to tariff issues
📈 Technical Analysis:
This week, the US CPI data, consumer index, tariff issues and geopolitical situation are all key points to pay attention to. In the morning, both our long and short positions had good gains, making a good start to the week. The best way is to follow the trend and grab limited profits!
In the 4H cycle, the current trend shows a Zhendan upward pattern, and bulls still occupy the dominant low position in the short term. At the daily level, three consecutive positive days at the end of last week broke through the middle track, and the high point broke through the previous high, indicating that the short-term adjustment is over, and the rise in the market to test 3400 will be a high probability event. At present, the MACD daily line is bullish, the Bollinger Bands are flat, and the gold price is above the middle track. The bulls are strong, but there is still a need for a correction. Intraday trading focuses on the strength of the European session. If the European session is strong, the US session will continue to rise, and if the European session is weak, the US session will bottom out again. In the short term, if it touches 3370-3375 again, you can consider shorting and look towards 3365-3355 SL 3380.
🎯 Trading Points:
sell 3370-3375
tp 3365-3355-3345
In addition to investment, life also includes poetry, distant places, and Allen. Facing the market is actually facing yourself, correcting your shortcomings, facing your mistakes, and exercising strict self-discipline. I share free trading strategies and analysis ideas every day for reference by brothers. I hope my analysis can help you.
FXOPEN:XAUUSD TVC:GOLD FX:XAUUSD FOREXCOM:XAUUSD PEPPERSTONE:XAUUSD OANDA:XAUUSD

XUA/USD) Bullish Analysis Read The captionSMC trading point update
Technical analysis of Gold (XAU/USD) analysis on the 3-hour
---
Gold (XAU/USD) 3H Technical Analysis Summary
Market Structure: Bullish breakout
Price has successfully broken above both the downtrend line and the support zone (highlighted in yellow), signaling a shift in structure from bearish to bullish.
Key Support Zone:
The yellow zone (~3,335–3,355) was previously a resistance area. After the breakout, it is acting as a strong support level and has been retested.
Trendlines:
Downtrend line: Broken and retested.
Uptrend line: Guiding current price action, supporting higher lows and forming an ascending channel.
200 EMA (blue line):
Price is trading above the EMA 200 (~3,331), confirming bullish bias and providing dynamic support.
Momentum (RSI 14):
RSI is around 67.85, showing strong bullish momentum.
Nearing overbought, so a minor pullback or consolidation could occur before continuation.
Volume:
Increase in buying volume near breakout area suggests institutional interest or strong buyer conviction.
Mr SMC trading point
---
Conclusion:
Price has shifted into a bullish continuation pattern.
A successful break and retest of structure and trendlines increases the likelihood of further upside.
As long as price holds above the yellow support zone and the uptrend line, bullish momentum is favored.
Short-term pullbacks may offer new long opportunities.
---
Please support boost 🚀 this analysis)
Gold continues to rise after keeping low and breaking high
Last Thursday and Friday, I repeatedly mentioned the position of 3344 to my members. As a strong resistance position in the early stage, every time the price falls below the low point, the pressure to find the bottom and rebound is this area, and then continue to break the low under pressure. This time, we emphasize that breaking through and standing firmly on 3344 is the key. If it can break through and stand firmly, the next resistance is 3358, followed by 3373.
Now the price has broken upward as expected, completing the qualitative change. The next step is to look at the switching of space. Keep low and break high to see acceleration. After breaking the low point, consider sweeping.
Specific key points are expanded:
1. The daily line pattern is still closing and flat. The lifeline is the space switching point in the past one or two months, which will determine the subsequent market space rhythm. At present, the price has successfully broken through the lifeline and switched upward to enter the lifeline to the upper track. 3339-3396
Then, in the case of subsequent market holding the lifeline, maintain the upper range sweep, yes, it is still the rhythm of sweeping, just change the space
2. The four-hour pattern opens slightly upward, pointing to the upward direction
Starting from the lower track 3283 of the squat probe pattern, it has risen steadily. After repeatedly determining the lifeline position 3310 area, it will start to rise further and the pattern will open upward
The lifeline position coincides with the support 3330-3328 area repeatedly determined last Friday, and together they become the last defensive dividing line for the bulls to rise
3. The double-line interval 3330-3325 of the hourly chart has become a space switching area, which previously suppressed the price from falling further, and now it has turned into support, and will rely on the price to further rise Step up, pay attention to the role of the dividing line
4. Maintain the idea of switching with the same profit space, start from 3283 and calculate 3313, then 3328, then 3343, then 3358, and finally 3373, and then 3388, and 3403 (here needs to be highlighted)
5. As shown in the figure, the purple large channel range is swept, the space range is about 100-150 US dollars, this wave of increase is about 100 US dollars, and there is still room to pay attention to. The upper track of the channel overlaps with the upper track of the daily line pattern in the 3396-3400 area, and the 3403 position mentioned above together become the next space dividing line area
In summary, for the current gold, it is still in the rising stage, and the idea remains low and bullish. Pay attention to the process The intensity and amplitude of the adjustment can be squatted to gain leverage, or sideways for a period of time to gain space. Both are ways of correction. After the correction is completed, continue to be bullish and break through.
Referring to this idea, we gave a long position from 3358-3356 in the afternoon. As expected, it sprinted to 3375 as of press time. Those who keep positions should pay attention to the upward loss point, and then pay attention to further rise.
Of course, today's trend will be more tiring, so there is still an opportunity to step back and buy low. Pay attention to the 3364-3362 position to continue to buy low (aggressive 3366 can start), stop loss 3355, target 3380-3388
Another extreme sweep needs to pay attention to the 3342-3339 and 3330-3328 areas. This needs to be determined according to the situation. Pay attention to 3388 and 3396-3403 when switching upward.

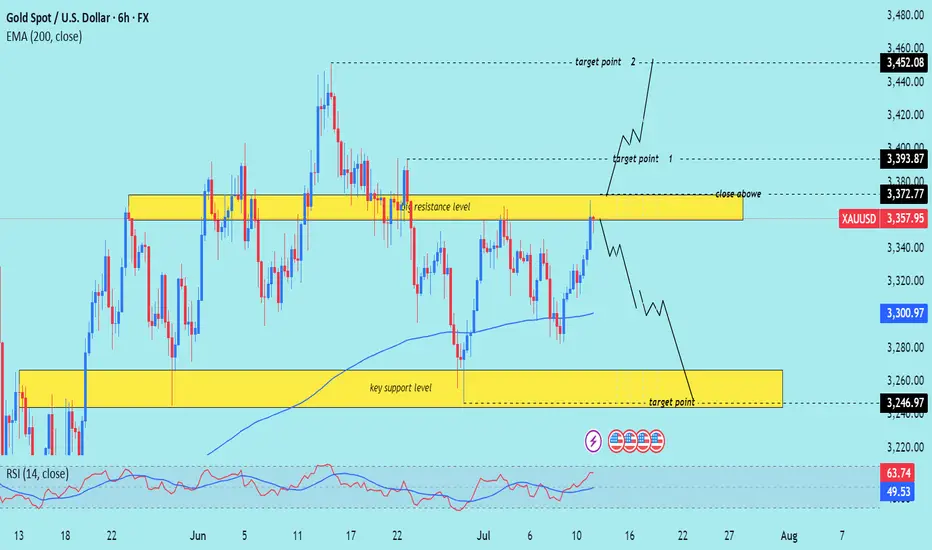
XAU/USD technical analysis setup Read The captionSMC trading point update
Technical analysis of (XAU/USD) on the 6-hour timeframe, focusing on a key resistance zone that could trigger either a bullish breakout or a bearish reversal.
---
Analysis Summary
Current Price: $3,357.95
Trend Context: Price is testing a strong resistance zone with a possible breakout or rejection in play.
---
Scenario 1 – Bullish Breakout
1. Resistance Zone: $3,357–$3,372
Multiple previous rejections.
A confirmed close above $3,372.77 signals bullish strength.
2. Upside Targets:
Target 1: $3,393.87
Target 2: $3,452.08
3. Indicators:
RSI at 63.74, approaching overbought but still with room to rally.
EMA 200 is trending upward, supporting bullish bias.
---
Scenario 2 – Bearish Rejection
1. If price fails to close above $3,372.77, a rejection from resistance is likely.
2. Downside Targets:
Reversal projected toward the key support zone at $3,246.97
EMA 200 at $3,300.97 may provide temporary support before breakdown.
---
Trade Ideas
Direction Entry Level Stop-Loss Target 1 Target 2
Bullish Close above $3,372 Below $3,346 $3,393.87 $3,452.08
Bearish Rejection from $3,357–$3,372 Above $3,380 $3,300 → $3,246.97
Mr SMC Trading point
---
Summary
This is a critical decision point for Gold. A breakout above resistance can propel price to $3,450, while rejection could drive price back to $3,246. The reaction at the current zone will dictate the next major swing.
Please support boost 🚀 this analysis)
It is the right time to go long after the shock and adjustmentGold opened higher at 3364 today, and after a brief surge to 3374, it entered a stage of shock and retracement. Our plan to arrange short orders near 3370 was successfully implemented, and we stopped profits in batches in the 3360-3355 range, making short-term profits. Overall, although it jumped higher due to the stimulus of news such as the increase in tariffs over the weekend, the momentum of the surge is limited, and the technical side still needs to retrace to digest the gains.
At present, the market has returned to the technical rhythm. The key support refers to the breakthrough point of 3340-3345 last Friday. Further exploration will look at the strong support of 3330. The overall rhythm is still mainly to arrange long orders near the low support, and going with the trend is the key. As long as the 3330 support is not broken, the daily line structure will still maintain a strong bullish trend. Do not blindly chase the short position. The operation of short orders against the trend needs to be particularly cautious. I will promptly remind you of the specific operation strategy according to the changes in the market. You can pay attention to the bottom notification. It is recommended that you keep paying attention and respond to the market rhythm steadily.
Reference for gold operation strategy: Go long on gold near the 3345-3355 area, target the 3365-3370 line. If it breaks above 3370, you can continue to hold and hope for further continuation.

XAU/USD(20250714) Today's AnalysisMarket news:
① Fed's Goolsbee: The latest tariff threat may delay rate cuts. ② The Fed responded to the White House's "accusations": The increase in building renovation costs partly reflects unforeseen construction conditions. ③ "Fed's megaphone": The dispute over building renovations has challenged the Fed's independence again, and it is expected that no rate cuts will be made this month. ④ Hassett: Whether Trump fires Powell or not, the Fed's answer to the headquarters renovation is the key.
Technical analysis:
Today's buying and selling boundaries:
3348
Support and resistance levels:
3395
3377
3366
3330
3319
3302
Trading strategy:
If the price breaks through 3366, consider buying in, with the first target price at 3377
If the price breaks through 3348, consider selling in, with the first target price at 3330

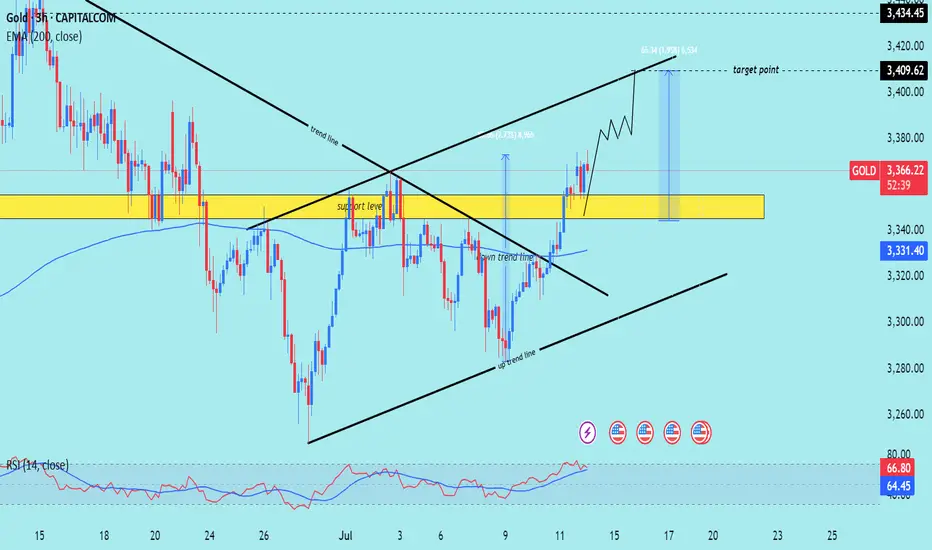
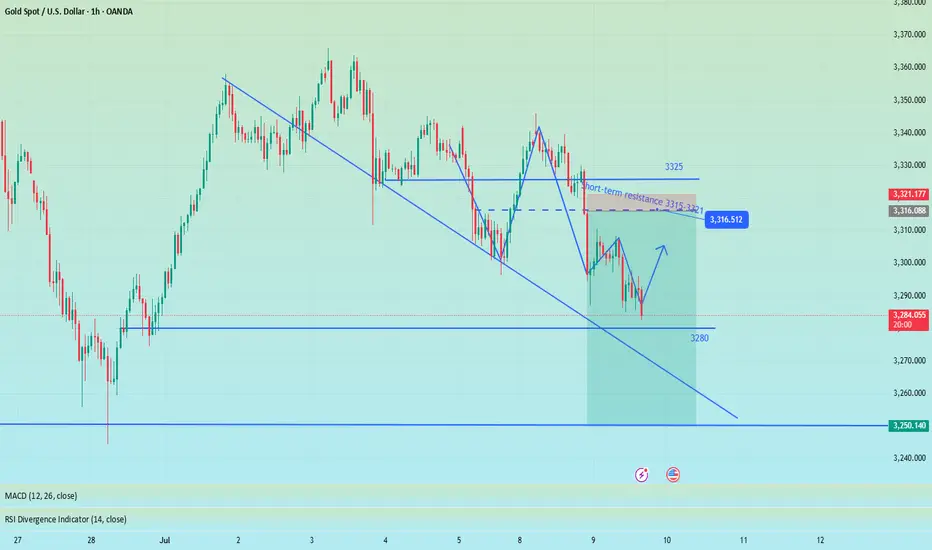
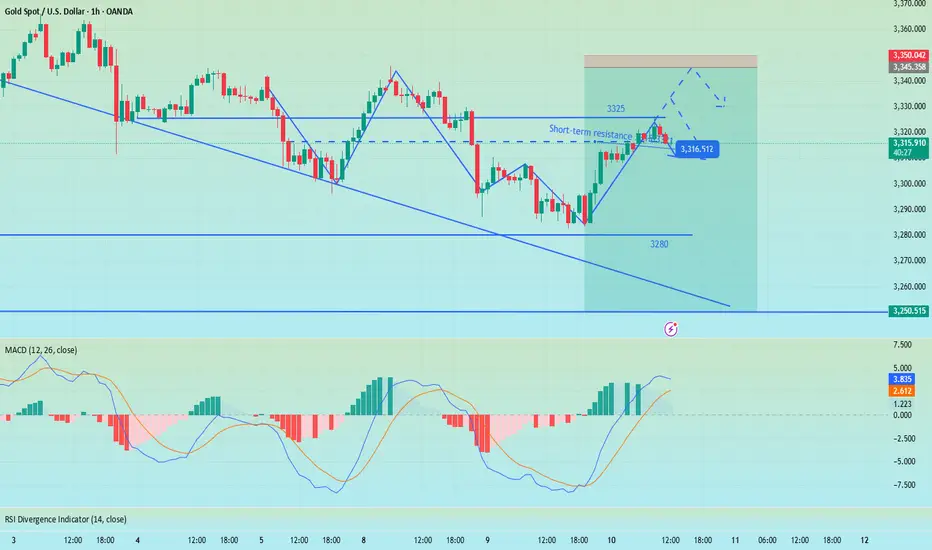
Although the bulls are strong, don't chase them at high levelsGold trend analysis:
The market is fluctuating repeatedly now, and it is possible to rise or fall, but under the bullish trend, the main force is still rising. Therefore, this week's trading is to fall back and do more at a low price. Whether it is the previous 3285, 3306, or 3315, there are good profits. Although it is temporarily unable to break out of the bullish volume, at least the trend remains unchanged, and there will definitely be a large upward space in the future. Today is Friday, and we still pay attention to the possibility of bullish volume. This week, we have been emphasizing that if it rises during the week, we will see the 3370 high point. If 3370 breaks, there are still 3380 and 3400 above. On Friday, we will see whether this idea is realized.
From a technical point of view, there was a sharp pull this morning, with the big sun breaking through the upper track of the downward channel 3326 in the above figure, and then stepping back to confirm stabilization and bottoming out, which means that the breakthrough is effective, so you can directly follow the bullish trend in the morning, and during the European session, it repeatedly went up and down around the 3345-3332 range. With the experience of yesterday's trend, today we have been waiting for it to approach the 10-day moving average and then continue to be bullish on dips, and the entry point is basically good; currently it has broken through the resistance level of 3345 in the European session, so it depends on whether it can stand directly on it tonight. Once it stands, it can gradually rush to 3370, and the second is 3374, etc.; Of course, if it just pierces but does not stabilize, it will continue to spiral slowly upward around the yellow channel in the figure, so continue to wait patiently for the 10-day moving average, which is also the lower track position to grasp the low and long; Therefore, tonight gold 3345-3333 continues to rise on dips, with 3330 top and bottom positions as nodes, resistance at 3370, further resistance at 3374, etc.; If there is an unexpected big negative inducement to empty the market like yesterday, pay attention to stabilization above 3320 and still bullish;
Gold operation strategy: It is recommended to go long when it falls back to 3333-3345, and the target is 3360-3370.

Precisely look at 3365 and pay attention to the pullback chanceAt present, gold has risen as expected and reached the highest level near 3368. The upper 3375-3385 constitutes a short-term resistance level. At present, the bullish momentum is still relatively strong, and the short-term support structure below has been formed. I still maintain the views of the previous transaction and wait for a second trading opportunity when it pulls back below. Although the 1H chart shows that the current trend remains strong and the retracement is small, it is necessary to remain cautious - even if the market is strong, it is not recommended to chase long easily, and the risk of a deep correction in the gold price must be guarded against. First, pay attention to the support area of 3345-3335 below. If it falls back to this level, you can consider going long with a light position.
OANDA:XAUUSD
After gold adjusted, continue to go long when it fell back
The 1-hour moving average of gold has crossed upward to form a golden cross. The gold bulls are full of strength and have started to move upward. After breaking through in the afternoon, gold fell back to the support near 3330 and began to continue to rise. We never act as a die-hard bull or bear. We make timely adjustments when the direction changes. Gold bulls are in an even better position at the moment and have even broken through the key level of 3345. The pullback in gold will continue to provide opportunities for long positions. Gold is aiming at 3380, let's wait and see. The gold bulls are better at the moment and have broken through the key position of 3345. The decline of gold is to continue to give opportunities for buying. Gold is pointing to 3380, let's wait and see.
US trading operation ideas:
Gold 3340 more, stop loss 3328, target 3370-3380
Bearish is still the main trend, first test 3250 supportYesterday, as the market expected a trade agreement to be reached between the US and its trading partners, risk sentiment was boosted. The strengthening of DXY and the rise in US Treasury yields put some pressure on gold.
On Monday, gold rebounded to 3320, and on Tuesday it touched above 3320 and began to fall sharply. In the short term, 3320 is a key trading position that we need to pay attention to. From the daily chart, the support line of 3320 has been completely broken, and the two major support points below are 3250 and 3200 respectively. Judging from the 4H chart, the decline may have just begun. Next, we may first face a test of the 3250 support line. If the 3250 support can be maintained, gold will maintain a volatile consolidation in the short term. Otherwise, if it falls below 3250, it will test the 3200 mark.
OANDA:XAUUSD
Gold fluctuates, continue to short at 3345 during the dayTrump's trade policy continues to stimulate risk aversion. Although the Federal Reserve's meeting minutes are neutral, they can potentially provide support for gold. Yesterday we gave the short positions of 3321 and 3333, which have generated profits so far. At the same time, it should be noted that the 4H MACD indicator has the potential demand to form a golden cross. In the short term, there is a certain suppression force at 3330-3335. If the Asian and European sessions repeatedly test this position but fail to break through effectively, you can go short without hesitation. If you want to go short again during the day, you can consider 3340-3345 and defend 3350. The lower 3310-3305 is a relatively strong support area during the day. If the Asian session retreats to this point, you can consider going long, with the target looking at 3330-3335.
OANDA:XAUUSD
XAU/USD) bearish Trand analysis Read The captionSMC trading point update
Technical analysis of (XAU/USD) on the 3-hour timeframe, projecting further downside after rejection from a resistance zone aligned with a descending trendline.
---
Analysis Summary
Trend Bias: Bearish
Current Price: ~$3,301.96
Structure: Price is respecting a descending channel, with multiple rejections from the upper boundary and key resistance zone.
---
Key Technical Insights
1. Resistance Zone & Downtrend Line:
Price was rejected from a resistance block near the EMA 200 (~$3,331) and descending trendline.
This level has repeatedly triggered strong downside moves (highlighted with red arrows).
2. EMA 200 Reaction:
The EMA 200 at $3,331.10 is acting as dynamic resistance.
Each time price reaches or crosses above this line, selling pressure increases.
3. Bearish Price Projection:
After recent rejection, the chart anticipates a pullback to the support zone between $3,248.26 and $3,245.71.
A deeper drop toward $3,159.13 is projected as a next major target, consistent with previous price moves.
4. RSI Indicator:
RSI at 40.24 suggests bearish momentum is still in play but not yet oversold—indicating room for more downside.
---
Bearish Trade Idea
Element Level / Description
Entry Zone Below resistance: $3,310–$3,320
Target 1 $3,248.26–$3,245.71 (support zone)
Target 2 $3,159.13 (channel base / next support)
Stop-Loss Above $3,335 (above resistance zone)
---
Risk Considerations
Fundamental catalysts: Gold is sensitive to USD strength, interest rate decisions, and macroeconomic data.
Invalidation: A strong breakout and close above the descending trendline and EMA 200 would negate the bearish outlook.
---
Summary
This analysis outlines a bearish setup for XAU/USD, supported by trendline resistance, EMA rejection, and RSI momentum. If current structure holds, a move toward the $3,245 and $3,159 levels is likely.
Please support boost 🚀 this analysis)

The shock continues, and the retracement continues to go long📊 Gold Day Trading Strategy (Recommendation index ⭐️⭐️⭐️⭐️⭐️)
📰 News information:
1. The lasting impact of new tariffs
2. The impact of geopolitical conflicts
3. The Fed’s interest rate cut
📈 Technical Analysis:
From the hourly chart, gold has formed a head and shoulders bottom. At present, 3320 below has formed a certain support in the short term. For now, the daily line still cannot close below 3320. If the daily line closes below 3320, the decline may open further. On the contrary, the current upper suppression position of gold is near 3350. If the daily line stands above 3350 again, it will be a bull-dominated trend and may test 3380-3390 above. In the short term, pay attention to the support line of 3325-3315 below. If it retreats to the support level, you can consider going long. Look to the resistance range of 3340-3350 above, and pay special attention to the suppression line of 3365-3370. At the same time, if the European session is always suppressed below 3345 and sideways, there is no performance, so you should consider selling it, and there may be further retreat in the evening.
🎯 Trading Points:
BUY 3330-3325-3315
TP 3340-3350-3365
In addition to investment, life also includes poetry, distant places, and Allen. Facing the market is actually facing yourself, correcting your shortcomings, facing your mistakes, and exercising strict self-discipline. I share free trading strategies and analysis ideas every day for reference by brothers. I hope my analysis can help you.
TVC:GOLD OANDA:XAUUSD FXOPEN:XAUUSD FX:XAUUSD FOREXCOM:XAUUSD PEPPERSTONE:XAUUSD
