XAU/USD(20250612) Today's AnalysisMarket news:
① The EU hopes that the trade negotiations will be extended beyond the suspension period set by Trump. ② Bessant: As long as "sincerity" is shown in the negotiations, the Trump administration is willing to extend the current 90-day tariff suspension period beyond July 9. ③ Trump will hold multiple bilateral talks during the G7 summit. ④ The total customs revenue of the United States in May reached a record high of US$23 billion, an increase of nearly four times year-on-year. ⑤ Lutnick: One deal after another will be reached.
Technical analysis:
Today's buying and selling boundaries:
3343
Support and resistance levels:
3388
3371
3360
3326
3315
3298
Trading strategy:
If the price breaks through 3371, consider buying in, and the first target price is 3388
If the price breaks through 3360, consider selling in, and the first target price is 3343
Goldpreis

How to arrange the gold price in the evening? Go long at 3330📰 Impact of news:
1. CPI data is profitable
2. The US CPI rose slightly in May, and Trump's tariff effect has not yet fully emerged
📈 Market analysis:
The trend line position of the 4H chart coincides and resonates with the middle track of the Bollinger Band, with 3326 as the watershed reference. This is why it is difficult to break below this point after repeated tests. Once it breaks below, the short-term trend is likely to fluctuate from strong to weak. However, the current support below is still strong at 3330-3326. The repeated rise and fall of data during the day also stopped the decline at this point. If the price does not lose here, the pattern of strong fluctuations will remain unchanged, and the bulls will gradually regain lost ground. At present, it is time for space. The operation suggestion for the future market is to continue to rely on the bullish trend above 3330, and 3330-3326 can be flexibly entered. At the same time, the RSI indicator is above 50 and there is still some space from the overbought zone. The signal is given that 3360, although the long upper shadow line K is closed, is very likely not the short-term top. After the sharp rise and fall in 1H, it went sideways and waited for the next wave of strength. If the night close is above 3326, the upper area will probably be 3350-3360. If the price can break through and stabilize this level, the upward pace will most likely accelerate to reach 3370-3380.
🏅 Trading strategies:
BUY 3330-3326
TP 3350-3360
If you agree with this view, or have a better idea, please leave a message in the comment area. I look forward to hearing different voices.
OANDA:XAUUSD FX:XAUUSD FOREXCOM:XAUUSD FXOPEN:XAUUSD TVC:GOLD
Gold rebound is still a short-selling opportunityFirst of all, let's take a look at why the market is still not reversing after a big rise, and there is a rapid rise and fall?
The data is bullish, and gold is rising rapidly, but we should pay attention to the sustainability of the rise, and secondly, the current trend direction. The overall trend of gold is still fluctuating downward recently, so even if the data is bullish, it is likely to just give an opportunity to "go high and short".
Although gold performed strongly after the data was released, it began to fall under pressure at the 3360 line, the trading concentration area of the last box shock, indicating that the bulls' volume is still not enough to break through the upper resistance. It is reasonable to rise and fall.
Since gold is currently in a market that is tempting to buy more, it means that the main trend is still bearish. The rebound is still dominated by short selling. The gold 1-hour cycle closed with a long upper shadow, indicating that the upward attack is weak, indicating that the area above 3350 is still a strong pressure area. This upward rush is just a short-term effort with the help of data benefits, which is a typical false breakthrough. Therefore, gold rebounded to the 3350-3360 area in the US market, and it is still dominated by high shorts.
This is the charm of the market - some people are always hesitant in the ups and downs, while others can always grasp the key turning points. The premise is to be able to see the trend clearly and follow the trend.
Don't be led by the market, but understand: Is the current fluctuation a trap or an opportunity?
If the direction is wrong, the effort will be in vain; if the direction is right, you will get twice the result with half the effort.
Don't make excuses for failure, just find ways to succeed. Have you found it?
All recent trading strategies and ideas have been realized, and the point predictions are accurate. If your current gold operation is not ideal, we hope to help you avoid detours in your investment. Welcome to communicate with us!

Analysis of the latest gold price trends!Market news:
In the early Asian session on Wednesday (June 11), spot gold fluctuated in a narrow range and is currently trading at $3,330 per ounce. London gold prices rose and fell on Tuesday as the conflict between Russia and Ukraine continued and the World Bank also lowered its global economic growth forecast. Traders are closely watching the Sino-US trade negotiations, the results of which may ease trade tensions and boost the global economy, thereby reducing the demand for safe-haven assets, while the continued rise in US stocks has also suppressed the safe-haven buying demand for international gold.In the past few days, gold has fallen from its recent highs, mainly because the market has optimistic expectations for negotiations between China and the United States and Britain and Russia. If the United States and China reach a trade agreement, it will weaken the attractiveness of gold as a safe-haven asset. Gold is a hedge investment tool and usually rises during periods of geopolitical and economic uncertainty. The market is currently focusing on the upcoming US CPI data for May. Expected data show that inflation may rise slightly to 2.5%, with core CPI around 2.9%. If the data exceeds expectations, it may be bearish for gold in the short term; if inflation slows down, it will strengthen the market's expectations for the Fed to cut interest rates this year, which is bullish for gold prices.
Technical review:
Technical daily chart continues to close with alternating yin and yang cycles, the moving average is glued together, and the RSI indicator runs on the middle axis. The moving average of the four-hour chart is glued together, the price is adjusted near the middle track of the Bollinger Band, and the RSI indicator is flat. Gold rose above 3349 yesterday and fell back to 3320 in the early morning. After a sharp drop to 3315 in the Asian session, it needs to break the low point of 20 in the early morning and then quickly rise to 3331. Pay attention to the 3320 position in the Asian session. If 3320 stabilizes and moves upward, continue to look at the test of 3340/50 during the day. Otherwise, if it loses again or adjusts around 20 during the day, it will be regarded as a weak sell. Pay attention to 3306/3293 below. Gold technical aspects continue to be arranged with a shock idea. Under the premise that there is no news to stimulate the selling, gold continues to maintain low-price buying as the main technical aspect, and high-price selling as the auxiliary.
Today's analysis:
From the daily level, gold is in a high-level shock consolidation since the peak of 3500. The current highs of 3500, 3435, and 3403 are gradually moving down, and the lows of 3120, 3245, and 3293 are gradually rising. The shock range is gradually narrowing. The short-term market may continue to maintain shocks. If it breaks, it needs to wait for the direction of the breakthrough to be stimulated by major news!
So today's lock range is 3293-3360. It is recommended to sell at high prices and buy at low prices to treat shocks, mainly short-term or ultra-short-term, and do not chase ups and downs before the range is effectively broken.
Operation ideas:
Buy short-term gold at 3310-3330, stop loss at 3292, target at 3340-3360;
Sell short-term gold at 3350-3363, stop loss at 3362, target at 3300-3310;
Key points:
First support level: 3320, second support level: 3306, third support level: 3292
First resistance level: 3346, second resistance level: 3358, third resistance level: 3376
Gold fluctuates repeatedly, and opportunities emerge!Gold was under pressure for the second time during the day, and the pressure at the 3349 line fell back. It continued to be treated with a fluctuating mindset. The 4H cycle observation showed that the Bollinger Bands were closing, and the K-line repeatedly interspersed around the middle track. The short-term structure tended to fluctuate upward. Pay attention to the 3348-3350 and 3362 pressure zones above, and the support below is located in the 3315 and 3302 areas. In terms of operation, the main long and auxiliary short ideas are maintained, and the guidance of CPI data is paid special attention.
Operational suggestions: Gold retreats to the 3315-3305 area and tries to arrange long orders, with the target looking at 3338 and 3349. A strong breakthrough can look up to 3360. If the 3350-3360 pressure zone above is not broken, short orders can be tried in the short term.
All recent trading strategies and ideas have been realized, and the point predictions are accurate. If your current gold operation is not ideal, we hope to help you avoid detours in your investment. Welcome to communicate with us!

How to plan for the positive effects of CPI data?📰 Impact of news:
1. CPI data is profitable
2. The US CPI rose slightly in May, and Trump's tariff effect has not yet fully emerged
📈 Market analysis:
The CPI data is bullish. The current gold price has risen to around 3360. We took profits at the 3330 level and exited the market, which once again confirmed the forward-looking nature of our trading vision. From a technical perspective, the RSI indicator in the short-term hourly chart is close to the overbought area. In the short term, pay attention to the upper resistance line of 3360-3365. If it rebounds to the 61.8% position and encounters resistance and pressure, consider shorting at high levels. On the contrary, if it effectively breaks through and stabilizes above, it is expected to touch the 3400 line. In the short term, pay attention to the lower support line of 3340-3330.
🏅 Trading strategies:
SELL 3360-3365
TP 3340-3330
If you agree with this view, or have a better idea, please leave a message in the comment area. I look forward to hearing different voices.
TVC:GOLD FXOPEN:XAUUSD FOREXCOM:XAUUSD FX:XAUUSD OANDA:XAUUSD
CPI is coming, which direction should gold go?
True trading masters can maintain inner peace in the hustle and bustle of the market and are not confused by short-term fluctuations. They know that the short-term trend of the market is full of randomness, like ripples on the water, seemingly complicated but difficult to predict. They are like gatekeepers of the mind, with strong determination to resist the emotional interference of the market, and no matter how big the market fluctuations are, they will not let them lose their footing. When others are scared and want to sell their stocks quickly, they can keep their composure; when others are stimulated by the daily limit and want to chase high, they can hold the bottom line.
The international gold price opened at $3,325/ounce and closed at $3,322/ounce on the last trading day. The real part of the daily K-line fell by only $3/ounce and finally closed at the cross line. Yesterday, the gold price fluctuated slightly and closed down, mainly because of the market's attention to the progress of Sino-US trade negotiations. The market generally believes that if the negotiations can ease trade tensions and boost the global economy, it will weaken the demand for safe-haven assets. At the same time, the strengthening of the US dollar also brings downward pressure on gold.
Weekly candlestick chart: running in the rising channel, long-term buy on dips
Daily candlestick chart: running in disordered oscillation structure, cautiously wait and see in the medium term
4-hour chart: running in an oscillating bullish trend, short-term buy on dips
30-minute chart: bottom structure established, short-term buy on dips above 3326
Intraday plan to continue to buy in the 3332 area, defend 3325, target 3350-60

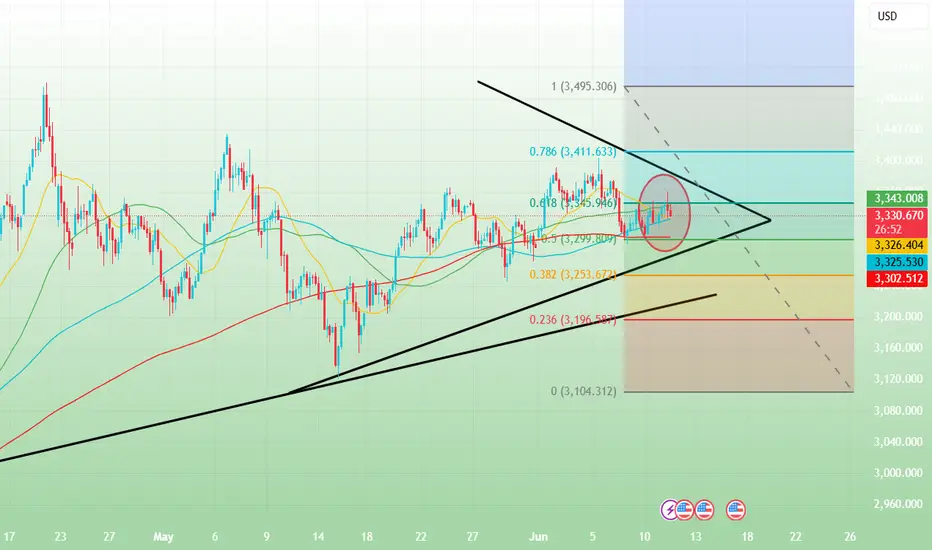
GOLD PRICE ACTION ANALYSIS – June 11, 2025 GOLD PRICE ACTION ANALYSIS – June 11, 2025 🟡
Technical Breakdown & Bearish Scenario Ahead ⚠️📉
🔍 Overview:
The chart presents a clear range-bound structure with strong horizontal resistance around the $3,400–$3,420 zone and support around the $3,120–$3,160 level. Price is currently trading near the upper range of the consolidation.
📊 Key Technical Levels:
🔴 Resistance Zone: $3,400 – $3,420
➤ Price has been rejected here multiple times (highlighted by red arrows and orange circles), showing strong supply pressure.
🟣 Intermediate Support: $3,260.618
➤ This level acted as a minor support and could be tested again if the current pullback deepens.
🟤 Major Support Zone: $3,120 – $3,160
➤ A key demand area where price previously bounced significantly.
📉 Bearish Setup:
A potential lower high is forming just below the resistance zone.
The projected path suggests a minor pullback to form a bearish retest, followed by a potential breakdown below $3,260.
If the $3,260 support is broken decisively, further downside toward the $3,120–$3,160 support is likely (blue arrow projection).
🔄 Bullish Scenario (Invalidation):
A breakout and strong close above $3,420 could invalidate the bearish structure.
In that case, price might attempt to target higher resistance levels beyond $3,440.
📌 Conclusion:
Gold remains in a range with a bearish bias unless the $3,420 resistance is breached.
🔽 Watch for confirmation below $3,260 for bearish continuation.
✅ For bulls, wait for a strong breakout above resistance with volume.

Analysis of gold prices on June 11
📌Gold news
🎈Economic data and policy expectations
U.S. employment data; initial jobless claims increased for two consecutive weeks, and the market focus shifted to the non-farm payroll report released this week. The data performance will affect the Fed's policy path.
Trump pressures interest rate cuts: Trump recently called on the Fed to cut interest rates by "one percentage point" again, and hinted that he would consider replacing the Fed chairman, exacerbating market expectations for loose monetary policy.
🎈Long-term support factors
Despite short-term fluctuations, global economic and geopolitical uncertainties (such as repeated trade frictions and debt risks) still provide long-term safe-haven demand for gold, especially in the context of the divergence of monetary policies between European and American central banks, the allocation value of gold is highlighted.
📊Technical analysis
Before the European session, the gold price showed a continuous positive trend. I gave a hint in my analysis that I was not in a hurry to guess the top, and followed the trend to rise to around 3340 and wait for the turning point to appear. The opening trend of the European session tended to fluctuate until it rose to around 3348 in the evening and then turned from rising to falling, but the decline was not strong. It rose again at the position of the European session. Now the gold price is trading around 3350. From the market point of view, this wave of rise was supported by the trend line at 3300. Whether it was geopolitical conflicts or various news about Sino-US trade negotiations that stimulated buying to drive gold prices up, the second rise in the US session has exceeded 3340.
The next key suppression level is around 3360, which is 618 from 3403 to 3300, which can be treated as a turning point. The initial support below focuses on the high point of yesterday's Asian session at 3338.
💰Strategy Package
Waiting for gold: short at 3355-3360, stop loss at 3365, target at 3340-3328!
⭐️ Note: Labaron hopes that traders can properly manage their funds
- Choose the number of lots that matches your funds

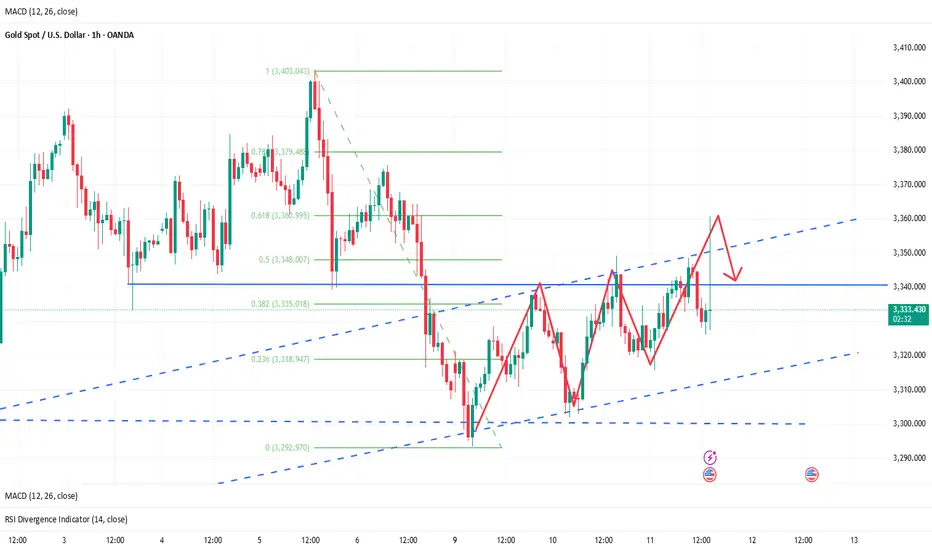
Gold V-shaped reversal still has room to rise In the morning, the market was under pressure at 3328, and two consecutive big negative lines fell to the low of 3302, breaking through the lower track of the descending flag consolidation channel, forming an effective break. 3317 was originally the confirmation point of the channel counter-pressure, and it was also the 618 split resistance at the time. Then the middle track was lost, and the trend was bearish, so it tried to rebound but continued to fall under pressure.
But the market immediately made a V-shaped reversal, breaking through the morning high of 3328, and had attacked to 3342 before the US market. The European session was volatile and strong, and with the help of a pullback before and after the U.S. session to lure short sellers, there is still hope for a second rise
The focus of the support for the retracement is on two positions: one is the 3322 line, corresponding to the middle track and 50% split support; the other is 3318, corresponding to the 618 split support. If it stabilizes after touching it, it will most likely point to the 3348 counter-pressure position.
If the pressure of 3348 cannot be broken, there is still a possibility of repeated fluctuations in the short term. It is necessary to pay attention to whether the secondary low point appears when it pulls back to further consolidate the support structure. If the market directly breaks through and stands above 3348, 3293 may have been confirmed as a short-term low.
The recent trading strategy ideas are all realized, and all the points are predicted accurately. If your current gold operation is not ideal, I hope I can help you avoid detours in your investment. Welcome to communicate with us!

Gold fluctuates repeatedly and opportunities emerge.Gold bottomed out in the Asian session and rebounded to break through the opening of the decline. The European session continued to break through yesterday's high. The US session continued to break through the key pressure position of 3335-3345, and walked out of the standard strong cycle. After the break, it is necessary to change the thinking and follow the trend to be bullish. Pay attention to the support below 3315-3325. In terms of operation, it is mainly long when it falls back. The upper side gradually looks to 3352 and 3365. If the pressure is not broken, look at the falling space!
Operation suggestion: Go long when gold falls back to 3325-3315, and look at 3338 and 3352! If the pressure above 3352 and 3365 is not broken, you can short!
The recent trading strategy ideas are all realized, and all the points are predicted accurately. If your current gold operation is not ideal, I hope I can help you avoid detours in your investment. Welcome to communicate with us!

Gold rebounds and repairs, is it a shock or a bull market?📰 Impact of news:
1. Geopolitical situation
2. Impact of the US dollar trend on gold
📈 Market analysis:
At the gold hourly level, after the pressure in the Asian session in the morning, it directly fell to the vicinity of 3302. The big Yin effectively lost the lower track of the descending flag consolidation channel. The original 3318 line was the confirmation of the channel counter-pressure point, which happened to be the 61.8% split resistance level at that time. At the same time, it lost the middle track. Therefore, we gave a trading idea of looking at the rebound under pressure and continuing to decline in the European session. As a result, the market directly took a V-shaped wash-up and once pulled up to the vicinity of 3342.
The European session fluctuated strongly and rose. Before and after the US session, it took advantage of the retracement to lure the short position, and there is still the possibility of a second pull-up space. Therefore, in the subsequent retracement support level, pay attention to two positions, one is 3322-3324, and the other is the 61.8% division support level of 3318. If it stabilizes, there is a high probability that there will be a second upward space, pointing to 3348. If the pressure here cannot be overcome, the bottom will continue to oscillate back and forth. At that time, it will fall back to see if a secondary low point can be formed to further stabilize the support. If it goes straight through and stands on it, 3293 may already be the short-term low.
On the whole, I still hold short orders before the effective breakthrough of 3345, but at the same time, as the gold price rebounds and moves upward, the short-term support level is temporarily expected to be 3325-3320.
🏅 Trading strategies:
SELL 3335-3345
TP 3325-3315
BUY 3325-3330
TP 3350-3360
If you agree with this view, or have a better idea, please leave a message in the comment area. I look forward to hearing different voices.
TVC:GOLD FXOPEN:XAUUSD FOREXCOM:XAUUSD FX:XAUUSD OANDA:XAUUSD

Perfect grasp of the high altitude and low multi rhythm!The current trend of gold continues yesterday's trend, maintaining a high rebound and volatile market. But don't panic, focus on the performance of the rebound. If the rebound fails to break through the upper resistance level, continue to focus on shorting. The upper suppression area is locked at the 3335-3345 line. Although the bullish performance has been strengthened, if it cannot effectively break through this range, it is still a short-term weak signal. From the current market, the upper pressure is obvious, and the rebound can rely on this range to layout the main short, focusing on the continuation of the decline. The lower support focuses on the 3293-3300 integer mark, and the overall long and short wide range of volatile market is maintained. Before the daily level fails to effectively break through and stand firm at the 3345 mark, it is difficult to say that the bulls will turn strong, and operations need to be cautious. If the market adjusts, the strategy will be updated simultaneously.
Operation strategy suggestion: Gold rebounds to the 3335-3345 first-line area to choose the opportunity to short, target the 3295-3306 range, strictly control risks, and follow the trend.

Gold price rebounds and then falls
The current trend is similar to that of Monday. Now that the market has continued to rise, we should not rush to guess the top. The idea is to follow the trend and wait for the stagflation signal to appear before looking at the callback. At present, the turning point of this wave is roughly expected to be around 3338. After the turning point appears, I will prompt you to participate in short orders to watch the callback. The callback position is expected to be around 3312. That is, the idea of European trading is to participate in short orders near 3338, with the target near 3315; after there is a stop-loss signal near 3312 below, participate in long orders.

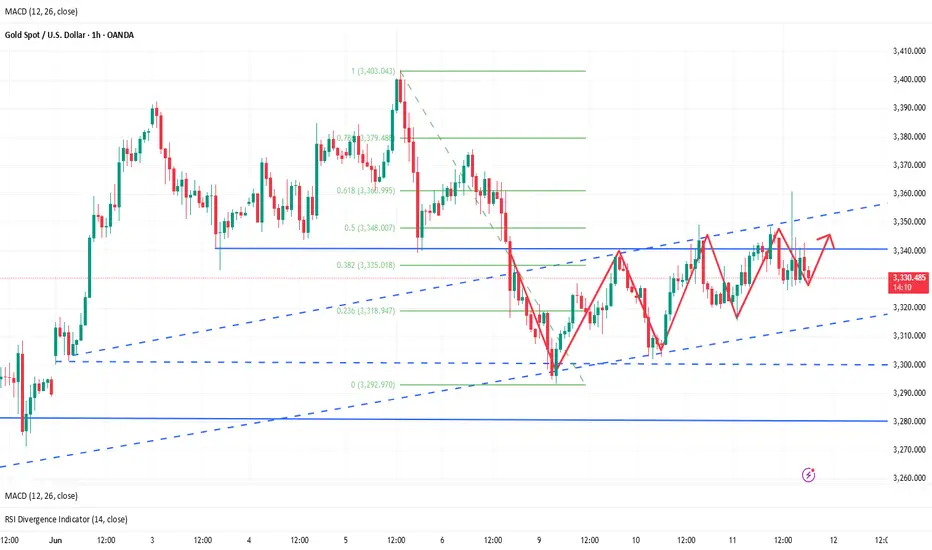
Gold fluctuates repeatedly, hiding great opportunities!After the opening of gold today, the bulls and bears played fiercely. In the early trading, it fell to 3293 and received temporary support, then stabilized and rebounded. It broke through the high point of 3320 in the Asian session and continued to rise above 3330. However, the price was under obvious pressure near 3330, and the momentum indicators (MACD, RSI) showed a top divergence at the same time, reflecting the exhaustion of bullish momentum and limited short-term upside space.
From the technical structure, gold has effectively fallen below the middle track support of the H4 cycle, and at the same time lost the upward trend line built since the low point in June. The two breakout positions are highly overlapped, constituting an obvious technical weakening signal. The current trend is trapped in the key resistance suppression area, and it is expected to enter a high-level shock and weakening stage.
The operation suggestions are as follows:
🔸Strategy direction: short-term thinking
🔸Entry area: 3335–3345 range
🔸Defense reference: stop loss above 3350
🔸Target expectation: look down to 3305, break to 3293 or even 3280 near the extension support
In terms of fundamentals, the US dollar index is under short-term pressure, mainly due to the decline in the US fiscal outlook and US Treasury yields; but the non-agricultural data boosted economic resilience, which cooled the market's expectations for a rapid rate cut this year, restricting the rebound space of gold prices. Although risk aversion has support, it has not yet become a dominant driver. The current market sentiment remains cautiously neutral.
Overall judgment: The short-term rebound of gold prices is limited, and the short-term trend is gradually released after the structural break. It is recommended to follow the trend and go high, control risks, and steadily execute trading plans.

Gold rebound fails to change the trend and is still bearish?📰 Impact of news:
1. The streets of Los Angeles are full of "gunpowder smell"! Immigration protests escalate, and Trump sends troops to suppress them
2. Geopolitical situation
3. Federal Reserve political expectations
📈 Market analysis:
At the hourly level: the Bollinger Band opening is narrowing, the MACD technical indicator is running in a golden cross, and the RSI fluctuates frequently in the short term. There is a certain potential for short-term promotion. If the gold price stabilizes above 3315, it may trigger a rebound and touch 3330-3340 again. If the gold price continues to be below 3300 and the short position is strengthened, it may fall to a new low. Therefore, if it rebounds again to the 3330-3340 resistance line, short positions can still be considered.
🏅 Trading strategies:
BUY 3315-3318
TP 3330-3335
SELL 3330-3340
TP 3300-3290-3280
If you agree with this view, or have a better idea, please leave a message in the comment area. I look forward to hearing different voices.
OANDA:XAUUSD FX:XAUUSD FOREXCOM:XAUUSD FXOPEN:XAUUSD TVC:GOLD

Perfect prediction of Monday's opening trendGold opened near 3310 today, and fell under pressure after reaching a high of 3321, which was in line with our previous prediction of the short-selling layout in the 3320-25 area. We successfully entered the short order and successfully stopped profit at 3305. Then the market was supported and stabilized near 3296. We decisively went long and also realized profit.
From the current trend, the short-term suppression during the day is still focused on the 3320-3325 line, and the key suppression area is around 3338-3345. Gold closed in an inverted hammer shape last week. From a technical point of view, the rebound is still mainly short-selling. If you are not in a good rhythm in gold trading recently, welcome to communicate and reduce unnecessary trial and error.
【Short-term technical analysis】
The upper short-term pressure focuses on the 3320-3325 area. If it rebounds to this point, it will be short first and look for a decline. If it rises strongly to the 3338-3345 range, it will still be the focus of short positions. The lower support focuses on the 3295-3285 area. The overall strategy of "high-short-low-long" is maintained. It is not recommended to frequently chase orders in the middle position. Be patient and wait for key point signals. I will remind you of the specific entry and exit plan during the session. It is recommended to pay attention in time.
【Gold operation strategy】
1. Go short first at the rebound 3320-3325 line. If it touches the 3338-3345 area, you can cover your position and go short. The target is 3306-3295. If it breaks, continue to hold and look down.

How will gold perform in the future?Market news:
In the early Asian session on Monday (June 9), spot gold opened high and fell, currently trading around $3,305/ounce. The large-scale riots in Los Angeles, the United States, attracted some safe-haven buying to support the London gold price. The stronger-than-expected US employment report hit the Federal Reserve's hopes of cutting interest rates this year, and silver once surged to its highest level since 2012. Data from the US Department of Labor showed that employers added 139,000 jobs in May, less than 147,000 in April, but more than the 130,000 increase predicted by a survey of economists. After the data was released, the financial market bet that the Federal Reserve would not cut interest rates until September, and the probability of a rate cut in September dropped from 88% to 60%. There will be two rate cuts in 2025, reducing bets on a possible third rate cut.In the next week, the market will usher in major trade negotiations and heavyweight US CPI data, which investors need to pay close attention to. In addition, US federal law enforcement officers continued to search for illegal immigrants in many places in Los Angeles County on the 7th, and had serious conflicts with local community residents for the second consecutive day. Investors also need to pay attention to the impact of market sentiment.
Technical Review:
Technically, gold plunged sharply after midnight on Friday, and the weekly line closed with a long upper shadow line and a small positive. The 3400 mark encountered resistance and fell sharply and fell into another adjustment cycle. The daily line closed with a continuous negative structure, and the New York closing price once again lost the MA10-day moving average of 3330. The price returned to the middle track of the Bollinger band at 3310, and the RSI indicator's central axis 50 value flattened! The short-term four-hour chart MA10/7-day moving average opened downward, the RSI indicator's central axis 50 value ran below, and the Bollinger band opened downward and the price ran along the middle and lower tracks. At the beginning of the week, trading focused on the rebound strength after the oversold. The main idea was to sell at a high price on the rebound, and to buy at a low price as an auxiliary.
Today's analysis:
At the daily level, the price of gold has maintained a volatile pattern in recent times. The Bollinger band opening narrowed, indicating that the buying and selling forces were stalemate. MACD fast and slow lines are above the zero axis, the spacing is narrowing and there is a golden cross trend, the red kinetic energy column is beginning to appear, the buying power is slowly gathering, the RSI indicator is around 55, and the buying and selling game is fierce! From the hourly line, the Bollinger Bands open downward, and selling is temporarily dominant.MACD dead cross operation, the green kinetic energy column continues to increase, the 5-day moving average crosses the 10-day moving average, and the short-term downward trend is obvious. However, the current support near 3300 is strong, and it rebounded after multiple dips. In the future, we need to pay attention to the breakthrough of key positions to grasp the trading opportunity.
Operation ideas:
Short-term gold 3283-3286 buy, stop loss 3275, target 3310-3330;
Short-term gold 3330-3333 sell, stop loss 3342, target 3290-3270;
Key points:
First support level: 3293, second support level: 3271, third support level: 3253
First resistance level: 3330, second resistance level: 3356, third resistance level: 3378

XAU/USD(20250609) Today's AnalysisMarket news:
Fed Harker: Amid uncertainty, the Fed may still cut interest rates later this year. Musallem: There is a 50% chance that the trade war will lead to a sustained inflation outbreak. Tariffs may push up inflation within one or two quarters. The ECB cut three key interest rates by 25 basis points. Lagarde hinted that the rate cut cycle will end, and the market is no longer fully pricing in another 25 basis point rate cut this year.
Technical analysis:
Today's buying and selling boundaries:
3330
Support and resistance levels:
3398
3373
3356
3304
3288
3262
Trading strategy:
If the price breaks through 3330, consider buying in, with the first target price of 3356
If the price breaks through 3304, consider selling in, with the first target price of 3288

Gold on Monday depends on this wave of operationsBefore the non-agricultural data on Friday, gold maintained an overall oscillating pattern, opening at 3354, briefly rising to around 3375 and then falling under pressure, entering an overall oscillating downward mode. We also caught the rhythm of long orders many times and successfully exited the market with profits. Although the non-agricultural data was bearish, gold did not dive quickly, but rebounded to around 3363 after short-term fluctuations, and then fell under pressure again, and finally closed in an inverted head shape, with obvious technical bearish signals.
From the perspective of form, gold is expected to continue to rebound high and high next week. Focus on the support of this week's low point of 3296. Once it falls below, it is possible to further explore the 3270-3260 area. However, if this position remains stable and unbroken, the market still has room for rebound and repair.
From a specific technical perspective, the obstructed decline of the 3375 line on Friday is more critical, with the lowest intraday drop to 3307, and the bearish momentum is still strong. It is recommended to be prudent in operation and do not blindly chase orders.
🔸Operation ideas for gold next week:
1️⃣ If it rebounds to 3320-3325, you can try to arrange short orders. If it rebounds further to 3338-3345, it is recommended to cover short positions.
2️⃣ The first target is the 3295-3306 area. If it effectively falls below, continue to hold and look for a lower position.
3️⃣ The support below is focused on the 3295-3285 area, and the pressure above is still mainly 3335-3345. The market is mainly oscillating in the middle of the range. It is recommended to watch more and act less, and wait for key point signals before intervening.
If you are currently having trouble with gold operations, welcome to communicate with me. I will update the strategy as soon as possible according to the intraday market and try my best to make your investment less detours.

Analysis of gold price trend next week!Market news:
This week (June 2 to June 6), the spot gold market has become more volatile due to the interweaving of multiple factors. Spot gold prices fell more than 1% on Friday due to the impact of strong US employment data, but still recorded a 0.8% increase for the whole week, showing the game between safe-haven demand and the strengthening of the US dollar. The trade uncertainty caused by Trump's tariff policy, the continued increase in international gold holdings by global central banks, and the tense geopolitical situation provide support for London gold prices, while the solid US employment data pushed up US Treasury yields, weakened the Fed's expectations of rate cuts, and put pressure on international gold prices. The market continues to pay attention to geopolitical risks and trade uncertainties. Silver performed even better, hitting its highest level since 2012, and platinum and palladium also recorded weekly gains. The precious metals market as a whole was driven by speculative funds. The market's uncertainty about the Trump administration's steel and aluminum tariffs and fiscal policies has driven global central banks to increase their gold holdings. And the cautious attitude of Federal Reserve officials towards rate cuts is beneficial to long-term demand for gold. Next week, the US CPI data and the progress of trade negotiations will become the focus of the market. If inflationary pressure rises, it may further push up US bond yields and put pressure on gold prices; if the data is soft, it may rekindle expectations of interest rate cuts, which is good for gold. In addition, the progress of trade negotiations and geopolitical risks such as the conflict between Russia and Ukraine will continue to affect market sentiment.
Technical Review:
From the perspective of this week's market, the high-rise and fall-down trend continued, and the low point was refreshed. The signal that gold is heading towards an extremely weak pattern is getting stronger and stronger, and selling has the capital to pierce 3300. From a technical perspective, on the weekly chart, this week's high-rise and fall closed with an inverted head, and the MACD indicator showed signs of a dead cross downward at a high level. The current pattern is conducive to continued selling! On the daily chart, two consecutive negative lines on the daily chart caused the price to run below the short-term moving average, and led to a downward trend near the 10-day moving average of 3330. The 5-day moving average also followed closely at around 3355. In addition, the upward momentum of other periodic indicators weakened, and the MACD indicator showed a dead cross downward pattern, so the daily chart should tend to be short. However, one thing is worth noting, that is, after the gold price rebounded at 3307 on Friday, the middle track of the Bollinger Band has moved up, which means that the buying defense has been strengthened. Therefore, while the daily line is biased towards selling, we must also pay attention to the strength of the bulls' counterattack.
Next week's analysis:
Next week's operation suggestion is to maintain the idea of selling as the main idea, supplemented by buying at low prices. For the upper resistance, pay attention to the 3328-3330 area first, and then pay attention to the 3345-3350 area. The former is regarded as the key to selling and exploring the low point, or even breaking the middle track of the Bollinger Band at 3295, which is also the low point of this week. The latter is a strong defense for selling in the short-term shock trend! In other words, selling below 3330 can complete the touch of the low point or new low next week in the short term, while selling below 3350 is still expected to test the new low, but the time period will be extended. As for the support below, focus on 3280. It is expected that it will be close to or touched at the beginning of next week, but whether it can break directly needs to be judged according to the actual trend, so it is best to wait for it to touch or break once before taking more. The 1-hour moving average of gold has formed a dead cross downward, so gold still has downward momentum. After the 1-hour high box of gold oscillated, gold finally broke through the box downward, indicating that gold is better sold. Then the bottom of the gold box has now formed resistance, and the short-term 3333 line of gold has formed resistance to gold. If gold is under pressure at 3333 at the beginning of next week, then gold can continue to be sold.
Operation ideas:
Buy short-term gold at 3277-3280, stop loss at 3268, target at 3310-3330;
Sell short-term gold at 3330-3333, stop loss at 3342, target at 3300-3280;
Key points:
First support level: 3300, second support level: 3280, third support level: 3261
First resistance level: 3330, second resistance level: 3348, third resistance level: 3375

Accurately grasp the gold trend analysis next week📰 Impact of news:
1. The geopolitical situation is gradually deteriorating
2. Trump again calls on the Federal Reserve to cut interest rates
📈 Market analysis:
The current weekly moving average support for gold prices is roughly 3250-3260. If 3250-60 can be maintained, then gold may continue to maintain consolidation and wait for an opportunity to choose a trend. If it falls below 3250, then it can directly see the 3200 mark. If 3200 falls below again, then it will see 3100. In the short term, the first focus of the gold price below is 3315. As long as it stays above 3315, gold is still in a bullish trend. Secondly, pay attention to the 3280 line below. If it falls below 3280, the gold price will further test the support of 3260-3250. It is possible that gold will form a head and shoulders top structure on the daily chart next week. It may fall to 3250-60 at the beginning of the week to lure shorts into the market, and then stretch and rebound to around 3350 to form a shoulder position, and finally directly dive down to around 3150.
If you agree with this view, or have a better idea, please leave a message in the comment area. I look forward to hearing different voices.
OANDA:XAUUSD FX:XAUUSD FOREXCOM:XAUUSD FXOPEN:XAUUSD TVC:GOLD

With bulls and bears in a stalemate, where will gold go?Gold fell under pressure around 3384 in the early trading on Thursday, and then rebounded after falling to 3361. The highest in the European session reached around 3403, and then fell back due to resistance. The US session accelerated its decline, reaching a minimum of 3339, and then rebounded in the late trading, closing in the negative on the daily line. The daily trend continued to fluctuate in a positive and negative cycle. On Thursday, it rose and fell, closed in the negative and fell below the 5-day moving average.
Today, we will focus on the resistance position of 3405. Whether it can break through will determine the strength of the bulls in the future market. The risk of continuous negative daily lines cannot be ruled out. The support below is the key points of 3330 and 3300. The 4-hour fluctuation range is locked at 3385-3335. The fluctuation space in the Asian and European sessions is limited. It is recommended to sell high and buy low. For stable trading, it is recommended to go long in the 3340-3350 area. The overall bullish trend has not changed, and the impact of non-agricultural data is limited. It is expected that gold will most likely rise and fall. Remember not to chase the rise and sell the fall, and wait patiently for opportunities.
Steady trading, precise attack!
