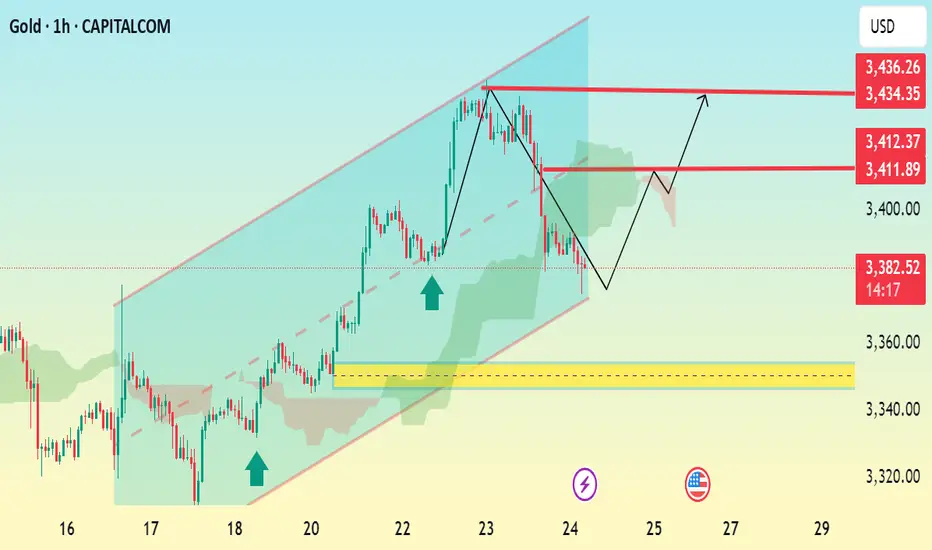
GOLD 1H Bullish Reversal AnalysisAnalysis Summary: Gold (XAU/USD) is currently trading at 3,383.75 and has shown a corrective move after reaching a recent high near 3,436.26. The chart indicates a bullish channel with support holding near the lower boundary of the channel.
Key Observations:
Price has pulled back sharply but respected the channel's lower trendline, suggesting a potential bullish reversal.
A bullish rebound is anticipated from the 3,360–3,370 zone, marked by the yellow support area.
Two key resistance levels are highlighted at 3,411.89 and 3,434.35.
The Ichimoku Cloud is thin ahead, suggesting less resistance for upward momentum.
Potential Trading Setup:
Entry Zone: Near 3,370–3,383 (support zone or on bullish confirmation).
TP1: 3,411
TP2: 3,434
SL: Below 3,360 (outside the channel and below yellow zone).
Goldprice
Some investors take profits. Opportunity to buy gold to 3500?✏️ OANDA:XAUUSD price correction of 50 appeared yesterday. This is obvious to happen in a sustainable uptrend. Today's strategy will look for liquidity sweeps to support to BUY to ATH 3500. Gold's current border zone is limited by the upper and lower trendlines. Be careful not to trade against the trend when breaking the trend zone.
📉 Key Levels
Support: 3375 -3363
Resistance: 3418-3431-3490
Buy trigger: Buyers react at 3375
Buy zone: 3363
Target: 3430; level higher at 3490
Leave your comments on the idea. I am happy to read your views.

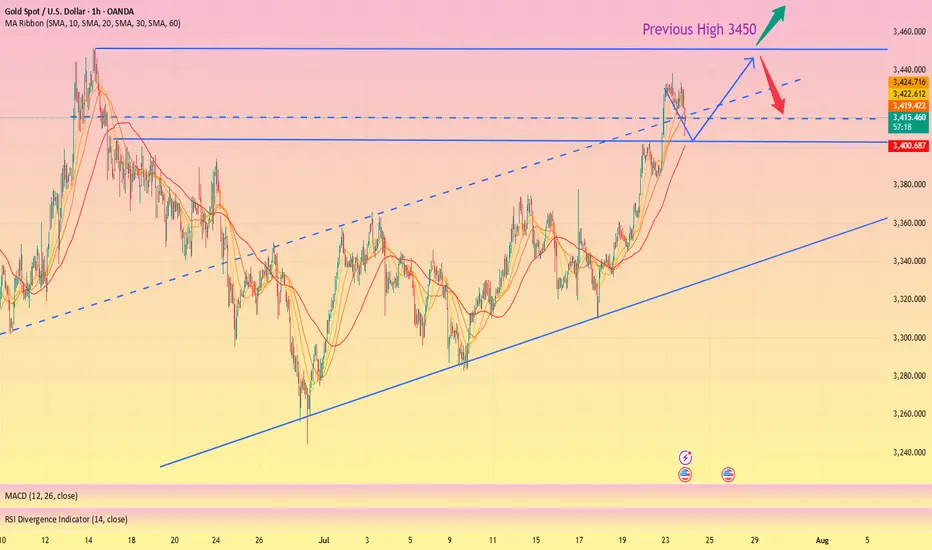
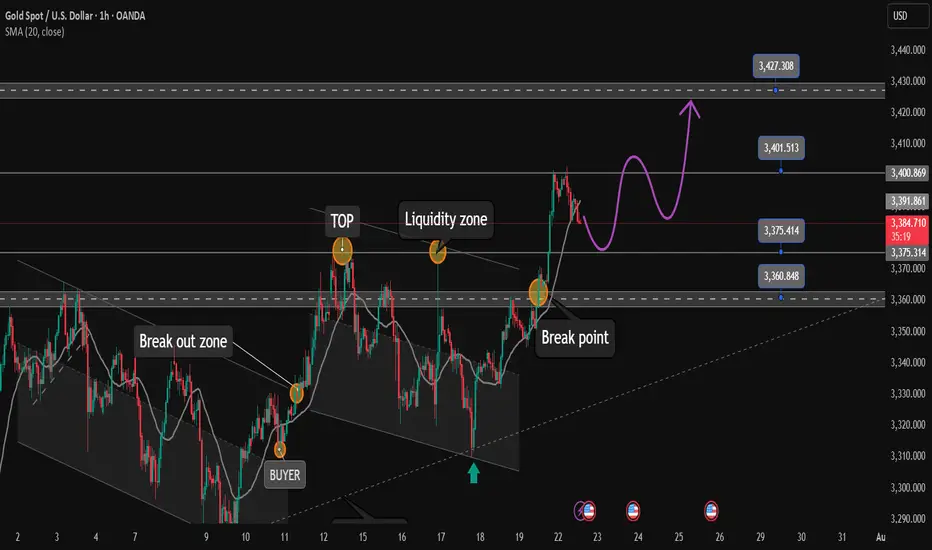
XAU/USD) Bullish trend analysis Read The captionSMC Trading point update
Technical analysis of Gold (XAU/USD) on the 1-hour timeframe. Here's a breakdown of the key trading
---
Technical Overview
Price: $3,428.71 (currently near the upper consolidation)
EMA 200: Around $3,367.38 (well below price, indicating strong uptrend)
Target Point: $3,468.52
Indicators:
RSI (14): 60.19–62.55 → shows moderate bullish momentum, not yet overbought.
---
Key Technical Elements
1. Bullish Breakout Structure:
Price has broken out of a previous range, and is forming a bullish flag or rectangle, which typically leads to continuation higher.
Measured move projection from previous leg (approx. $51.57 gain) targets the $3,468.52 level.
2. Strong Support Zones:
Two yellow zones highlighted:
Upper support level (around $3,415): acting as immediate structure support.
Lower key support (around $3,380): crucial structure level from where the trend initiated.
3. Trend Line Support:
A clearly marked ascending trend line supporting higher lows—indicating bulls are in control.
Expect price to stay above this trend line to maintain bullish bias.
4. Volume & RSI Confirmation:
RSI remains in a bullish zone but isn’t overbought → leaves room for upside.
Volume remains steady, confirming healthy consolidation.
Mr SMC Trading point
---
Conclusion & Trade Idea
Bias: Bullish
Entry Zone: On breakout or retest of minor support ($3,415–$3,420)
Stop Loss: Below trendline or below $3,415
Target: $3,468.52
Confirmation: Hold above trendline + RSI staying above 50
This is a classic bullish continuation setup supported by structure, RSI, and trend momentum. Traders could look for buying opportunities on minor dips or trendline retests.
---
Please support boost 🚀 this analysis)

Today's US market focus is 3350
Gold prices continued their decline from the previous session on Thursday, July 24, slipping further below the 3,400 mark as trade tensions eased and risk sentiment rose. Gold's decline today means a second consecutive day of decline as investors turned their attention to more positive trade progress since yesterday. However, gold still received buying support earlier this week, breaking through $3,400 at one point. This round of gains tested key resistance levels on the gold daily chart, but in the end the bears held their ground.
Risk data interpretation!
Investors are currently waiting for U.S. Purchasing Managers Index (PMI) data for new trading instructions. If any PMI index falls below 50.0, indicating a contraction in economic activity in related industries, the dollar may face pressure and help gold prices rise.
The market will also pay close attention to developments surrounding the ongoing discord between U.S. President Trump and Federal Reserve Chairman Powell. The White House announced Trump's schedule, and Trump will visit the Federal Reserve at 4 p.m. Eastern Time on Thursday.
Views on the trend of gold!
The trend of gold is directly reversed from that of Monday and Tuesday this week. At the beginning of this week, gold rose slowly and continuously without giving a chance to retrace, while today it retreated continuously and did not give a rebound. Does it look familiar? The trend is bearish and I want to short but I can't do it. In fact, we are still bullish in the morning today, and the watershed is actually at the 3375 line. After the frequent breakouts in the European session, it means that the current bulls are suppressed again.
And the K-line on the hourly line is more obvious. There is no positive line in the continuous negative retracement, so the weakness will continue. After all, the Asian session is weak today, and the European session is also continuously weak. The current market has reached the 3363 line, which is actually not far from our second support of 3350. So the US session needs to focus on this position. If the US session can hold, there is still hope for a rebound. Otherwise, it will fall continuously today!
Gold: Long around 3350, defend 3340, and target the 3385-93 line

Are you ready for the BUY BTCUSD signal?✏️ The pennant pattern is forming. After BTCUSD reached a new peak, the past 1 week, BTC price has been accumulating to form a bullish pennant pattern. This is a bullish continuation pattern that signals when breaking the upper boundary of the flag pattern.
📉 Key Levels
BUY Trigger: Break and trade above 199000
Target 128000
Leave your comments on the idea. I am happy to read your views.

The Myth of Gold Reversals – Why Traders Keep Catching the KnifeGold is a master of deception.
It shows a clean wick into a zone, but reacts just enough to pull in early buyers or sellers — then rips straight through their stops like they weren’t even there.
The reversal looked real and the candles seemed perfect.
But the move? It was never meant for them.
This isn’t bad luck, but traders who survive aren’t trying to guess, they are the ones reading the reaction after the trap.
Let’s break down how these traps happen — and how Smart Money actually operates when XAUUSD is loading a real move.
🟥 Sell Trap – The "Instant Short" Mistake
Price pushes up into a clear reaction zone — maybe an OB, maybe an imbalance, a FVG, or a gap.
Structure looks stretched. Traders recognize a premium zone and decide it’s time to short.
The trap? Jumping in immediately on the touch, with no confirmation.
This is where Gold loves to trap sellers.
No M15 CHoCH/ BOS on M5 or real liquidity swept. Just a blind move and hope.
Price often pulls slightly higher — sweeping internal liquidity, triggering SLs — then shows a real rejection.
📌 Here’s what needs to happen before selling:
• First: look for a liquidity sweep (equal highs or engineered inducement)
• Then: price must shift — CHoCH or BOS on M15 or M5
• Finally: confirmation via bearish engulf, imbalance fill, or break + retest
• For experts: M1 can offer refined sniper triggers with minimal drawdown
💡 If none of this appears, it’s not a setup — it’s a trap.
🟩 Buy Trap – The "Wick Bounce" Illusion
Price taps a demand zone — again, a refined OB or imbalance, liquidity zone.
A long bullish wick forms. Some candles pause. It looks like a reversal.
But there’s no shift.Just hovering.
Many jump in long the second they see the wick. And then price breaks straight through.
📌 Here’s how to flip this trap into a real buy:
• Let price sweep liquidity below the zone — signs of a purge - true wick bounce
• Watch for a CHoCH or BOS on M15, M5, or even M1
• Look for a strong bullish engulf from the reactive level
• Confirm via imbalance fill or price reclaiming broken structure
📍 If all that happens — the trap becomes your entry.
If not? Stand down.
📊 What Smart Traders Actually Do Differently
They don’t chase wicks.
And never enter just because price tapped a line.
IT IS ALL ABOUT READING STRUCTURE AND PRICE ACTION.
Here’s how:
• Mark the highest probability reaction zones — above and below current price;
• Set alerts, not blind entries;
• Wait for price to come into their zone and then watch what it does there;
• Look for confirmation: CHoCHs, BOS, engulfing candles, FVG fills, clean rejections;
• And always keep one eye on the news — because Gold reacts fast and violently when volatility hits.
• Repeat this work daily until they learn how to recognize signs faster and more secure.
That’s the difference between chasing the reversal… and trading the move after the trap.
Because in this game, patience isn’t just a virtue — it’s survival.
And Gold? Well, XAUUSD has no mercy for those in a hurry and not studying its moves day by day, month after month and so on. Learn structure and price action even if you join any channel for help if you are serious about trading this amazing metal.
If this lesson helped you today and brought you more clarity:
Drop a 🚀 and follow us✅ for more trading ideas and trading psychology.
Gold safe-haven retreat? It will continue to rise!
Why did gold return to 3,400? Reasons explained!
1 As investors continue to focus on US President Trump's August 1 tariff deadline, trade uncertainty and weaker US Treasury yields have pushed gold prices to a five-week high. At the same time, trade uncertainty is also triggering some safe-haven demand.
2 At the same time, investors are also preparing for the Federal Reserve meeting next week. Although the Fed is expected to keep interest rates unchanged, the market expects that the Fed may cut interest rates in October. Gold is traditionally seen as a hedge tool in uncertain times and tends to perform well in a low-interest rate environment.
Views on today's gold trend!
After two consecutive days of rising this week, the sentiment of gold bulls has basically been ignited. There has been basically no obvious retracement in the past few days. Either it is a slow rise in a row, or it is a direct acceleration of the rise after sideways fluctuations. After the first wave of highs at the opening today, the market is still at a rising node!
The watershed of the retracement on the hourly chart is still the break point of 3403, but it is too far from our current position to enter the market at this position. In addition, the current continuous rise of gold and the turning of the moving average have made the market bulls more aggressive, which means that the previous short-term downward trend has ended. The point of today's retracement layout can focus on the vicinity of 3412!
Gold: Long near 3411, defend below 3403, and target 3440-50!

Trend corrected, long funds reduced, sellers returned#XAUUSD
The current moving average is still spreading downward, and the 4-hour chart closed with a large negative line. The market has not yet given a clear feedback on the current trend. However, after a large amount of buying funds intervened, the gold price hit a high of around 3377 and then stagnated. The short-term bullish momentum has weakened, and there is a certain risk of a correction and decline. Sellers are beginning to return📉.
Currently, you can consider participating in short selling at 3370-3377💡. If it rebounds directly to 3400-3405, you can still short if it does not break🔍. The target is 3360 below, and 3350 or even 3330 if it breaks🎯.
🚀 SELL 3370-3377
🚀 TP 3360-3350
After reaching FULL TP. Relax and wait for strong support zone✏️Continuing yesterday's bullish wave structure, Gold has reached the Target level of 3400. In the European session, there is a possibility of a correction to some important support zones. And the US session will continue to aim for a level higher than 3400. Today's strategy is still quite similar to yesterday's strategy when waiting for the areas where buyers confirm to enter the market to FOMO according to the main trend.
📉 Key Levels
Support: 3375 - 3363
Resistance: 3400-3427
Buy Trigger: Rejects the support zone 3375 and reacts to the upside
Buy Trigger: Rebound from 3363
BUY DCA: Break and trading above 3400
Target 3427
Leave your comments on the idea. I am happy to read your views.
Gold Price Analysis July 24After a correction of about 50 prices in yesterday's session, gold is showing a necessary "breathing" in the long-term uptrend. This is a positive signal, showing that the market is accumulating before continuing its journey towards a new ATH around the 3500 area.
Currently, gold prices are fluctuating within the boundary zone limited by two upper/lower trendlines - creating a clear structure of support and resistance. Avoid trading against the trend if this boundary zone is broken.
📌 Trading plan:
Strategy: Prioritize BUY when price sweeps to support zone
Active buy zone: 3375 (reaction price)
Potential buy zone: 3363 (deep support)
Target: 3431 in the immediate future → further towards 3490
Support: 3375 – 3363
Resistance: 3418 – 3431 – 3490
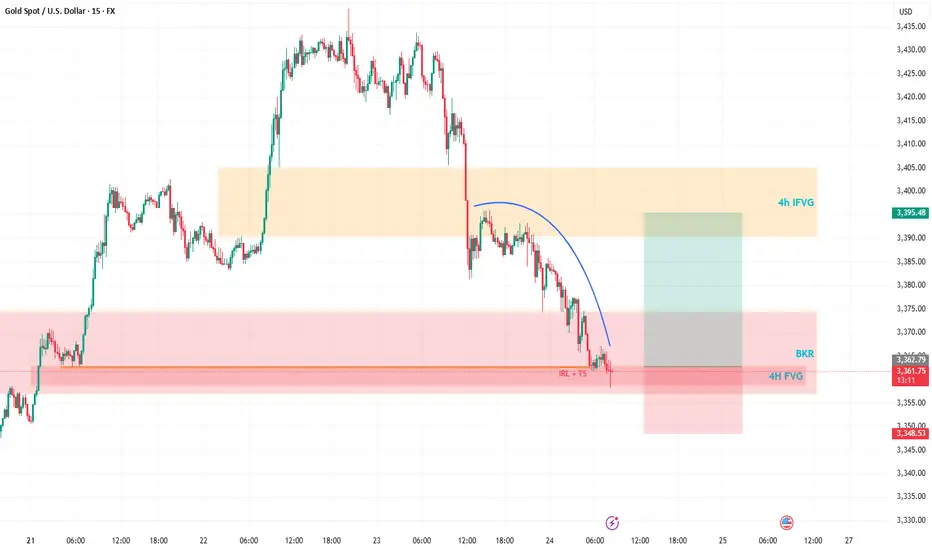
Gold’s Wild Ride: A Trader’s Take on What’s NextHey Fellow Traders! 👋
Gold’s been an absolute beast this week, smashing through both buyers and sellers like it’s playing a high-stakes game of market whack-a-mole! 😅 After Wednesday’s wild moves and today’s follow-up, Gold’s keeping us all guessing.
Right now, I’m not locking in a long-term bias—Gold’s too unpredictable for that. But here’s the exciting part: I’m eyeing a short-term long opportunity. Why? The price just dipped into a 4H Fair Value Gap (FVG) and tagged a Breaker, setting up a potential bounce. 📈
My plan? I’m expecting Gold to sweep up the highlighted liquidity and charge toward the 4H Inversion Fair Value Gap (IFVG). Once it hits that zone, I’ll be glued to the charts, watching for its reaction to decide the next move. 🧐
As always, trade smart! Set your stops, size your positions wisely, and don’t let Gold’s volatility catch you off guard. Protect your capital first—always! 💡
What’s your take on Gold right now? Are you jumping on this setup or waiting for more confirmation? Drop your thoughts in the comments below, give this post a like, and follow for more updates! 👇 Let’s keep the trading convo going! 🔥
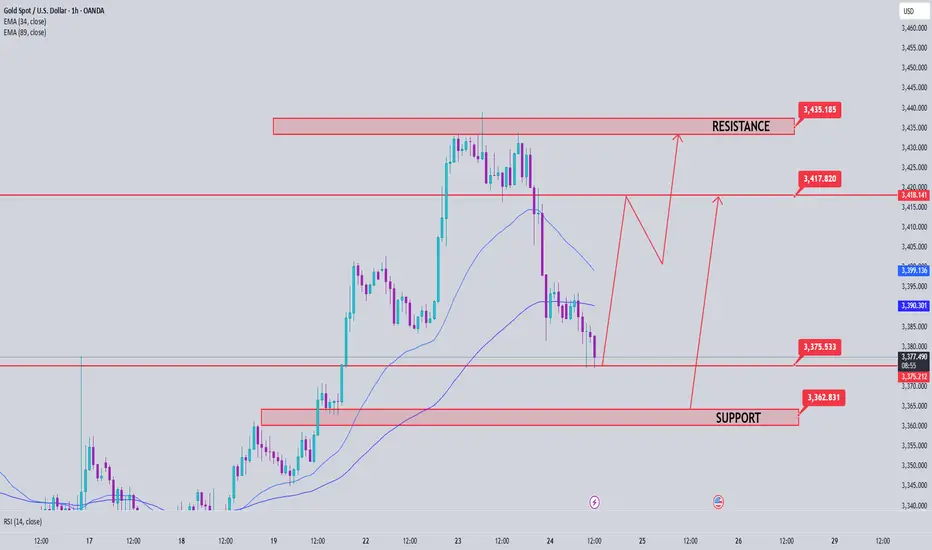
Gold Bounces Back After Testing Key Support📊 Market Drivers
• Gold dropped to around $3,352, touching a key support zone, then quickly rebounded to $3,373, gaining over +20 points.
• The rebound is supported by continued weakness in the US Dollar and slight easing in Treasury yields, keeping gold attractive as a safe haven.
• Although some optimism around US-Japan trade negotiations slightly reduced risk aversion, it wasn’t enough to push gold below support.
📉 Technical Analysis
• Key Resistance:
o $3,397 – $3,400: psychological resistance and near the next bullish breakout zone.
o If breached, next target lies around $3,420–3,445.
• Nearest Support:
o $3,356 – $3,364: recently confirmed support zone that triggered the current rebound.
o Deeper support at $3,326 – $3,320 if the rebound fails.
• EMA (EMA50):
o Price remains above the 50-period EMA, indicating bullish momentum in the short term.
• Patterns & Momentum:
o Market structure shows a "rising low" pattern — a bullish signal that buyers are stepping in at higher levels.
o RSI was briefly in oversold territory and now supports a recovery bounce.
o If $3,356 holds, the upside targets remain valid toward $3,397 → $3,439.
📌 Assessment
• Gold has confirmed strong support at $3,356–3,364, with the rebound from $3,352 as proof.
• Short-term uptrend remains intact, unless the USD strengthens sharply or unexpected macro news hits.
• If gold breaks below $3,356, it may retrace toward $3,326–3,320, but the upside potential is currently favored.
💡 Suggested Trade Setups
BUY XAU/USD: $3,356–3,364
🎯 Take Profit: 40/80/200 pips
❌ Stop Loss: $3,346
SELL XAU/USD: $3,397–3,400
🎯 Take Profit: 40/80/200 pips
❌ Stop Loss: $3,407

Long and short battles to seize the opportunity to enter the mar
Yesterday, the technical aspect of gold formed a high and pierced the 3430 mark, then fell under pressure and fluctuated downward. The US market repeatedly fluctuated and suppressed the operation at the 3420 mark and further fell downward. The gold price accelerated downward to break through the 3400 mark and continued to fall back to around 3380 and then rebounded and closed in a volatile market. The daily K-line closed with a suppressed and adjusted mid-yin. After three consecutive trading days of rebound and upward breaking, the overall gold price finally ushered in a suppressed and adjusted closing in the negative. The daily level fell below the 5-day moving average support, but it was still above the 10-day moving average and the 20-day moving average to form a bullish strong oscillation pattern. The bullish upward pattern has not been destroyed. If your current trading is not ideal, I hope Yulia can make your investment smoother. Welcome to communicate!
From the analysis of the 4-hour line, today's support is at 3376-80. If the daily line stabilizes above this position, it is expected to rebound further. The upper short-term resistance is at 3397-3400. If this position is touched for the first time during the day, short selling can be seen once the shock falls. The overall bullish strong dividing line is at 3370. If the daily line stabilizes above this position, the rhythm of falling back to low and long remains unchanged. Short selling can only enter the market at key points, and fast in and out without fighting.
Gold operation strategy:
Gold falls back to 3370-75 line to buy, stop loss 3360, target 3397-3400 line, break and continue to hold;

Gold------sell near 3392, target 3370-3350Gold market analysis:
Yesterday, gold in the European and American markets plunged directly. It is cold at high places. Gold has already experienced four big plunges above 3435. From the perspective of form, there is a super pressure there. We also reminded in the analysis yesterday that the rhythm of gold daily lines in the past two days has changed very quickly, and it is all shocks and then quickly pulls up and ends directly. It is basically difficult to follow its rhythm without direct pursuit. The big negative line of the daily line has destroyed the strong support near 3402-3404. This position has been converted into a new strong pressure. Today's idea is to adjust the bearish trend and continue to sell on the rebound. The adjustment of the daily line is not sure whether it is an adjustment of the wave structure, but it can be determined to sell in the short term. We are just a trend follower. Today, gold will not rebound above 3402 and is basically weak.
Gold plunged directly in the Asian session, and the selling force is still relatively strong. At present, the new low strong support of the daily line has not appeared. The next moving average support of the daily line is around 3366. I estimate that there will be a rebound at this position. If the hourly Asian session does not fall and rebounds first, consider continuing to sell it at 3395 and 3402. Gold likes to convert quickly recently. If it stands on 3404, it will be reconsidered.
Support 3374, 3366 and 3350, suppress 3395 and 3402, and the weak watershed before the market is 3395.
Fundamental analysis:
Tariffs have not affected the market recently, and there is no major news released. The market is relatively calm.
Operation suggestion:
Gold------sell near 3392, target 3370-3350

Xau/Usd - Gold turn to Bull runGold time to Long..
buy 3364
SL 3361
TP 3377
Xau/Usd Bull Run started

Gold peaked in the short term. Welcome a new trend?The previous rising structure of gold was broken, especially yesterday's rapid decline broke through the previous support of 3385. Although it rebounded slightly, it was difficult to change the adjustment. Yesterday's high point of the US market was at 3396-98 US dollars. Today, the adjustment trend continued. The dividing point between long and short is 3395 US dollars today. Before the price reaches here, do not consider long.
Many traders are confused. Why are there longs one day and shorts the next day? In fact, this is the characteristic of the volatile market. Breaking the key position cannot last. No matter what you think about the market, you must pay attention to the current shape changes. In the volatile market, you should consider the market of the day more, not the long-term direction.
From the 1-hour chart, the gold price rebounded near 3390 and shorted, and the profit range is 3370-3350.
The backup strategy is to break through 3400 and go long, and pay attention to 3415-3425 on the upside.
In other words, look for opportunities to short on a rebound below 3400 today, and adjust your thinking after breaking through the key resistance.
XAU/USD Chart Analysis: Bulls Break Important ResistanceXAU/USD Chart Analysis: Bulls Break Important Resistance
When analysing the XAU/USD chart last week, we:
→ noted that the ADX indicator had reached its lowest level since the beginning of 2025 – a clear sign of declining gold price volatility;
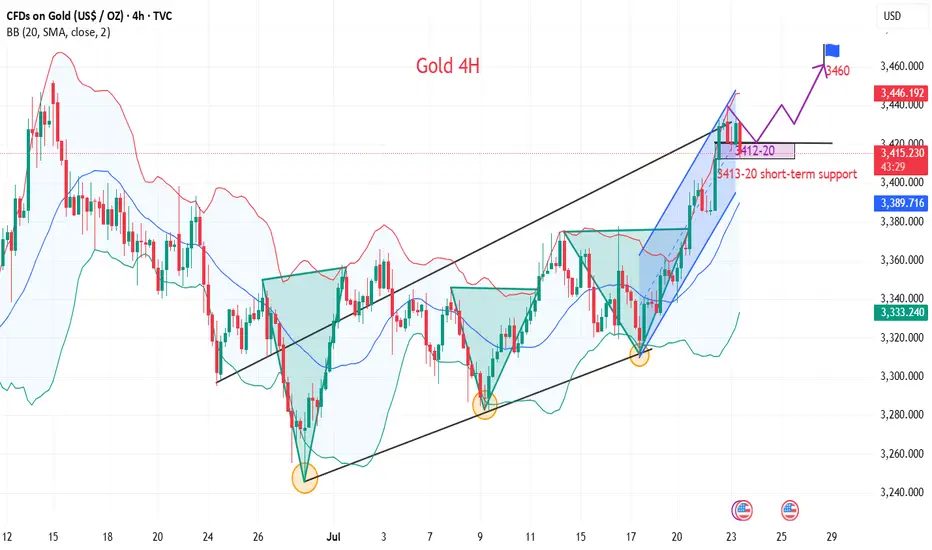
→ highlighted the formation of a large-scale triangle with its axis around the $3,333 level, bounded by a resistance line (marked in red) and the lower boundary of the ascending channel.
Since then, the price has climbed above $3,400 – reaching its highest level since mid-June. According to media reports, the uptick in demand may be driven by escalating geopolitical risks, renewed optimism regarding potential monetary policy easing in the US, and consistent gold buying from central banks.
This suggests that the balance has shifted in favour of the bulls, who have made an attempt to break through the resistance line – an attempt that, so far, appears promising and points towards a potential resumption of the upward trend.
However, today's XAU/USD chart shows that the bulls are now facing a key resistance level at $3,440 – a level that has reversed gold prices downward both in May and June. What will happen in July?
It is possible that, following a prolonged consolidation near the lower boundary of the channel, the bulls have built up sufficient momentum to finally break through this critical level and push gold prices towards line Q, which divides the lower half of the long-term channel into two quarters.
This article represents the opinion of the Companies operating under the FXOpen brand only. It is not to be construed as an offer, solicitation, or recommendation with respect to products and services provided by the Companies operating under the FXOpen brand, nor is it to be considered financial advice.

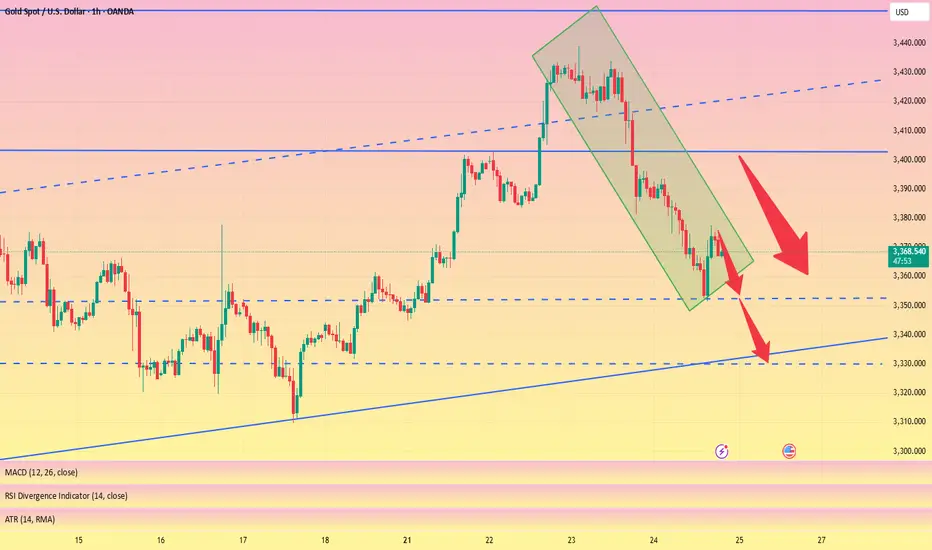
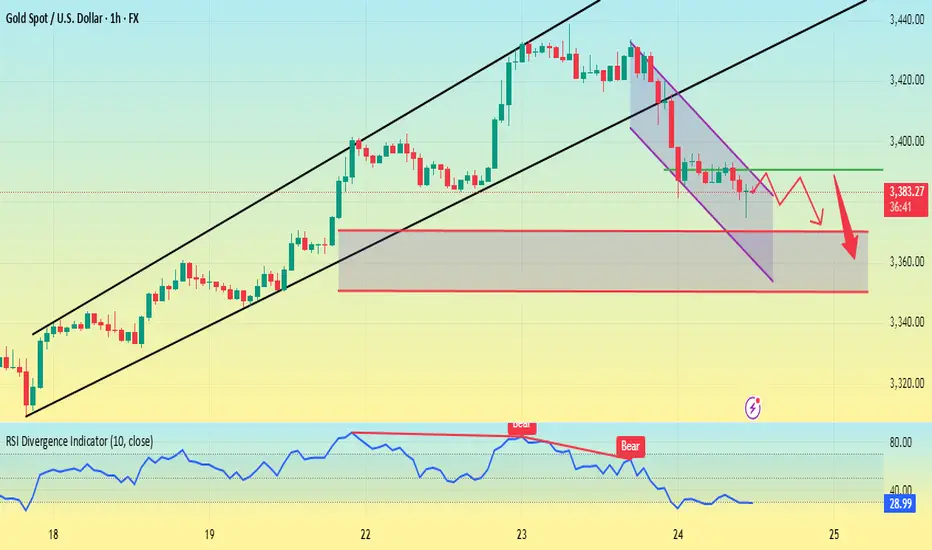
XAUUSD 24/07 Bullish Reversal Potential from Falling Channel1. Price Overview & Trendline Context
Gold (XAUUSD) is currently trading around 3,369.67 USD after a notable pullback from the recent high near 3,428. A clear descending channel has formed, marking a short-term corrective move within a larger bullish trend. Price action suggests a potential reversal setup as price approaches a strong support zone around 3,340 – 3,350 USD, previously acted as demand in the breakout on July 22.
2. Fibonacci & Structure Analysis
The Fibonacci retracement drawn from the recent swing low to the top at ~3,428 reveals that the pullback has reached the 0.9 level, often seen as an exhaustion point for corrections in strong bullish trends. This area aligns with:
Key horizontal support: 3,340 – 3,350
Previous breakout zone
Volume spike at base (20.6K vs avg.)
This convergence suggests a high-probability bullish reversal setup.
3. EMA & Momentum Indicators
Although the chart primarily uses SMA 9, the structure suggests price is extended from shorter EMAs. A break above the upper boundary of the falling channel may trigger EMA crossovers, further confirming reversal momentum.
4. Trading Strategy Suggestion
Setup
Description
Buy Zone: 3,350 – 3,365 USD
Take Profit 1: 3,385 USD (short-term supply zone)
Take Profit 2: 3,428 USD (recent swing high)
Stop Loss: Below 3,340 USD
This trade follows the "Buy the Dip in Uptrend" strategy, aligning with trendline, fib support, and volume confirmation.
5. Key Resistance & Support Levels
Resistance: 3,385 – 3,428 USD
Support: 3,340 – 3,350 USD
Breakout Confirmation Level: 3,375 (channel breakout)
6. Final Insights
Gold remains in a broader bullish structure. Today’s chart shows strong technical confluence for a short-term reversal. Traders should monitor closely for breakout candles from the falling wedge/channel, preferably with volume confirmation.

Gold is weak. Will it continue to fall?Yesterday, the price of gold did not continue to rise as strong as in the previous two days. After reaching the previous top position, it began to retreat under pressure.
The market is too bullish, and under this pattern, the market is likely to have an unexpected reversal. Yesterday, it fell below the 3400 integer mark, so it is likely to maintain a volatile downward trend in the future.
The current main support level is around 3370, which is also the primary point for the bears to continue to break down in the future. Once it falls below this position, the target may be around 3345-3355. It cannot be said that it has completely turned to a bearish position at the moment. It is just a bearish oscillation pattern within a large range, and the upper pressure is maintained near 3405, which is also the support point for the first downward step of the bears on Wednesday.
Today, we still need to operate around the short position first. The price rebounds to 3405 and shorts, and the profit range is around 3390-3380, and the stop loss is 3415.
After a new low appears in the European session, wait for the US session to rebound and continue shorting.

The real target of gold is more than 3400
💡Message Strategy
The United States has recently made frequent moves in global tariff policies. Treasury Secretary Bensont has clearly set August 1 as a hard deadline for tariff negotiations among countries. At present, EU trade negotiations have been decoupled from the issue of sanctions against Russia and Ukraine, while Japan's negotiations are progressing smoothly.
These dynamics reflect that the United States is reshaping the global trade pattern through differentiated strategies, and countries are forced to adjust their economic and trade policies under the pressure of tariffs. As the deadline approaches, gold is facing a test of long and short positions.
The White House's pressure on the Federal Reserve is still fermenting. The US Treasury Secretary said that the Federal Reserve should cut interest rates now, but at the same time said that there is no sign that Powell should resign now. If he wants to leave early, he should do so. Powell gave a public speech yesterday, but to the disappointment of the market, he did not mention monetary policy and the possibility of resignation. However, Trump's pressure on the Federal Reserve has taken effect, and the market has turned its attention to interest rate cuts.
📊Technical aspects
Yesterday, Tuesday, we believed that the trade negotiations between Europe and the United States were on the verge of breaking down, which led to a rise in risk aversion in the market, boosted gold safe-haven buying, and supported the price of gold to a one-month high.
Therefore, we suggest that you take a bullish approach in terms of operation. Pay attention to the support below at $3,380, and pay attention to the breakthrough of $3,402 above. As expected, it broke through to $3,440, reaching our expected profit target.
From the 4H trend structure, gold has been climbing rapidly along the upward channel recently. It broke through yesterday and took the 3400 mark in one fell swoop, reaching our expected target of 3440. At present, gold is blocked and falls back on the channel boundary support.
At the same time, the 1-hour RSI broke through the upward trend line support and tested the resistance again, releasing a callback signal in the short term. It is necessary to pay attention to the possibility of short-term adjustments. Today, we can focus on the key resistance around 3415 and try long opportunities.
💰Strategy Package
Long Position:3410-3420,SL:3390,Target: 3440,3460
Gold Pulls Back to Support Zone📊 Market Overview:
• Gold price fell sharply to $3,385/oz, after previously testing the $3,430 zone.
• Short-term profit-taking and anticipation of upcoming U.S. economic data (PMI, durable goods orders) caused a mild USD rebound, pressuring gold lower.
• Overall sentiment remains cautious as the Fed has yet to clearly signal a rate cut path.
📉 Technical Analysis:
• Key Resistance: $3,430 – $3,445
• Nearest Support: $3,382 – $3,368
• EMA 09: Price just broke below the 9 EMA, suggesting a potential deeper correction unless it rebounds quickly.
• Candlestick/Volume/Momentum: Bearish engulfing candle with rising volume – indicates strong selling pressure and momentum currently favoring the bears.
📌 Outlook:
Gold is undergoing a short-term correction, currently testing the strong technical support zone at $3,382 – $3,385. If this zone holds, we may see a rebound toward $3,410 – $3,420. If it fails, gold could slide further toward $3,368 – $3,350.
💡 Suggested Trade Strategies:
🔻 SELL XAU/USD at: 3,395 – 3,400
🎯 TP: 3,375
❌ SL: 3,405

XAU/USD) breakout analysis Read The captionSMC Trading point update
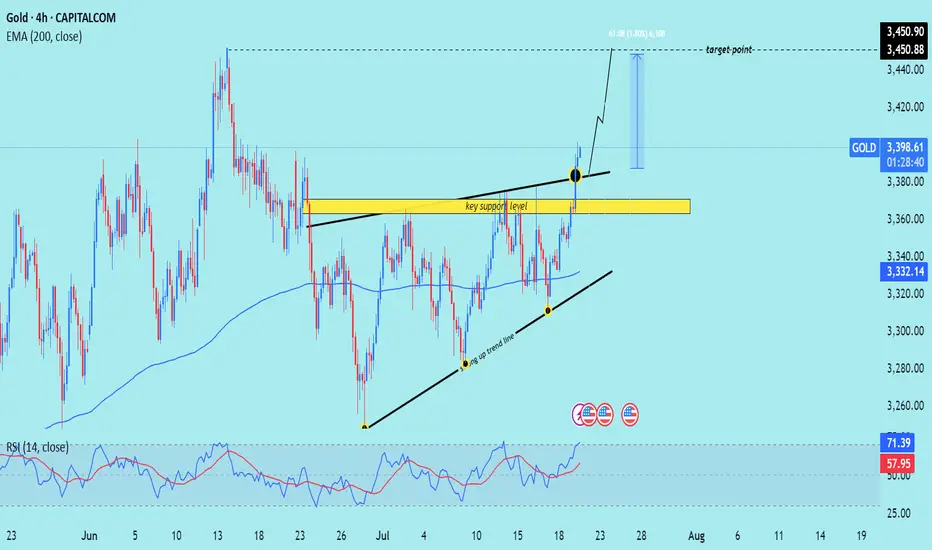
Technical analysis of (XAU/USD) on the 4-hour timeframe, highlighting a move toward the $3,450 target. Here's the full technical breakdown
---
Technical Analysis – Gold (4H)
1. Breakout from Resistance Zone
Price has broken above a key horizontal resistance level (now turned support, marked in yellow).
The breakout is confirmed by a strong bullish candle with momentum, suggesting buyers are in control.
2. Ascending Triangle Formation
Price formed an ascending triangle, a classic bullish continuation pattern.
The breakout above the upper boundary confirms the pattern, projecting a potential measured move.
3. Trendline Support & Higher Lows
The structure shows a rising trendline (black), where price bounced multiple times — confirming a higher low sequence.
The confluence of trendline support + breakout level adds strength to the bullish case.
4. 200 EMA Confluence
The 200-period EMA (3,332.13) has been acting as a dynamic support throughout.
Price retested it earlier in the move, then surged upward — validating trend continuation.
5. RSI Indicator
RSI is at 71.13, entering overbought territory.
This implies strong bullish momentum, but a short-term pullback to retest the breakout level is possible.
6. Target Projection
Target Point: $3,450.90, calculated from the height of the triangle (~61 pts or 1.80%) added above the breakout zone.
A retest of the breakout area (yellow zone) around $3,370–$3,380 could offer a better entry before continuation.
Mr SMC Trading point
---
Summary
Bias: Bullish
Current Price: $3,397.62
Support: $3,370–$3,380 zone (previous resistance turned support)
Trend: Higher lows + breakout above resistance
EMA Support: 200 EMA at $3,332.13
Target: $3,450.90
RSI: 71.13 – bullish but near overbought
Please support boost 🚀 this analysis)
Perfect profit on short position, long TP 3450#XAUUSD
Gold is in an upward trend from the daily chart. From the technical indicators, the SMA5-SMA10 moving averages are golden crosses, BOLL opens upward, the K line runs on the upper track of the daily Bollinger Band, and the MACD continues to increase, indicating that the bullish trend remains unchanged📈.
The approaching August 1st tariff deadline, coupled with uncertainties such as the Federal Reserve, provide short-term support for gold🔍.
📊The current lower support is at 3410-3400. If it falls back to this level during the day, you can consider going long. Gradually check 3430 and 3440 on the upside, and pay close attention to the breakthrough of the 3450 level🏅. If it effectively breaks through 3450, gold is expected to break through the historical high. If it encounters resistance near 3450 as in the previous trend, you can consider shorting📉.
🚀BUY 3410-3400
🚀TP 3430-3440