GOLD TODAYHello friends🙌
🔊Due to the weakness of buyers and the strength of sellers, the price continues to fall...
We have identified two supports for you that will not be seen if the price continues to fall, and if the selling pressure increases, we will update you.
🔥Join us for more signals🔥
*Trade safely with us*
Goldprice

Gold: update hello friends✋️
According to the recent growth of gold, you can see that it is constantly resisting and forming a falling pattern.
For this reason, it can be a warning that the fall can continue and the price will fall to the specified limits.
🔥Follow us for more signals🔥
*Trade safely with us*

Gold rebounded from the bottom. Is the decline over?Gold prices faced selling pressure in today's Asian market. The price fell from 3343 to around 3320 in the early Asian session. The European price continued to fall, reaching a low of around 3296, and then rebounded upward. The current price is fluctuating around 3320.
Most investors will focus on the minutes of the Federal Open Market Committee (FOMC) meeting to be released on Wednesday to get guidance on the trend.
From the hourly chart, the upper pressure position is constantly being corrected. The current average pressure value is around 3330-3335. At the same time, this position is also the watershed between long and short positions in the previous dense area. The price may rebound to this position again. The lower support level is in the range of 3300-3290.
Quaid believes that the current market is still showing a downward trend, and the price may fall back below 3300 again.
Operation strategy:
Short around 3330, stop loss 3340, profit range 3310-3300, sustainable ownership after breakthrough.

XAUUSD:Go long
Gold prices fell back in Asian trading on Monday, as they digested Friday's negative data. The short term may be partial shock, but the medium and long term news surface uncertainty or to provide support for gold prices, so trading ideas, retracement to do long can.
Trading Strategy:
Both 3300 and 3308 can be used to enter the long position, short-term traders can look at 3325-30, followed by 50 around.
For intermediate traders, the target sees 3365-70 unchanged, and the retracting of 3300/3310/3330 is an opportunity to go long.
More detailed strategies and trading will be notified here ↗↗↗
Keep updated, come to "get" ↗↗↗
Bearish pressure below 3,300 at the start of the week
📌 Driving Events
Gold prices (XAU/USD) faced renewed selling pressure in early Asian trading on Monday, falling to the $3,320 level. Gold's pullback came as stronger-than-expected U.S. nonfarm payrolls data for June reshaped market expectations for the Federal Reserve's (Fed) policy path. Investors are now turning their attention to the Federal Open Market Committee minutes, which will be released on Wednesday, for further guidance.
The U.S. added 147,000 jobs in June, better than expected and slightly higher than the revised 144,000 in May. Meanwhile, the unemployment rate remained stable at 4.1%. These data reinforce the view that the labor market remains resilient, reducing the likelihood of an imminent rate cut by the Federal Reserve. As a result, the U.S. dollar strengthened, weighing on non-yielding assets such as gold.
📊Comment Analysis
The decline at the beginning of the week, gold prices give up accumulation below 3300
💰Strategy Package
⭐️Set gold price:
🔥Sell gold area: 3337-3339 SL 3344
TP1: $3328
TP2: $3312
TP3: $3300
🔥Buy gold area: $3297-$3295 SL $3290
TP1: $3308
TP2: $3320
TP3: $3330
⭐️ Note: Labaron hopes that traders can properly manage their funds
- Choose the number of lots that matches your funds
- Profit is 4-7% of the fund account
- Stop loss is 1-3% of the fund account
Gold fluctuates, beware of rebound caused by new tariffs📊 Gold Day Trading Strategy (Recommendation index ⭐️⭐️⭐️⭐️⭐️)
📰 News information:
1. 90-day tariffs are about to expire
2. New unilateral tariffs
3. Geopolitical situation
📈 Technical Analysis:
As I said this morning, shorting gold is divided into two times, the first time is near 3324, and the second time is at 3340 or 3345. If there is a short-term retracement after breaking through 24, you can follow up with a long order to look at 3335-3340. If gold is in a very weak state, you can consider shorting near 3315 and look at 3300. Because during the European session, 3300 has strong support, and the European session repeatedly tests this support. If it falls below 3300, we will go to 3295-3285, or even 3250. But at the same time, we need to pay attention to the rebound of gold that may be caused by tariff policies and geopolitical situations.
🎯 Trading Points:
SELL 3315-3325-3335
TP 3305-3295-3285
BUY 3290-3285
TP 3300-3310-3320
In addition to investment, life also includes poetry, distant places, and Allen. Facing the market is actually facing yourself, correcting your shortcomings, facing your mistakes, and being strict with yourself. I share free trading strategies and analysis ideas every day for reference by brothers. I hope my analysis can help you.
TVC:GOLD OANDA:XAUUSD FX:XAUUSD FOREXCOM:XAUUSD PEPPERSTONE:XAUUSD FXOPEN:XAUUSD

Gold is adjusting downward, don't blindly chase the short positi
Today, gold is in a consolidation and downward trend. As of now, the lowest price has reached around 3296, and it is still consolidating around 3300.
From the current point of view, gold is indeed in a bearish trend.
However, don't chase orders, this is very dangerous.
Because from the hourly chart, although the low point of gold is constantly refreshing, the key hourly chart support range position has not yet broken.
So, here I may think that gold may still be tempting to short in the short term.
There is still a possibility of a pullback on the hourly chart.
From the current point of view, before the range is broken, there is still a probability of a pullback to 3320-30.
So, in the next operation, I suggest that you can pay attention to 3320-30.
But there is no guarantee that it will definitely pull back, because it is indeed in a bearish trend now, and it may also go down directly.
However, if it does rebound again, as long as it does not stabilize at 3330 again.
Then, we can short at 3320-30.
On the contrary, if the rebound breaks directly above 3340, then be careful.
The rebound may turn into a reversal, and it is very likely to replicate the rhythm at the beginning of last week.

Gold short-term shock operation ideas
💡Message Strategy
Current Price and Context
Gold is trading around $3,310 and continues to retreat as traders remain cautious amid heightened macroeconomic uncertainty. While some safe-haven demand remains, a stronger dollar and weakening confidence among safe-haven buyers put gold under selling pressure. Concerns about global trade policy and tightening monetary policy continue to weigh on gold's short-term outlook.
Key Drivers
Geopolitical Risks: Trade tensions and global uncertainty have again sparked cautious sentiment, which has provided limited support for gold, but the absence of major conflicts has left it lacking direction.
U.S. Economic Data: Strong labor market data and upcoming inflation data supported the dollar, curbing gold's upward momentum.
FOMC Outcomes: The Fed remains cautious and does not signal an immediate rate cut; high yields reduce the appeal of non-interest-bearing assets such as gold.
Trade Policy: While tariffs have been a concern, flows between risk and safe-haven assets have been mixed as there has been no new escalation.
Monetary policy: Rising global bond yields and the Federal Reserve's wait-and-see attitude limit gold's gains in the short term.
📊Technical aspects
From the 4-hour analysis, the support line of 3290-3300 is concerned below, the short-term resistance above is concerned about 3315, and the suppression line of 3345-50 is focused on. The overall main tone of high-altitude low-multiple cycle participation remains unchanged. In the middle position, watch more and do less, and follow orders cautiously, and maintain the main tone of participation in the trend. Wait patiently for key points to participate. Pay attention to the specific operation strategy in time.
💰Strategy Package
Long Position:3290-3300,SL:3275,Target: 3330-3340
Short Position:3320-3330,SL:3305,Target: 3280-3290
NFP continues to ferment, short-term trend dominated by bears📰 News information:
1. 90-day tariffs are about to expire
2. New unilateral tariffs
3. Geopolitical situation
📈 Technical Analysis:
Good morning, bros. From a technical point of view, the overall trend of the daily line is a head and shoulders top. If the bulls do not recover 3360, the bears will still be the medium-term trend. The 4H MACD indicator is dead cross running. The best position for the day to deploy the short position again is 3330-3335, and the 1H chart keeps testing the 3305 first-line support, which may be broken in the short term. At present, 3295-3285 below is a relatively important short-term support. Once it falls below, it is expected to reach 3250, which is also the point I repeatedly emphasized in the morning. The intraday operation suggestion is to rebound shorting as the main, and to go long at lows as the auxiliary. Pay attention to the 3325-3335 support area on the upper side and the 3295-3285 support on the lower side.
🎯 Trading Points:
SELL 3325-3335
TP 3315-3305-3295
BUY 3295-3285
TP 3305-3315-3325
In addition to investment, life also includes poetry, distant places, and Allen. Facing the market is actually facing yourself, correcting your shortcomings, confronting your mistakes, and strictly disciplining yourself. I hope my analysis can help you🌐.
FXOPEN:XAUUSD PEPPERSTONE:XAUUSD FOREXCOM:XAUUSD FX:XAUUSD OANDA:XAUUSD TVC:GOLD

Gold fluctuates downward. Do not short blindly.Today, gold is in a consolidation downward trend, with the lowest point reaching around 3296; it has rebounded slightly to around 3310. From the overall market, gold is indeed in a short trend. However, do not continue to short, which is very dangerous.
Because from the hourly chart, although the low point of gold is constantly refreshing, the key hourly chart support range position has not yet broken.
So, here I may think that gold may still be tempting to short in the short term. There is still a possibility of a pullback here on the hourly chart. From the current point of view, there is still a probability of a pullback to 3320-30 before the range is broken. In terms of the next operation, I suggest that you can pay attention to 3320-30.
However, if it really pulls up again, as long as it does not stand above 3330 again. Then, we can short here at 3320-30. On the contrary, if the rebound directly breaks above 3340, then be careful. The rebound may turn into a trend reversal, and it is very likely to replicate the rhythm at the beginning of last week.

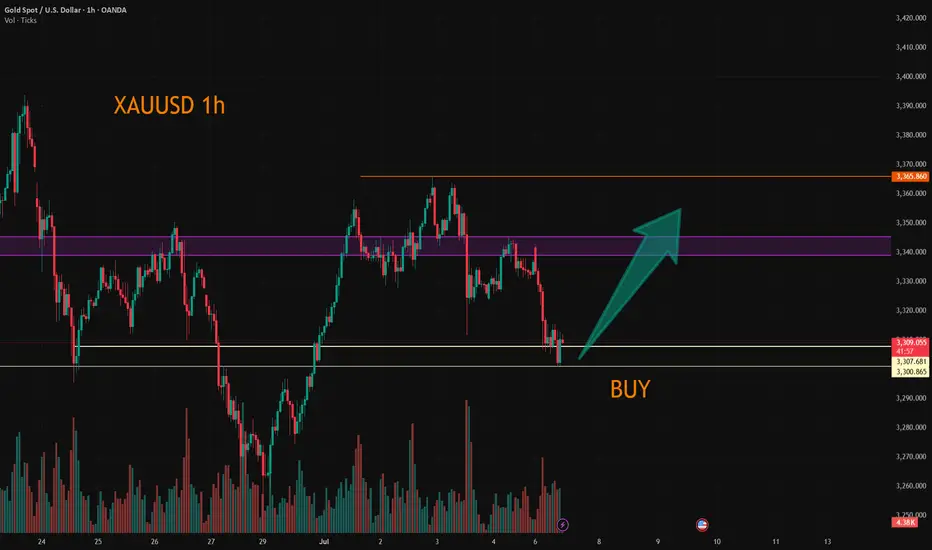
XAU/USD) order block back up trand Read The captionSMC trading point update
Technical analysis of Gold (XAU/USD) on the 1-hour timeframe, focusing on a potential reversal from a key support/order block zone. Here's a full breakdown
---
Chart Analysis – XAU/USD (1H)
1. Key Zone: Support Level / Order Block (Yellow Box)
The price is currently testing a strong support zone that previously acted as a bullish order block (demand area).
This zone is also near a diagonal trendline and a prior breakout level, adding confluence to the setup.
2. Reversal Anticipation (Black Zigzag Path)
The chart suggests two possible scenarios from the support area:
A bullish bounce leading price up toward:
Target 1: 3,343.05 (near 200 EMA)
Target 2: 3,364.62 (upper resistance)
A break below the yellow support zone, triggering a deeper move toward:
Key support: 3,247.55
3. RSI Oversold Signal
RSI (14) is at 32.66, which is near oversold territory, signaling potential for a bullish reversal if buying pressure steps in.
4. EMA (200 - Blue Line)
EMA at 3,330.95 currently acts as dynamic resistance.
If price bounces from the order block, this EMA may serve as the first reaction level before further upside.
Mr SMC Trading point
---
Summary
Bias: Bullish bounce if price holds above 3,296.04 (order block support).
Entry Zone: Current price near 3,301 or confirmation bounce candle.
Targets:
TP1: 3,343.05
TP2: 3,364.62
Invalidation: Strong break and close below 3,296.04 may open the path to 3,247.55.
RSI: Favoring reversal conditions (near oversold).
---
Please support boost 🚀 this analysis)

XAU/USD) support level back bullish trend Read The captionSMC trading point update
Technical analysis of Gold (XAU/USD) on the 3-hour timeframe, suggesting a long trade idea with a clearly defined support zone and target projection. Here's the detailed breakdown:
---
Chart Breakdown (3H - XAU/USD)
1. Support Zone (Yellow Box):
Price reacted strongly to the 3,244–3,300 area, which is identified as a key support level.
This area has historically seen demand and is now acting as a base for potential bullish continuation.
2. Falling Wedge Breakout:
A falling wedge pattern has been broken to the upside, which is typically a bullish reversal signal.
The breakout indicates a shift from the previous bearish momentum into bullish strength.
3. EMA 200 Confirmation:
Price is now above the 200 EMA (3,333.347), supporting a bullish bias.
This can act as dynamic support going forward.
4. RSI Momentum:
RSI at 62.00, indicating growing bullish momentum without being overbought.
The RSI has also broken above a previous local high, confirming strength.
5. Target Projection:
The projected move (blue arrowed box) suggests a potential rally of +105.305 points (3.20%), targeting the 3,394.503 level.
This level aligns with previous price structure and acts as the next major resistance.
6. Anticipated Price Path (Black Zigzag Line):
Price is expected to pull back slightly, retesting the wedge breakout or support zone.
After this retest, a bullish continuation toward the target point is projected.
Mr SMC Trading point
---
Summary:
Bias: Bullish
Pattern: Falling wedge breakout + support retest
Entry Zone: Around 3,300–3,320 on a retest
Target: 3,394.503
Invalidation: Strong break and close below 3,244.166
Confirmation: Bullish price action near support + sustained RSI strength
Please support boost 🚀 this analysis)

Trade Breakdown: XAUUSD 15-Min | Liquidity Grab + Reversal PlayOANDA:XAUUSD
Psychological Setup
This trade is rooted in the psychology of smart money and retail behavior. After a sharp drop in price, most retail traders expect continuation (trend-following). However, institutions often manipulate liquidity zones — hunting for stop-losses before a true reversal. This trade capitalizes on that behavior.
🔍 Technical Explanation:
🔻 1. Market Structure:
Price was previously in a downtrend, forming lower highs and lower lows.
A falling wedge pattern (red lines) formed after a strong bearish move, signaling potential bullish reversal.
Price broke the wedge to the upside — a classic reversal signal.
🔁 2. Liquidity Concept:
Below the wedge: The market grabbed liquidity by taking out stop losses of buyers who entered too early.
Above the wedge (TP Areas):
TP 1 Area (red box): This is the first logical resistance where previous supply sits — many sellers will enter here, providing buy-side liquidity.
Next Target Liquidity (grey box above): This is a major imbalance zone and likely where stop-losses of early short sellers are stacked.
Price is expected to grab liquidity from that area (marked by the red arrow).
✅ Entry & Trade Logic:
Entry Zone: After liquidity was swept at the bottom of the wedge, a bullish engulfing candle formed near demand — signaling institutional interest.
Risk-Reward Setup:
Targeting 0.80% move (approx. 26.48 points).
Trade is based on reversal from demand zone + wedge breakout + liquidity grab confirmation.
🎯 Target Projections:
TP1 Area: Conservative target, just above recent structure.
Final Target: High-probability liquidity zone where market is drawn to clean up resting orders (grey zone).
🧠 Why This Trade Matters (Trading Psychology Insight):
Most retail traders get trapped in emotional entries — entering shorts after a drop or longs too early in a wedge.
Smart money waits for liquidity sweeps before moving price in the desired direction.
This setup shows the importance of patience, structure, and understanding market psychology rather than reacting emotionally to price action.
📌 Key Takeaways:
📉 Trap: Falling wedge builds false bearish confidence.
🧠 Psychology: Stop hunts create fuel for reversal.
📈 Reaction: Smart money absorbs liquidity, moves price toward next inefficiency.
Hashtags:
#XAUUSD #SmartMoney #LiquidityHunt #TradingPsychology #GoldTrade #PriceAction #WedgeBreakout #FXOpen #TechnicalAnalysis #SupplyDemand

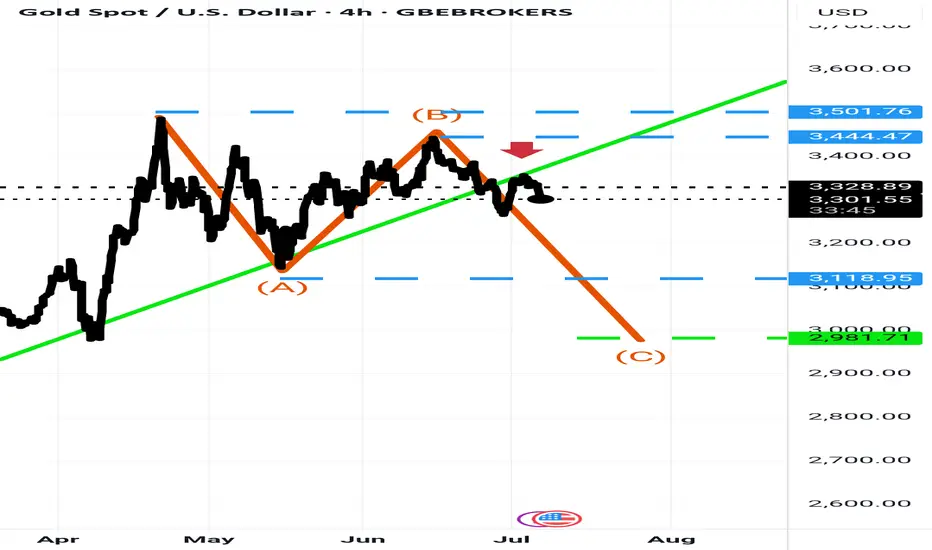
Gold will Fall Gold formed lower high below trend lin and not able to hold 2380 level . On the same time wave C will be extended near to green target .
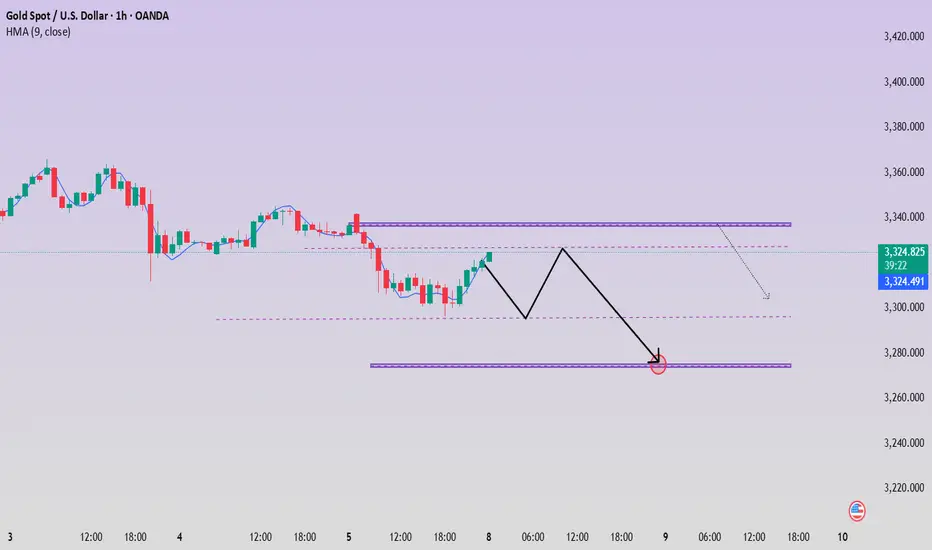
Gold Consolidates Around 3,310 – Waiting for a Breakout📊 Market Developments:
• Gold is currently holding near $3,310, which aligns with the weekly pivot level on TradingView.
• With the upcoming FOMC minutes and key data (CPI, NFP) approaching, the market remains cautious. The USD is stable, keeping gold in a tight range.
📉 Technical Analysis:
• Short-term Resistance: $3,325–3,335 (H4 supply zone)
• Nearest Support: $3,300–3,305 (weekly pivot + H1/H4 lows)
• EMA 09 on H4: Price is trading below EMA09 → short-term bearish bias.
• Candlestick/Volume/Momentum: Lower highs on H4 candles with declining volume indicate weak buying momentum and a possible continuation of consolidation or mild pullback.
📌 Outlook:
• As long as gold stays below $3,305 and the USD remains firm, a pullback toward $3,300–3,295 is likely.
• A break above the $3,325–3,335 resistance zone could trigger a rally toward $3,350 or higher.
💡 Suggested Trade Setup:
🔻 SELL XAU/USD at: $3,322–3,325
🎯 TP: $3,300
❌ SL: $3,332
🔺 BUY XAU/USD at: $3,300–3,303
🎯 TP: $3,325–3,335
❌ SL: $3,295

GOLD H2 Intraday Chart Update For 7 July 2025Welcome to the new week traders
as we have FOMC meeting minutes report due this week so firs market is fell down from 3350 Psychological level now is testing 3300 psychological level
all eyes on breakout of 3300 level for now if market breaks 3300 level then it will move towards 3280 then 3350
only clear breakout of 3335 will clear path for towards 3368 level
Disclaimer: Forex is Risky

XAUUSD Below 3300 – Buying Opportunity or Trap? Gold Breaks Below 3300 – A Buying Opportunity or Sign of Deeper Correction?
🧭 Weekly Kickoff: Is the Sell-off Really That Dangerous?
At the start of the week, gold experienced a sharp drop to 3306 USD, breaking through the psychological 3300 support level and testing the 329x region. However, this isn't necessarily a sign of a sustainable downtrend — it's more likely a liquidity sweep before the market consolidates again for a bigger move.
🌐 Macro Updates Impacting Gold:
US inflation continues to ease, providing space for the Fed to loosen policy if needed.
FOMC minutes due soon — markets will be closely watching for clues about possible rate cuts.
Tensions in Gaza de-escalate temporarily, leading to a slight reduction in demand for safe-haven assets.
Trump's new tax bill has been passed, adding pressure to US public debt.
US–China trade war may be delayed — reducing short-term geopolitical pressure.
In summary, we are in a consolidation phase, with a high probability of a breakout in the coming days.
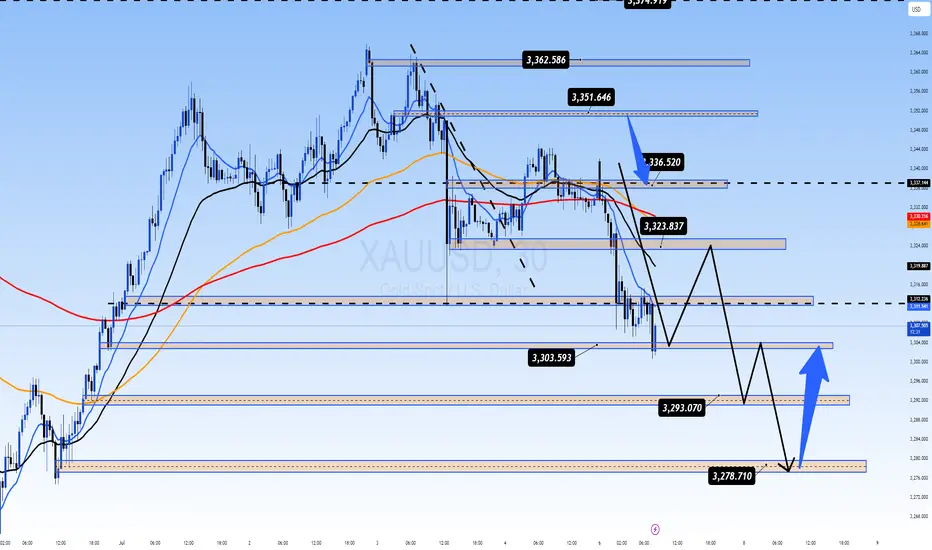
📉 Technical Analysis – CP Pattern in Focus
We are seeing a Continuation Pattern (CP), which generally signals that the current correction is a pause before the trend continues.
After rejecting resistance at 3336, gold fell, breaking through the 3323 support and quickly testing the 3303 zone, a key short-term support.
If gold breaks below 3293, the next target will be the 3278 USD liquidity zone, where strong buying could emerge.
📌 Key Trading Plan – 04 July
🔵 BUY ZONE
3294 – 3292
Stop Loss: 3288
Take Profit: 3298 → 3302 → 3306 → 3310 → 3315 → 3320 → 3330
🔴 SELL SCALP
3324 – 3326
Stop Loss: 3330
Take Profit: 3320 → 3316 → 3312 → 3308 → 3304 → 3300
🔴 SELL ZONE
3350 – 3352
Stop Loss: 3356
Take Profit: 3346 → 3340 → 3335 → 3330 → 3320
🧠 Market Sentiment Today
The market is currently in a consolidation phase, likely trading sideways between 3320 and 3340. A breakout seems likely once the liquidity from the US holiday subsides.
✅ Primary Bias: Look to buy dips into support zones.
⚠️ Alternative View: Only consider selling if price clearly rejects key resistance levels.
💬 What’s Your View on Gold Today?
Do you think gold will break through 3390 soon, or is there more room for a deeper correction towards 3270?
👇 Share your thoughts and analysis in the comments below!
XAUUSD – Gold at a Key AreaGold is now in a crucial zone with short potential.
If the market provides a valid bearish signal, I’ll take the short.
But if this zone breaks and confirms with a pullback, I’ll switch bias and go long.
💡 Remember:
We don’t control the market — we just try to profit using structure, setups, and solid risk management.
📌 Always risk max 1% per trade.
If the market goes against your bias, you only lose 1% — not your whole account.
🧠 One trade won’t make you rich,
But one reckless trade can destroy everything.
No gambling.
Just discipline, structure, and smart execution.

The bill was introduced; the price did not rise but fell.Due to the implementation of the US bill, most traders in the market are bullish on gold and believe that gold will soar on Monday. As a result, it jumped up and fell sharply this morning. This is the uncertainty of the market. Although the short position given near 3340 last Friday was late, it fell to the low point of 3306 at the opening of the Asian market today.
In addition, the key to this sharp drop is the high point before the rebound, that is, the starting point or the position of the top and bottom conversion. Once it is broken, you have to change your mindset. The volatile market is like this, just get used to it. The turmoil caused by Trump's bill will not appear for a while. It takes a process and cannot be unilaterally considered as bullish or bearish.
In the early Asian market, the price fell all the way from 3342 US dollars to 3306. How to judge the end of the decline? It is to stare at the high point of the rebound before the last decline of 3320 US dollars. The loss of 3300 US dollars in the early trading indicates that the gap-up opening is a lure for more.
Today, I think that 3325 above 3320 can be used as the dividing point between long and short positions. You can short with a light position near 3315, and pay attention to the 3295-3290 line below. After the upward breakthrough is confirmed, consider adjusting the position and making other arrangements. For the time being, we will look at the weak adjustment during the day.

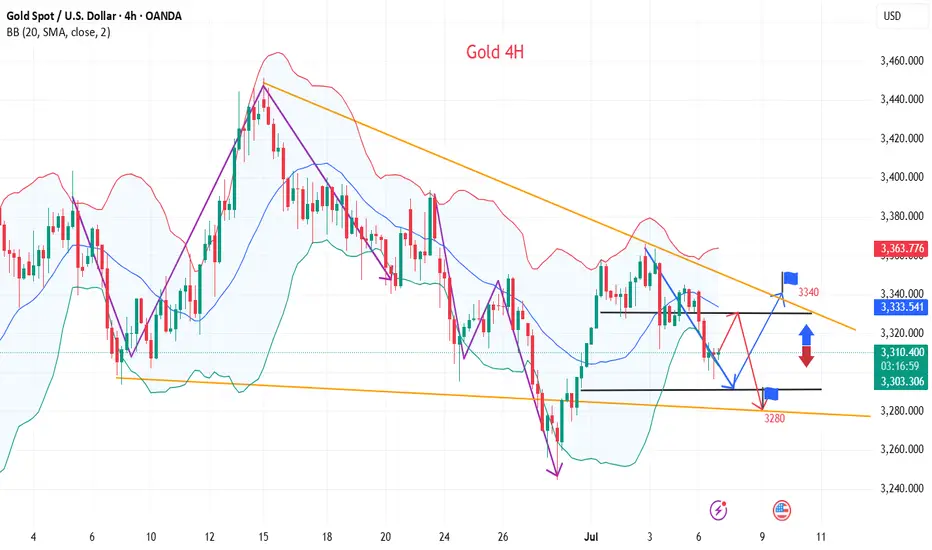
Big changes begin. Dominant trend?Event summary:
The United States passed the Big and Beautiful Act; how to get this part of the tax after the massive tax cut? Then it can only be obtained through other means, and the tariff war initiated by Trump is one of them. At the same time, the bill will increase the federal debt by trillions of dollars, further widening the gap between the rich and the poor.
Immediately after the bill was signed and took effect, Musk announced the establishment of the "American Party". He wrote: We live in a one-party state, not a democratic country. Today, the American Party is established to return your freedom to you. At the same time, Musk posted on July 6, when and where should we hold the first congress of the "American Party"? This will be very interesting.
This event is likely to support the trend change of gold bulls in the short term.
Market analysis:
From the daily chart, after bottoming out and rebounding this week, the weekly line closed higher, and there is still upward momentum next week; short-term focus on the pressure of the 3345-3365 range, which is likely to become a key area for long and short competition. Before breaking upward, focus on the high and fall. Pay attention to the support rebound of 3320-3325 area below. Once the upper pressure range is broken, the bullish space will expand, and it is not ruled out that it will hit above 3400 and then go down.
In terms of operation, the price falls back and buy on dips in the 3315-20 area, and pay attention to the profit range of 3345-3365 on the upside.

Trump's new tariffs are coming, will gold soar?
✏Hello everyone, let's comment on the gold price next week (July 7, 2025-July 11, 2025)
. ⭐️Gold Information:
This week, the spot gold price showed a trend of rising first and then falling. From Monday to Wednesday, driven by safe-haven demand and the weakness of the US dollar, the gold price recorded three consecutive increases, climbing rapidly from US$3,271/ounce to the intraday high of US$3,365/ounce on Wednesday afternoon, showing strong upward momentum. However, on Thursday, before the release of the June non-farm payrolls data, market sentiment turned, and the gold price plummeted to US$3,312/ounce, the largest single-day drop in the week. On Friday, affected by the light trading during the US Independence Day holiday, the gold price fluctuated between US$3,330 and US$3,355/ounce, closing at around US$3,337/ounce, up about 1.91% for the week.
U.S. President Donald Trump announced that the U.S. will begin sending formal letters to trading partners on Friday, ahead of a July 9 deadline, outlining new tariffs ranging from 10% to 70%, which will take effect on August 1. Treasury Secretary Scott Bessant added that a series of trade agreements are expected before the deadline, with an estimated 100 countries facing reciprocal tariffs of at least 10%. He also hinted that some agreements will be announced soon.
⭐️Labaron personal comment:
Gold prices continue to consolidate sideways, fluctuating in the 3242-3450 range
The following important key areas have been identified:
Resistance: $3362, $3393, $3446
Support: $3312, $3279, $3241

Gold opening market strategy analysis
💡Message Strategy
In the case of all negative non-agricultural data, gold did not fall below the support of 3300, which shows that gold bulls are still the main trend. The current daily pattern of gold is three positives, one negative and one positive. The trend of the opening next Monday is also very important. Once it continues to rise and rebound to break through the suppression, the bulls will open the door to regain the 3400 mark.
At present, the short-term pressure is still maintained at 3345-50, which is also the first point for the bulls to break through. Once the breakthrough is successful, the next target will be around 3365-3370.
📊Technical aspects
From the 4-hour analysis, the support at 3330 is concerned, and the support at 3320 is concerned. The short-term resistance at 3345-50 is concerned, and the suppression at 3365-70 is concerned. The overall low-multiple cycle participation is maintained. In the middle position, watch more and do less, and be cautious in chasing orders, and wait patiently for key points to participate. Pay attention to the specific operation strategy in time.
💰Strategy Package
Long Position:3320-3330,SL:3305,Target: 3370

GOLDGOLD needs more upside after this correction, next reaction will be coming above 3345 and if consolidates it's a push up further towards 3380 otherwise drop from 3345 above and push up again from below 3300.
Disclosure: We are part of Trade Nation's Influencer program and receive a monthly fee for using their TradingView charts in our analysis.
