XAUUSD Consolidates Below Resistance – A Breakout Imminent?On the 4-hour timeframe (H4), XAUUSD is clearly consolidating just below the key resistance zone near $3,366, forming higher lows and lower highs within a tightening range highlighted by the shaded area.
1. Key Price Action Highlights
Price has been forming higher lows, suggesting growing bullish momentum.
The $3,366 resistance remains intact – a breakout above this level could confirm bullish continuation.
A visible double bottom (W pattern) formed around June 28 hints at a strong technical rebound after a correction phase.
2. Important Support and Resistance Levels
Price Level
Significance
$3,366 – $3,380
Major resistance zone – likely breakout target
$3,300
Key near-term support where price recently bounced
$3,242
Deeper support – a breakdown here could confirm bearish reversal
3. Suggested Trading Strategy
Buy on breakout above $3,366 with strong volume and clear confirmation (e.g., a large-bodied candle closing above resistance).
Consider buying on a pullback to the $3,320 – $3,300 zone for better risk-reward.
Stay cautious if price breaks below $3,300 – this could signal a bearish shift in momentum.
Gold is currently in a tight consolidation phase under major resistance, with bullish structure still intact. A breakout above $3,366 could trigger a sharp move upward. Until then, traders should monitor the lower boundaries for potential pullbacks or invalidation signals.
Goldprice

GOLD (XAUUSD) 4H Technical Analysis – Channel Breakout & Target🧠 Executive Summary:
The GOLD market has completed a key structural shift following a successful bearish trendline breakout, and is now trading within a well-formed ascending price channel. Price action has recently bounced from the channel support area, which aligns closely with a retested zone that was previously resistance. All signs now point to a potential continuation of the bullish leg—but only if the current structure holds.
This analysis outlines the technical foundation, key trading zones, price action psychology, and risk management factors that define this setup.
🔍 Technical Breakdown
🔸 1. Trendline Breakout – The Structural Shift
The bearish trendline, which previously capped multiple upside moves throughout June, has finally been broken.
The breakout was accompanied by higher volume and larger bullish candles, indicating momentum.
After the breakout, price pulled back near the trendline and respected the newly flipped support zone.
This forms a classic Breakout–Retest–Continuation pattern, one of the most reliable in trend reversal scenarios.
🔸 2. Formation of Ascending Channel – A New Bullish Structure
After the breakout, price action established a consistent pattern of higher highs and higher lows, confirming the birth of a new ascending channel.
The channel support (around 3,320–3,330) has been tested multiple times and held strong.
The channel resistance lies between 3,390–3,400, which is now the next short-term target if bulls maintain control.
The channel offers both trend direction and entry timing opportunities as price bounces between its boundaries.
🔸 3. Retest Zone – Buyer’s Territory
The price is currently bouncing off the mid-channel zone, where the previous downtrend resistance overlaps with current channel support.
This confluence area is where smart money often enters after institutional accumulation at the base (around 3,270).
The bullish wick rejections around this zone signal a likely continuation toward the upper channel.
📈 Price Behavior & Market Psychology
What’s happening here isn't just lines and candles—there’s a psychological story unfolding:
Fear drove the market lower, respecting the bearish trendline until late June.
Hope and buyer aggression surged once the breakout confirmed.
Now we’re in the "belief" phase, where traders await confirmation of the new trend.
Many are watching for entry confirmation at support zones, and as long as fear doesn’t return (i.e., price breaking below 3,320), the structure remains valid.
🧭 Key Technical Levels to Watch
Level Type Price Range Notes
Major Support Zone 3,270–3,285 Key buyer zone, invalidation of bullish case below this
Channel Support 3,320–3,330 Retest zone after breakout, current active level
Mid-Channel Area 3,350–3,360 Decision zone – price may build momentum here
Channel Resistance 3,390–3,400 First bullish target, potential breakout area
Breakout Target 3,420–3,440 If price breaks channel resistance with volume
🧮 Trade Setup Ideas (Educational – Not Financial Advice)
🟢 Long Setup Option 1:
Entry: Upon confirmation above 3,340–3,345 with bullish engulfing candle or breakout bar.
Stop-Loss: Below 3,320 or slightly below channel support.
Take Profit: Partial at 3,390 (channel top), full at 3,420–3,440 breakout zone.
R:R Ratio: 1:2.5+ (highly favorable)
🔴 Bearish Scenario (Risk Management)
If price closes below 3,320 with momentum, expect a revisit to the 3,270–3,285 support.
This invalidates the current bullish channel structure and might bring in short-term bearish pressure.
Avoid long positions until new structure is formed.
🧠 Educational Takeaway for Traders
This analysis highlights the importance of:
Structure-based entries: Instead of chasing candles, you wait for confluence and entry triggers.
Multiple timeframe confirmation: Higher timeframes also show bullish bias, giving confidence to 4H trades.
Risk management: The current setup allows tight stop losses relative to potential reward, making it attractive.
By combining trendline breakouts, channel formations, and support/resistance flips, you significantly increase the probability of a successful trade.
📌 Final Thoughts:
Gold is giving traders a clean and structured opportunity. The market has shown strength through structure, not just random price spikes. With the ascending channel intact and price respecting support zones, there is a solid foundation for a bullish continuation toward 3,400 and beyond.
But as always, confirmation is key. Wait for price action to validate your bias, and never ignore risk management.

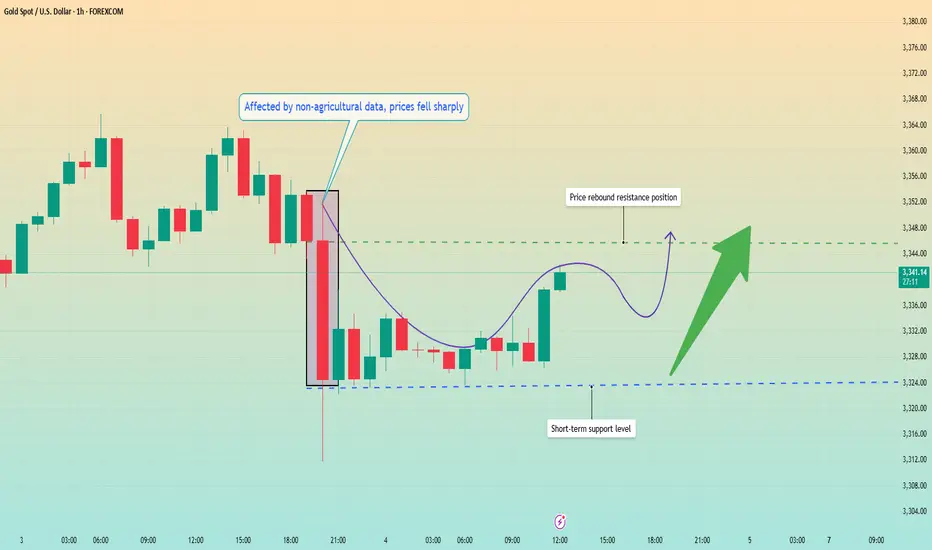
Non-farm data exceeded expectations. Will prices fall temporarilInformation summary:
Affected by the US Independence Day, the June non-farm data was released in advance. This non-farm data surprised the market, far below expectations and previous values, with a significant increase in employment exceeding expectations and previous values, and a sharp drop in unemployment to 4.1%.
The market bet that the July rate cut plan would be directly scrapped. After the employment data was released, the gold price quickly plummeted to $3,312, but the sharp drop in the market had poor continuity and ultimately did not form a unilateral decline.
Market analysis:
Due to the US Independence Day holiday, the US market was closed. In fact, the only thing left for us is the Asian and European markets. And today is the last trading day of this week, and the market is likely to maintain a state of consolidation.
From the 1-hour chart, the price fell after testing the 3,360 high twice. The negative impact of the non-farm data accelerated the decline, and the decline did not continue, and a new support level was formed near 3,323 after the decline. At present, the price is impacting around 3,345, and the bulls are expected to rebound upward and return to the upward trend.
I think the current market continues to rebound, with the lower low of 3323 as the dividing point, and high sell and low buy operations in the consolidation area of 3320-3350.
This is the last trading day of this week. I wish all traders a perfect ending and a perfect weekend.
Gold accumulates and breaks through 3350 points
⭐️Personal comments:
Gold price rebounded around 3350. There was no important news and bank holidays in the US session on Friday, so it rebounded in the short term
⭐️Set gold price:
🔥Sell gold area: 3365-3367 SL 3372
TP1: $3355
TP2: $3342
TP3: $3330
🔥Buy gold area: $3311-$3313 SL $3306
TP1: $3325
TP2: $3338
TP3: $3350

Gold fluctuates during the day, short-term profits will be left
📌Main driving events of gold
The big non-agricultural data in the United States caused the gold price to fall by almost 40 US dollars in one breath, but after a short emotional storm, the market returned to calm. Today's market began to bottom out and rise. As of now, the non-agricultural market has been backed by 50%, and the energy of the shorts has been basically digested. Next, the bulls will start to exert their strength! Today's direction is still the same and continue to be bullish!
📊Comment analysis
In the US market, the gold price rebounded after the decline and the bottom of the second retracement appeared. The support level is 3322. After a night of fluctuations, gold has begun to rise, and the low point has begun to rise. The key point of the day is still 3323. In the morning, we wait for the gold price to fall back to around 3323 and we will buy the bottom and go long. We don’t expect to surpass yesterday’s high point during the day, but at least it will go to 3350!
💰Strategy Package
Long position:
Gold long at 3322-3327, stop loss 3315, target 3350-3360
⭐️ Note: Labaron hopes that traders can properly manage their funds
- Choose the number of lots that matches your funds

Will the NFP impact cause the bear market to dominate?📰 News information:
1. Initial jobless claims and NFP data
2. The final decision of the Federal Reserve
📈 Technical Analysis:
In the previous post, I have stated that if the hourly line closes above 3320, gold will fall into high consolidation in the short term. Currently, gold fluctuates narrowly in the short term. I think now we just need to be patient and wait for key points to enter the market. The daily and weekly lines clearly show that the high point of the oscillation range is constantly moving up, and the center of gravity continues to rise. The current market is quietly accumulating momentum, and a new round of weekly and monthly lines are about to rise. Therefore, first of all, I will pay attention to the defensive point below 3320, and then refresh the point below is the previously mentioned 3315-3305. If the point below is touched to get effective support, you can consider going long. Bros who trade independently must strictly set TP and SL to avoid the impact of market fluctuations.
🎯 Trading Points:
BUY 3320-3315-3310
TP 3330-3340-3360
In addition to investment, life also includes poetry, distant places, and Allen. Facing the market is actually facing yourself, correcting your shortcomings, confronting your mistakes, and strictly disciplining yourself. I hope my analysis can help you🌐.
FXOPEN:XAUUSD PEPPERSTONE:XAUUSD FOREXCOM:XAUUSD FX:XAUUSD OANDA:XAUUSD TVC:GOLD

XAU/USD (GOLD) H1 Chart Outlook – Supply & Demand PerspectiveGold is currently consolidating in a tight range near the 3355–3358 zone, showing indecision ahead of a potential breakout. Based on supply and demand dynamics, here’s what to watch:
---
🔼 Bullish Scenario
If the H4 candle closes above 3365, this would confirm a bullish breakout above the immediate supply zone. In that case, expect upside momentum to target key resistance levels:
🎯 3385 – Minor resistance
🎯 3400 – Major resistance and potential reversal zone
A confirmed breakout with strong volume could open room for a short-term bullish rally.
---
🔽 Bearish Scenario
On the flip side, if the H4 candle closes below 3340, it would signal weakness and a possible rejection from the current range. This breakdown could shift the momentum to the downside, targeting the following support levels:
🛑 3320 – Near-term support
🛑 3300 – Critical demand zone
Failure to hold 3300 could indicate further bearish pressure in the coming sessions.
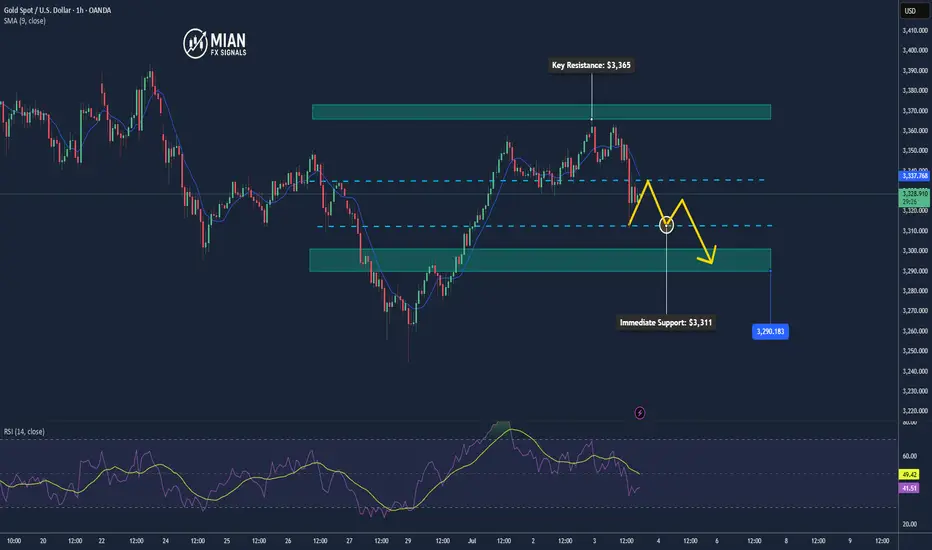
Gold Drops as NFP Beats, USD Gains📊 Market Overview:
• June’s Non-Farm Payrolls came in stronger than expected at +147K (vs 110K forecast), with unemployment ticking down to 4.1%.
• The US Dollar surged (DXY up ~0.5%) and Treasury yields rebounded following the release.
• Gold dropped sharply after the report, hitting a session low of $3,311 and is now trading around $3,328.
📉 Technical Analysis:
• Key Resistance: $3,364
• Immediate Support: $3,311
• EMA 09 (H1): Price is below the 09 EMA → confirms short-term bearish trend.
• Pattern / Momentum: A bearish engulfing candle near $3,364 signaled strong seller control. The failure to bounce afterward suggests persistent bearish pressure. RSI is tilting lower, confirming weakening momentum.
📌 Outlook:
Gold may continue to decline toward the $3,300–$3,290 area if USD and yields remain firm, especially if upcoming US data (such as ISM Services PMI) also supports the dollar strength.
💡 Suggested Trade Setup:
🔻 SELL XAU/USD at: $3,333 – $3,335
🎯 TP: $3,300
❌ SL: $3,339
🔺 BUY XAU/USD at: $3,293 – $3,290
🎯 TP: $3,330
❌ SL: $3,287
Gold non-agricultural layout strategy
💡Message Strategy
Small non-farm data "big surprise"
The ADP employment report released on Wednesday showed that the number of private employment in the United States decreased by 33,000 in June, the first decline since March 2023. Economists surveyed previously expected the number to increase by 100,000 on average.
The ADP employment report showed that the number of private employment in the United States fell for the first time in more than two years in June, indicating that the Federal Reserve may cut interest rates as early as September.
Spot gold closed up $18.20 on Wednesday at $3,356.90 per ounce.
Bednarik pointed out that gold has gained upward momentum recently, with a gold price target of $3,373.50 per ounce. The "big surprise" of the ADP data suggests a weak non-farm payrolls report in June.
📊Technical aspects
1. The daily line was the support line for the rise in the previous month. It fell back very hard last week and turned into suppression. It was tested repeatedly and finally a big Yin hit the lower track of the pattern. However, it started at a low point this week and rose steadily. Now it has returned to the top of the lifeline again. At this point, the space will consider switching again.
2. The four-hour pattern opens slightly upward, with the lifeline 3330 as the dividing line between strength and weakness. Hold here and climb upward step by step.
3. The double lines on the hourly chart formed a dead cross after breaking through and turning into pressure last week, which helped to further increase the volume and fall by more than 100 US dollars. After breaking through and standing on it this time, it turned into support. The double line range is 3332-3342. This area is used as the boundary to switch between the upper and lower spaces. The support line for the bulls to dominate is the upper rail position of 3332, and the support line for the bulls to sweep is the lower rail position of 3316
💰Strategy Package
Long Position:3332-3340,SL:3316,Target: 3400

Buying the Dip or Catching a Knife? My Gold Setup Explained.Entered a long position on XAU/USD from the 1H demand zone following sharp intraday selling into a key support level. With gold hovering near $3,300 and a significant testimony from Fed Chair Powell on deck, the setup aligns with both technical rebound potential and fundamental uncertainty that could fuel upside.
The goal here is to play the liquidity vacuum left after aggressive positioning was cleared, with tight invalidation and asymmetric reward.
Technicals:
• Entry aligned with prior price inefficiency and confluence of multiple demand zones
• 1H structure shows clear deviation below the range with immediate buy-side response
• EMA channel flattening, indicating potential compression ahead of expansion
• First target: $3,352
• Risk-managed with defined stop-loss below $3,260
Execution Note: This is not a “hold forever” trade. It’s an opportunistic reaction to unwind + sentiment imbalance.
Fundamentals
• Gold saw a 25% surge in 2024 due to safe-haven demand and dovish policy, but enters 2025 under pressure from:
▫️ A strong USD
▫️ Higher cost of carry
▫️ Speculators taking profit
• Fed policy remains the core variable:
▫️ A hawkish tone from Powell could weigh on price
▫️ Rate cuts would likely revive bullish momentum
• Central bank demand remains supportive
• Geopolitical tensions (Russia-Ukraine, Israel-Iran) could trigger safe-haven bids again.
Bearish headwinds:
• Waning bullish momentum per RSI divergence
• Reduced rate cut expectations post-election
• Powell’s testimony could revive volatility either way.
This is a short-term tactical long, not a macro bet. With sentiment temporarily overextended and key support defended intraday, this is a high R/R window to exploit Powell-related volatility.
Let’s see how price reacts into $3,350+. Any sustained strength there would open room toward $3,400, while failure would confirm a retest of $3,260s.
Note: Please remember to adjust this trade idea according to your individual trading conditions, including position size, broker-specific price variations, and any relevant external factors. Every trader’s situation is unique, so it’s crucial to tailor your approach to your own risk tolerance and market environment.

Gold grows, recovers near 3390
📣Gold News
Gold prices edged higher during the North American trading session as investors turned their attention to the upcoming U.S. non-farm payrolls report (NFP), which could influence the Fed's next policy move.
The latest labor data showed that companies are pausing hiring rather than laying off employees, reflecting caution in an uncertain economic environment. Meanwhile, Microsoft's decision to lay off 9,000 employees has heightened concerns about a weak labor market.
Traders are currently awaiting the official employment report from the U.S. Bureau of Labor Statistics on Thursday, which is expected to show 110,000 new jobs in June, down from 139,000 in May. The unemployment rate is expected to rise slightly to 4.3%, still within the 4.4% range of its forecast according to the Fed's latest summary of economic projections.
📣 Technical Analysis
NF is worth buying before the news release, holding. The dollar continues to be under selling pressure from investors worried about the Trump administration's erratic tariff policy.
💰Set Gold Price:
💰Sell Gold Zone: 3390-3398 SL 3405
TP1: 3380 USD
TP2: 3363 USD
TP3: 3350 USD
💰Buy Gold Zone: 3296-3294 USD SL 3289 USD
TP1: 3308 USD
TP2: 3318 USD
TP3: 3330 USD
⭐️Technical Analysis:
Set reasonable buy orders based on technical indicators EMA 34, EMA89 and support and resistance areas.
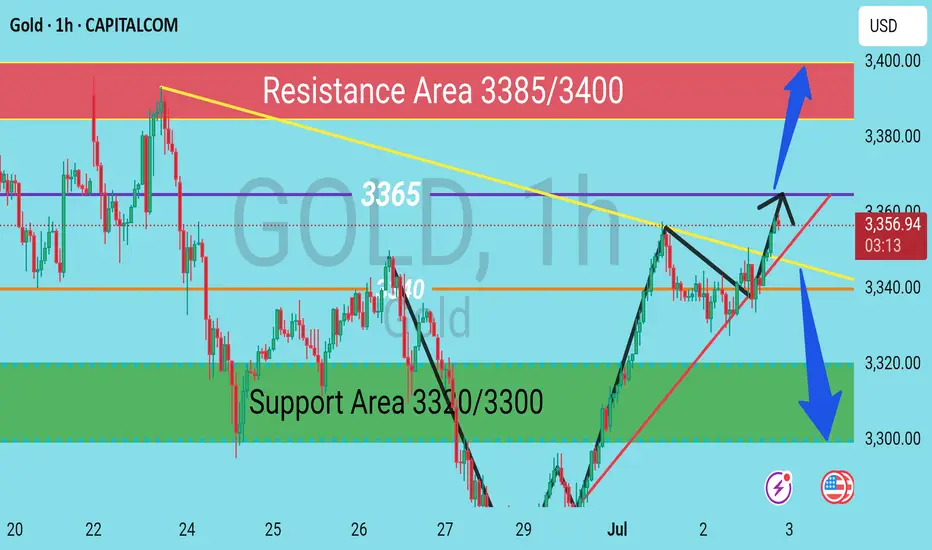
Gold Price Analysis July 3GOLD Technical Analysis - D1 Frame
On the D1 frame, the uptrend is still being maintained with momentum towards the price gap zone. During the European session, selling pressure started to appear around the resistance zone of 3365 - showing that this is the area where the sellers are making counter-moves.
On the chart, the gold price is accumulating and forming a triangle pattern, indicating the possibility of a strong movement phase.
If the price breaks the upper border of the triangle (above the 3363 zone), it will likely open up an opportunity to approach the next resistance at 3388.
On the contrary, if it breaks the lower border (below the 3330 zone), the correction trend may be triggered, heading towards deeper support zones.
Important Zones:
Resistance: 3363 – 3388
Support: 3330 – 3311 – 3297 – 3277
Trading Strategy:
BUY Breakout: When price breaks above 3363
SELL Breakout: When price breaks below 3330

XAUUSD Set for Strong Bullish Wave – Targeting 3,726?Gold (XAUUSD) is showing signs of a bullish recovery after a recent correction between the 3,290–3,340 USD zone. On the daily chart, a clear Elliott Wave formation is unfolding, with the price potentially entering wave 5 aiming for the 0.618 Fibonacci extension at 3,726 USD.
Clear Wave Structure:
The a-b-c corrective wave appears to have completed in mid-May.
The price is now in wave 3 and preparing for a potential extension in wave 5.
Candlestick and Buying Momentum:
Recent candles show strong buying pressure with four consecutive bullish sessions.
The current upward momentum is testing the 3,352 resistance – a breakout could open the path to 3,450 and eventually 3,726 USD.
Support & Resistance Levels:
Immediate support: 3,320 – 3,330 USD
Key resistance: 3,450 USD (recent swing high)
Extended target: 3,726 USD (Fibonacci 0.618 from wave 2 low to wave 3 peak)
Suggested Trading Strategy:
Favor buy on dip strategy, waiting for a minor pullback to the 3,330–3,340 area before entering long.
Set stop-loss below 3,300, with targets at 3,450 and 3,726 USD respectively.
Conclusion:
The XAUUSD chart suggests a potential strong bullish wave according to the Elliott Wave framework, with a breakout likely leading to the 3,726 USD zone. Traders should closely monitor price action around the 3,350 level for confirmation of continued upward momentum.
What’s your view on this analysis? Drop a comment and let’s discuss your trading strategy together!

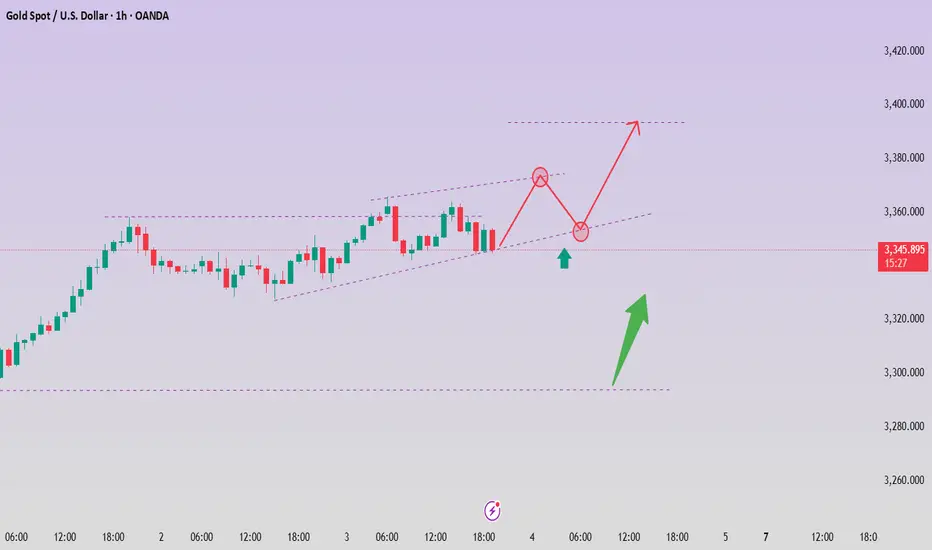
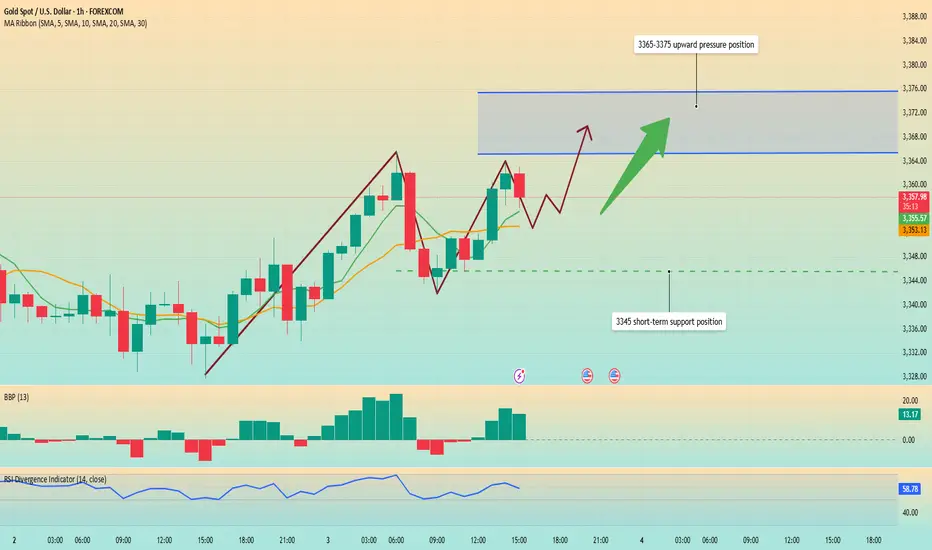
Data is about to be released. Trend change?Affected by the ADP employment data, gold prices broke through 3345 and continued to fluctuate upward to 3365 US dollars. This trend fully shows that the position of 3345 US dollars is the watershed between long and short.
From the 1-hour chart, the overall market is still fluctuating upward. Although it has fallen slightly, I think it is accumulating momentum for a second rise. ADP employment data is negative for the first time. Non-agricultural employment data will be released in 3 hours. The market expects 110,000 jobs. I think the data that may be released will be worse. The number of jobs will decrease and the unemployment rate will also increase, which will drive gold prices to continue to rise.
From a technical perspective, the RSI indicator is currently hovering around 58.7, showing strong upward momentum. MA5-day and 10-day moving averages form a golden cross and continue to rise. The current upward high has not appeared. The gold price may refresh the intraday high of 3365 again.
At present, the upward pressure focuses on 3365-3375 US dollars. The support level is around 3345, which is also the turning point for the upward movement of the MA5 daily moving average.
Operation strategy:
Buy near 3350, stop loss at 3340, and profit range 3370-3375.
Gold strengthens, looking for low-buy opportunities
In the matter of trading, everyone's cognition and operation are different, and it is difficult to find people who can really resonate. This huge difference in trading cognition makes many traders often fall into a situation of having nothing to say in social interaction, and it is difficult to find bosom friends who can really discuss trading in depth and understand each other.
1. The US ADP National Employment Report released yesterday showed that private employment decreased by 33,000 in June, which was the first net decrease in jobs since March 2023, in sharp contrast to the 29,000 increase in May after the downward revision. The market had expected 95,000 jobs to increase in June, and this unexpected decline has raised investors' doubts about the health of the US labor market. So I think the unexpected weakness of the ADP data has led the market to bet on the Fed's interest rate cut, and this expectation has driven the rise in gold prices in the short term.
2. The trade agreement reached between the United States and Vietnam reduced the tariffs previously planned to be imposed on Vietnamese exports, easing market concerns about trade tensions. I believe that against the backdrop of increasing global economic uncertainty, gold's position as a safe-haven asset has become increasingly solid, which will become an external factor affecting the gold market in the future.
Technical aspects:
Weekly chart: Upward trend, long-term buy on dips.
Daily chart: Symmetrical triangle consolidation, cautious wait-and-see in the medium term.
4-hour chart: Downward channel breaks upward, short-term buy on dips.
30-minute chart: Upward trend, short-term buy on dips.
Intraday operations focus on bullish opportunities in the 3350 area, defend 3343. Continue to look above 3365.

"The Great Gold Heist" – XAU/USD Master Plan🏆 "The Great Gold Heist" – XAU/USD Master Plan (High-Risk, High-Reward Loot!) 🚨💰
🌟 Attention, Market Robbers & Money Makers! 🌟
Hola! Oi! Bonjour! Hallo! Marhaba! 🤑💸
🔥 Based on the legendary Thief Trading Strategy (technical + fundamental heist tactics), here’s our blueprint to STEAL massive profits from the XAU/USD (Gold vs. Dollar) market! 🔥
🎯 The Heist Plan (Long Entry Setup)
Entry Point 📈: *"The vault is UNLOCKED! Swipe bullish loot at any price—but for a cleaner steal, set Buy Limits within 15-30M recent swing lows/highs. ALERT UP! ⏰"*
Stop Loss 🛑: "Thief’s SL hides at the nearest swing low (4H TF: 3310.00) OR below the last daily candle wick. Adjust based on your risk appetite & lot size!"
Target 🏴☠️: 3440.00 (or escape early if the cops—err, bears—show up!)
⚡ Scalper’s Quick Loot Guide:
"Only scalp LONG! Rich? Go all-in. Broke? Join the swing traders & rob slow ‘n’ steady. Use Trailing SL to lock profits!"
📊 Market Status:
XAU/USD (GOLD) – Neutral (But Bullish Sneak Attack Likely! 🐂💥)
"The heist is ON, but watch for traps—overbought zones, consolidation, and bearish robbers lurking!"
🔍 Pro Thief Moves:
✅ Fundamentals Matter! (COT Reports, Geopolitics, Macro Data, Sentiment—check our Bii0 for the full loot list!) 🔗👉🏻☝🏻 klik lin.kk
✅ News = Danger! Avoid new trades during releases. Trail your SLs to protect stolen cash! 📰🚨
💖 Support the Heist Crew!
"Hit the BOOST BUTTON 💥 to strengthen our robbery squad! More boosts = easier money steals daily!"
🚀 Stay tuned—another heist drops soon! 🐱👤💎

Gold May Pull Back After Day’s High📊 Market Overview:
• Gold is currently trading around $3,350/oz, with the daily high at $3,366/oz.
• The rally stalled as traders took profits near the session high, while a slight rebound in the USD and rising U.S. Treasury yields weighed on gold’s momentum.
📉 Technical Analysis:
• Key Resistance: ~$3,366 (today’s high), with next level at ~$3,375–3,380 if breached.
• Nearest Support: ~$3,342 (intra-day low), stronger support seen at $3,329–3,330.
• EMA 9/21: Price is hovering near the EMA21 (~$3,350); this area is crucial to determine the short-term trend.
• Candle/Momentum Indicators:
o RSI is around 53-55, signaling a neutral stance;
o MACD shows weakening bullish momentum after hitting resistance.
📌 Viewpoint:
Gold may see a minor pullback in the short term, possibly testing the $3,342–3,329 zone after reacting to the daily high. However, if it holds above EMA21 and EMA50, the medium-term bullish trend remains intact.
💡 Suggested Trading Strategy
SELL XAU/USD at: $3,363–3,366
🎯 TP: 40/80/200 pips
❌ SL: $3,370
BUY XAU/USD at: $3,329–3,332
🎯 TP: 40/80/200 pips
❌ SL: $3,325

GOLD LOND TRADE IDEA We Are Looking Gold Bullish Today ,
TL BUY AREA : 3347 💡
1ST SUPPORT BUY : 3336, 3333 💡
2ND SUPPORT BUY: 3329, 3325 💡
If Gold Break The Trendline Then We See Gold Bearish Price Then We Buy At Support The Target Will Be ATH Liquidity 3390
If Gold Breaks Also 2nd Support Then Continue Bearish Trend Then We Trade Sell On a2nd Support Break
Manage Trades Properly Dont Forget To Follow Us For More Free Trades

Non-farm data is coming. Upward breakthrough?Information summary:
ADP data supports the rise of gold. Secondly, the weaker-than-expected non-farm data has triggered people's hope that the Federal Reserve will cut interest rates earlier. The gold price hit the 3360 mark, then fell back slightly, and is currently fluctuating around 3350.
This Friday is the Independence Day holiday in the United States. The non-farm data will be released on Thursday. Today, we will focus on this data, which will trigger a new trend.
Market analysis:
From the 4-hour chart, gold is currently in a suppressed state. However, it is not ruled out that it will be supported at the bottom as before, and then break through the upper suppression position again with the help of non-farm data.
Therefore, the most critical position today is not above, but near the support of 3325 below. On Wednesday, the support near 3325 was tested many times but did not break down. If the price remains above this position today, the probability of an upward breakthrough is very high.
Based on the current market conditions and the data to be released soon, Quaid recommends that everyone wait and see for a while and wait for the new trend to come. Of course, according to the current forecast data, this will support the rise of gold. A radical approach can also try a long strategy around 3345.

Elliott Wave Analysis of XAUUSDOn the daily chart of XAUUSD, we are witnessing a clearly defined Elliott Wave structure, with the potential formation of an extended wave (5) targeting the $3,726 region — aligned with the 0.618 Fibonacci extension. This is a key technical signal that could capture the attention of both long-term investors and strategic swing traders.
1. Elliott Wave Overview:
Wave (3) concluded at the peak around $3,365, followed by a textbook a-b-c corrective pattern.
Waves "a" and "b" are clearly identifiable, with wave "c" appearing to have completed.
The current price action suggests a rebound from the bottom of wave c — a strong indication of a possible start to wave (5).
2. Wave (5) Target Zone:
The Fibonacci 0.618 extension projects a target near $3,726 — a significant price level the market could approach if bullish momentum builds up.
This level also serves as a psychological resistance zone, so expect possible volatility as the price nears this area.
3. Price Behavior & Confirmation Signals:
Recent candlestick formations reveal renewed buying interest, with multiple bullish candles showing long bodies and lower wicks.
Holding above the key support around $3,300 is crucial for confirming the formation of an uptrend.
A breakout above the $3,365 high (wave (3) peak) would be a strong signal that wave (5) is in motion.
4. Suggested Trading Strategies:
Buy limit: Consider entries around the $3,310 – $3,320 support zone on a retest.
Buy breakout: Trigger entries if price breaks decisively above $3,365 with strong volume.
Take profit: Gradually scale out positions around the $3,680 – $3,726 area.
Stop loss: Place stops below the wave c bottom — under $3,245.
5. Conclusion:
XAUUSD is currently in a sensitive phase with a high probability of a bullish breakout. The Elliott Wave structure shows that there is still considerable upside potential. However, traders should maintain strict risk management, as wave (5) formations often involve significant price swings.

XAUUSD Technical Analysis – 02/07/2025On the 1-hour chart, Gold (XAUUSD) has just confirmed the completion of corrective wave (4) around the 3,328.3 zone, which aligns with the 1.0 Fibonacci level and EMA9 support. Currently, price is rebounding with increasing volume, signaling that buying momentum is returning.
Key Technical Highlights:
Elliott Wave Structure:
Wave (4) found support at 3,328.3.
Wave (5) targets are forming, with Fibonacci extensions pointing to:
0.618: 3,360.05
1.0: 3,380.07
=> These are critical resistance zones to watch.
Fibonacci Retracement Zones:
The current rebound is heading toward the 0.5 and 0.618 retracement levels of the previous down leg, located at 3,362.4 and 3,354.4 – short-term upside targets.
Volume Analysis:
Rising volume on bullish candles confirms a legitimate buying interest, supporting the upward movement.
EMA9 Breakout:
Price has broken above the EMA9 at 3,338.2, shifting short-term trend bias to bullish.
Suggested Trading Strategy:
Favor Buy on Dip entries near the 3,340–3,342 zone if a minor pullback occurs.
Short-term targets: 3,354 – 3,362
Extended target: 3,380
Suggested stop loss below 3,328.0 to manage risk.
Conclusion:
A bullish impulse is forming following the end of wave (4). If price holds above 3,340 and breaks through the nearby Fibonacci resistance levels, wave (5) could extend towards the 3,380 area. This is a pivotal moment to watch for a confirmed short-term uptrend.


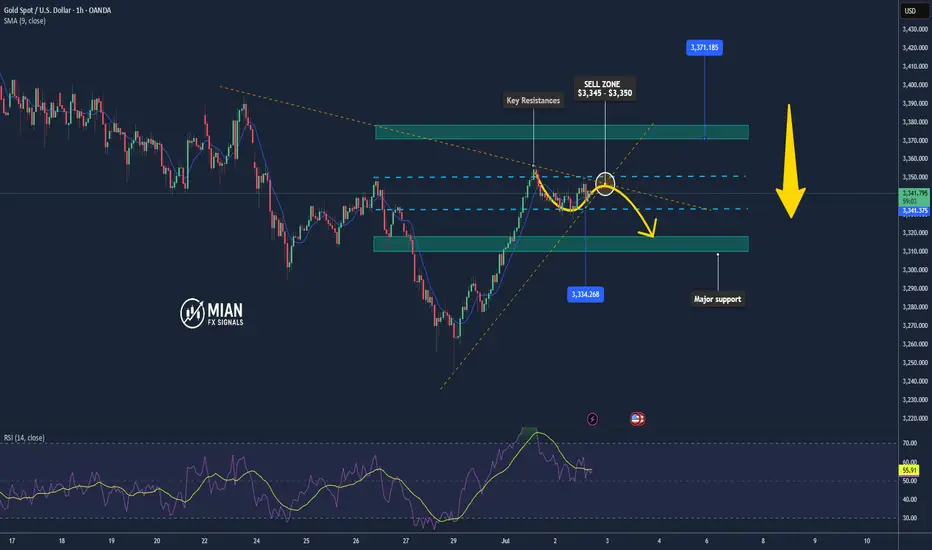
Gold Sees Volatile Swings – Pullback Risk Remains📊 Market Highlights:
Gold surged to $3,351 earlier today after weaker-than-expected US ISM manufacturing data, which boosted expectations of a Fed rate cut. However, profit-taking quickly pushed prices down to $3,334 before recovering to $3,342.
📉 Technical Analysis:
• Key Resistance: $3,351
• Nearest Support: $3,334
• EMA: Price is above EMA 09 → uptrend still intact.
• Candles / Volume / Momentum: H1 candle shows a long upper wick, indicating selling pressure near the recent high. Bullish momentum is slowing, and volume has started to normalize.
📌 Outlook:
Gold may face a short-term pullback if it fails to break above $3,351 and the USD strengthens during the US session.
________________________________________
💡 Suggested Trading Strategy:
🔻 SELL XAU/USD at: $3,345 – $3,350
🎯 TP: $3,334
❌ SL: $3,353
🔺 BUY XAU/USD at: $3,332 – $3,334
🎯 TP: $3,350
❌ SL: $3,323