Goldprice
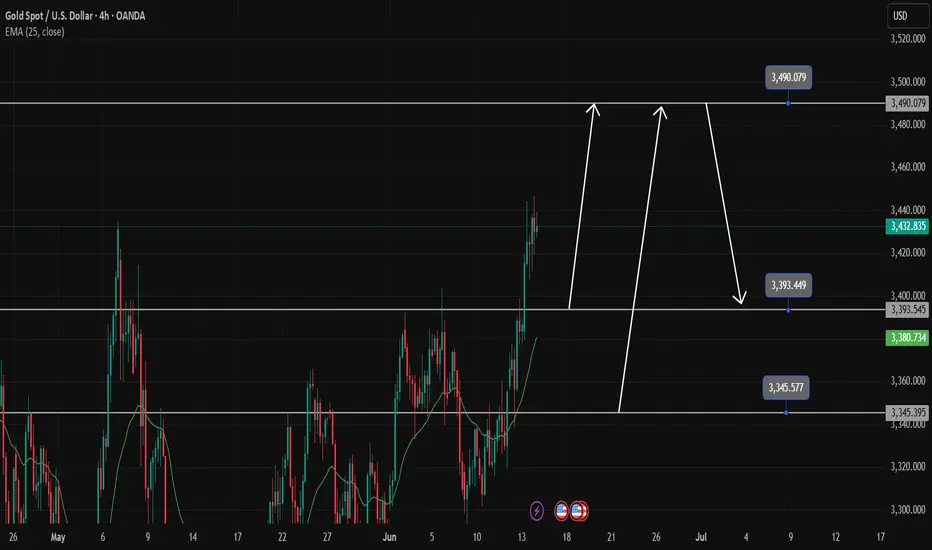
Gold price is sure to make ATH in the new weekGold confirms a long-term uptrend. The ATH 3500 zone is likely to have a reaction before 3490.
Any pullback in Gold next week is still considered a good opportunity to Buy Gold. And the bullish price gap is likely to continue on Monday.
3495 and 3345 are accumulated with many people waiting to Buy there, setting up a Buy signal with SL 10 price at the weekly support and resistance zones.
The possibility of breaking ATH next week is very high
Support 3393-3345
Resistance 3490
Gold Poised to Shine - 18% Upside Projected by Completing Wave 5Gold is currently trading around 494.92 RMB per gram in China as of July 25, 2023. Based on the technical analysis on XAUCNY showing we are currently in wave 5, subwave 4 of an upward trend, the prediction is that by January 2025, the price for 1 ounce of gold will reach 16575 RMB.
Given that 1 ounce equals 28.3495 grams, a price of 16575 RMB per ounce implies that the price per gram of gold is expected to reach around 584 RMB by January 2025.
This represents an increase of approximately 18% from the current price of 494.92 RMB per gram. Going from subwave 4 to subwave 5 typically signals the final leg of an advancing trend before it completes the larger degree wave 5. If the analysis is correct, we can expect the 18% price increase to occur over the next 1.5 years as gold enters the terminal subwave 5.
The ongoing expansionary monetary policies by central banks globally serves as a key driver supporting higher gold prices. High inflation levels in many economies incentivizes investors to allocate more funds to gold as an inflation hedge. Geopolitical tensions, such as the Russia-Ukraine conflict also increase safe-haven demand for gold.
While risks remain, such as potential interest rate hikes that strengthen the dollar, the overall backdrop still seems conducive for higher gold prices. From a technical perspective, the upside projection toward 584 RMB per gram over the next 1.5 years aligns with the view that subwave 5 will see accelerating upside momentum toward completing wave 5.
In summary, based on current technical analysis, the prediction is that gold will reach 584 RMB per gram by January 2025, an 18% increase from today's levels, as it completes the final wave 5 uptrend over the coming months. The macroeconomic and geopolitical environment also seem supportive of this view.

GBPUSD will continue to rise and break last week's highGBPUSD is correcting lower in the range at the end of the week. This pullback is heading towards the 1.350 support. There will be a bullish reaction at this area. Or if the selling pressure really takes over the market at this support area, then pay attention to the 1.346 bottom for the BUY strategy of this currency pair.
On the other hand, 1.360 will prevent the price increase. It will act as strategic resistance before a new extended breakout to the upside.
The uptrend is more likely to continue than the downtrend, so prioritizing BUY signals will bring better profits to the currency pair.
Support: 1.350, 1.346
Resistance: 1.360, 1.366

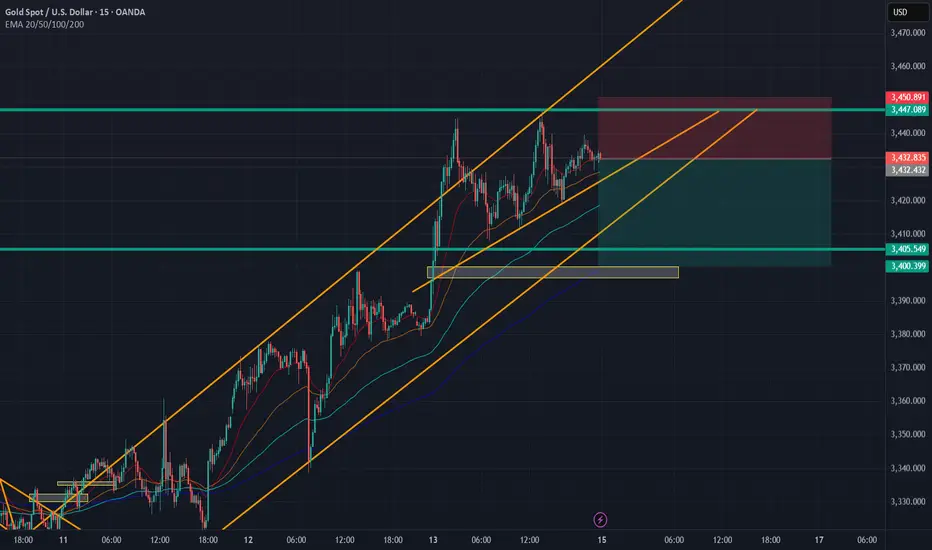
Gold Extends Rally as New High Emerges📊 Market Overview:
Gold reached a new intraday high at $3,447 today, supported by a weaker USD and stable U.S. Treasury yields. Prices then pulled back slightly to $3,423 amid short-term profit-taking. Ongoing geopolitical uncertainty and expectations that the Fed may hold or cut rates continue to drive demand for safe-haven assets like gold.
📉 Technical Analysis:
Key Resistance Levels:
• $3,447 – Intraday high on June 13
• $3,465 – Strong Fibonacci extension resistance
• $3,480 – Next upside target if price breaks above $3,447
Key Support Levels:
• $3,423 – Current price and intraday congestion zone
• $3,410 – Minor support on the H4 chart
• $3,400 – Psychological support & 20-day MA
• EMA: Price is trading above the 09-day EMA → short-term trend remains bullish
• Candlestick / Volume / Momentum:
Strong bullish candle with high volume; RSI at 67 indicates further upside potential. Short lower wicks suggest limited selling pressure. MACD on both H4 and daily charts favors continued upside momentum.
📌 Outlook:
Gold is likely to continue rising if it holds the $3,410–$3,423 support zone. A break above $3,447 may open the path toward $3,480 or higher.
💡 Suggested Trading Strategy:
🔺 BUY XAU/USD:
• Entry: $3,420 – $3,425
• 🎯 TP: $3,480
• ❌ SL: $3,408
🔻 SELL XAU/USD
• Entry: $3,445 – $3,450
• 🎯 TP: $3,423 – $3,410
• ❌ SL: $3,457

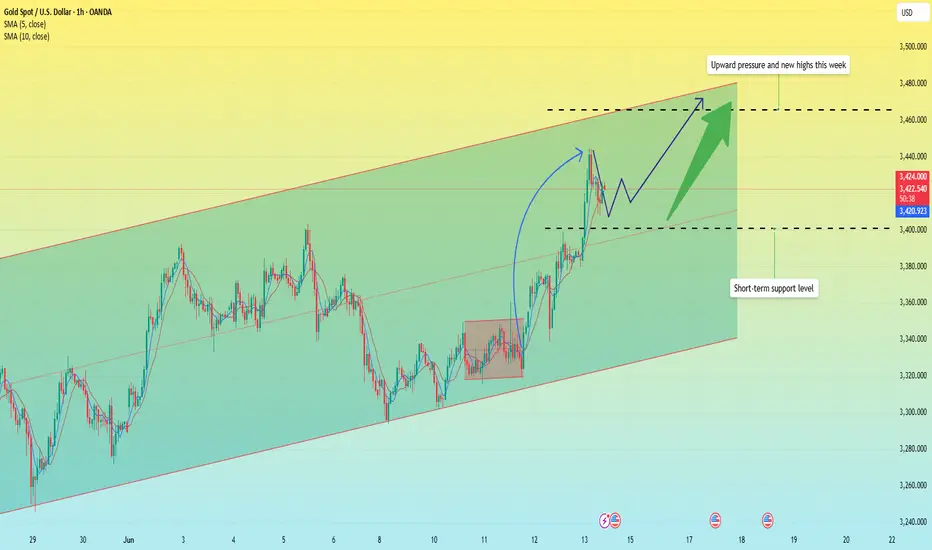
"XAU/USD Bearish Setup: Rising Channel Breakdown AnticipatedPrevious Resistance Zone (Red Rectangle):
The chart shows a clear resistance zone between ~3,340 and ~3,370 USD.
Price was rejected sharply from this zone earlier (marked by the large blue dot at the swing high).
Current Rising Channel (Blue Channel):
A rising wedge or ascending channel is forming, typically a bearish continuation pattern when found in a downtrend.
Price is currently testing the upper boundary of this pattern.
Bearish Projection (Red Path & Arrows):
The chart creator expects a rejection from the top of the channel, leading to a breakdown and a move toward the next key support at ~3,246.94 USD.
A large red arrow and projected box highlight the short setup zone with an implied favorable risk/reward ratio.
Support Target:
Blue horizontal line at 3,246.94 marks the next significant support level, likely a take-profit target for short sellers.
Macro Factors:
Three small icons indicate upcoming U.S. economic events, possibly influencing XAU/USD volatility and confirming the move.
✅ Summary:
Bias: Bearish
Pattern: Rising Channel (bearish structure)
Entry Zone: Around 3,350–3,360 USD (top of channel)
Target Zone: ~3,246 USD
Risk: Invalid if price closes strongly above the resistance zone (~3,370 USD)

Bulls are in control, and pullbacks are opportunities!Gold rose directly at the opening today due to risk aversion, reaching a high of around 3446.8. We successfully stopped profit twice when we went long. Subsequently, we also notified everyone to enter short positions at 3445 and exit with profit at 3425. Pay attention to the support situation at 3395-3408. Going long on pullbacks is still the main trend at present.
From the current gold trend analysis, today's gold mid-line pulled up and broke through and stood above the 3400 mark to further continue its strength. The short-term support below is around 3310-3408, and the key support below is around the recent top and bottom conversion position of 3395-3405. The intraday pullback relies on this position to continue to be bullish and the short-term bullish dividing line moves up to 3345-3350. The daily level stabilizes above this position and continues to maintain the trend of low-long rhythm. Be cautious about short orders against the trend. I will give you tips on specific operations, and pay attention in time.
Gold operation strategy: Buy gold when it falls back to around 3395-3405, and target around 3425-3440. If it is strong, continue to buy gold at the support of 3410-3408.
When operating, be sure to strictly set stop loss, strictly control risks, and respond to market fluctuations steadily.

Bull market continues? Beware of the possibility of a pullback📰 Impact of news:
1. The geopolitical situation between Israel and Iran deteriorates
📈 Market analysis:
In the short term, gold is expected to rise further. Relatively speaking, there is still room for further increase. If it continues to rise today, it depends on the test of 3440 points, which is the opening position of the previous decline. In the short term, pay attention to the 3340-3350 resistance. If it can break through and stay above it, the 3468-3493 line we gave in the morning can still be used as a reference, and it is even expected to reach 3500. But at the same time, the RSI indicator in the hourly chart is approaching the overbought area, so we still need to be vigilant about the possibility of a pullback.
🏅 Trading strategies:
SELL 3440-3450
TP 3430-3420
BUY 3415-3400
TP 3420-3440
If you agree with this view, or have a better idea, please leave a message in the comment area. I look forward to hearing different voices.
TVC:GOLD FXOPEN:XAUUSD FOREXCOM:XAUUSD FX:XAUUSD OANDA:XAUUSD

War triggers a surge in gold prices
💡Message Strategy
The situation in the Middle East escalated suddenly, and Israel announced a preemptive military strike against Iran, targeting facilities and military targets related to Iran's nuclear program. Explosions were heard in Tehran, the capital of Iran. Iranian state media confirmed that senior leaders of its Revolutionary Guard were killed in the attack, and nuclear scientists and military facilities were also severely damaged.
At the same time, although the United States did not directly participate in the operation, it has entered a state of high alert, and the global crude oil and gold markets have fluctuated violently due to tensions. This sudden conflict not only made the Middle East tense, but also triggered widespread concerns in the international community about regional security and the impact on the global economy.
The war has changed the recent volatility of gold. At present, gold has strongly broken through the 3,400 mark and accelerated its rise.
📊Technical aspects
From the 4-hour analysis, the gold price rose in the middle line in the morning today and stood above the 3400 mark to further continue its strength. The short-term support below is 3400-3410, and the key support below is the recent top and bottom conversion position around 3375-3385.
If it falls back and relies on this position, it will continue to be bullish. The short-term bullish strong dividing line moves up to the 3345-50 mark, with the target of 3500. The daily level stabilizes above this position and continues to maintain the same low-multiple rhythm. Short positions against the trend need to be cautious.
💰 Strategy Package
Long Position:3410-3420,3430-3440

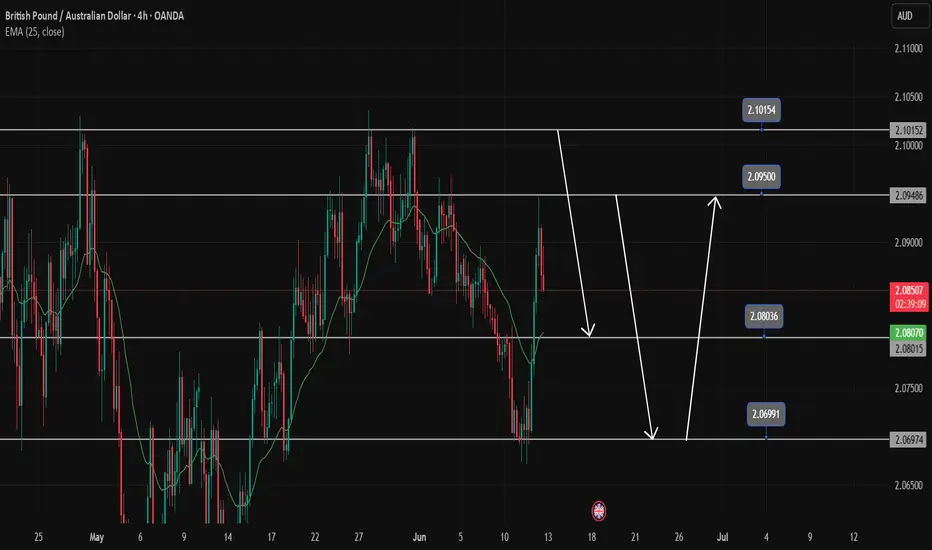
GBPAUD Trading SignalsGBPAUD is reacting at the resistance zone with this force, the downtrend will continue at 2.08000. If you want to BUY at 2.0800, you have to wait for the price reaction of the candle. If you break 2.080, you have to wait at 2.06900 for BUY strategies. In the opposite direction, the peak of 2.101 is still an important peak where you can execute the SELL strategy with the GBPAUD currency pair.
After the Pullback, Gold May Head Toward the 3500 Mark📊 Market Overview:
Gold surged to 3444 during the Asian session on rising expectations of an early Fed rate cut after softer-than-expected US CPI data. However, profit-taking pushed prices back to the 3425 zone.
📉 Technical Analysis:
• Key Resistance: 3444
• Nearest Support: 3403 – 3406
• EMA 9: Price remains above EMA 9 → trend is still bullish.
• Momentum & RSI: RSI has cooled off from near-overbought territory (~70), suggesting a short-term pullback may occur.
📌 Outlook:
Gold may correct slightly toward support before resuming its upward trend if the 3403–3406 zone holds firm.
💡 Suggested Trading Strategy:
🔻 SELL XAU/USD at: 3440 – 3444
🎯 TP: 3420
❌ SL: 3449
🔺 BUY XAU/USD at: 3406 – 3403
🎯 TP: 3426
❌ SL: 3399

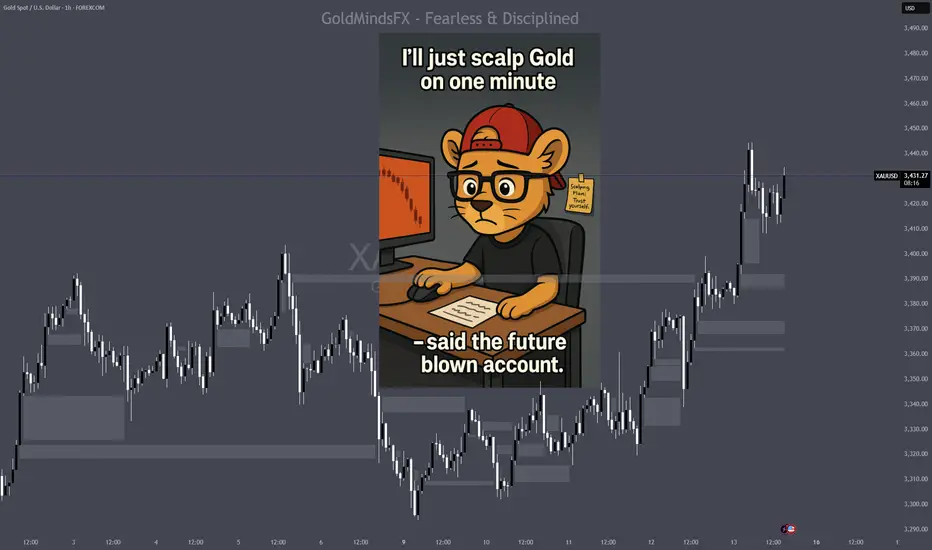
XAUUSD - Emotional Scalping on Gold Leads to Blown Accounts📔 “I’ll just scalp Gold on the 1-minute” — said the future blown account
Gold doesn’t care about your emotions.
It doesn’t care that you think you can catch a move before it happens.
And it definitely doesn’t care about your $50 dream from a 20-pip scalp.
Real Gold traders don’t come for 20 pips.
They come for precision, for structure, and for 80–100 pip setups backed by real confluence.
If you’re pressing buttons on the 1-minute because you “feel it,”
you’re not trading Gold — you’re feeding it.
And it will eat you alive.
⭐1. Gold is Not a Currency Pair — It’s a Metal with a Temper
You’re not trading EURUSD.
You’re trading a metal — one of the most reactive and manipulated instruments in the market.
Gold doesn’t respond like a normal pair.
It reacts like a sensor. A trigger.
🔸 Geopolitical tension? It spikes.
🔸 USD news? CPI, NFP, FOMC — massive moves.
🔸 Imbalances and inducement zones? It respects them with surgical precision.
🔸 Thin liquidity or Asian session? Expect the unexpected.
Last night, due to a political situation Gold didn’t hesitate.
It exploded — hundreds of pips — while other pairs just twitched.
And here’s the truth:
🔱 Gold is the most loved asset on the planet.
• It’s wealth.
• It’s power.
• It’s culture.
• It’s fear and greed — in physical form.
That’s why it dominates the market.
That’s why it’s unpredictable.
And that’s why you need to approach it with respect — not emotion.
⏱️ 2. The 1-Minute Trap: Why You’re Always Late
On M1, there is no structure — only speed.
By the time you “see a pattern,” you’re already the exit liquidity.
Order blocks? FVGs? Choch?BOS?
They’re there… but barely readable in real time unless you’re hyper-trained.
You’re not early.
You’re late — many, many times.
And Gold punishes late entries without mercy.
So what should you do instead?
🧭 Zoom out. Reset. Re-anchor.
Start with D1-H12-H4-H1. Mark the structure.
Drop to M30/15/5 to refine your zones.
Then — and only then — use M1 as a trigger, not a chart to trade blindly on.
M1 is for confirmation — not discovery.
It shows behavior, not bias.
And if you treat it like a full chart, it will bury your account one candle at a time.
🤓3. If You're New — Respect the Timeframes
If you’ve been trading Gold for less than 6 months,
you don’t need more entries. You need more patience.
Work with:
✅ 1H
✅ 30m
✅ 15m
That’s where the story unfolds — clean, structured, readable.
Yes, study the lower timeframes.
Flip through M1, M3, M5, M7, M10…
Zoom in, zoom out. Train your eye.
And slowly, you’ll start to recognize the way Gold breathes — how it baits, spikes, pauses, and traps.
But execution?
Execution stays clean, until your structure reads faster than your fear.
🚨4. Gold Doesn’t Just Move Fast — It Gets You Hooked
Gold isn’t just volatile — it’s addictive.
You win once… you feel unstoppable.
Twice… now you think you’re the chosen winner.
And just like that, you’re hooked.
You start ignoring your loss, because those two wins gave you more dopamine than a full week of consistency.
You don’t even notice you’re in a loop:
→ Two wins
→ Five losses
→ One clean trade
→ Three more losses
→ Still confident… because of one high
You’re not trading structure.
You’re chasing a chemical high — and Gold is your dealer.
That’s why M1 destroys accounts.
Because the more you “almost catch it,” the more obsessed you get.
You don’t need a new setup.
You need to break the loop.
Walk away, breathe, come back and trade less.
😶🌫️ 5. If Your Mind is Not Calm — Stay Off the Chart
Gold will test your technicals — but it’ll destroy your psychology if you’re not stable.
Had a bad day at work? Argued with someone? Feeling off?
Do. Not. Trade. Gold!!
This metal feeds on instability.
It senses when you’re not focused.
And it will punish you faster than you can say “SL hit.”
💬 “You trade what you feel. So if you’re a mess inside, your chart becomes chaos too.”
🔚 Bottom Line: You Don’t Need More Trades. You Need Better Vision.
Scalping Gold on M1 sounds smart.
Feels efficient. Looks exciting.
Until you’re left with a blown account and a broken mindset.
🫶 Want to stop gambling and start dominating?
Start with patience. Stick to timeframes. Learn the rhythm.
Gold is not for the impulsive — it’s for the precise.
If this lesson helped you today and brought you more clarity:
Drop a 🚀 and follow us✅ for more published ideas.
As conflict escalates, gold is cautiously long📰 Impact of news:
1. The geopolitical situation between Israel and Iran deteriorates
📈 Market analysis:
The worsening geopolitical situation caused a surge in gold prices. The intraday short-term support points of 3420, 3402, and 3380 will all become key support for testing bulls. If the European session is strong, 3420 cannot be lost. If it falls back and loses, it will move closer to the top and bottom conversion position of 3402. If you go long later, you must pay attention to the weakening of the upward momentum. If the European session continues to break the high of 3440, then the US session can be seen around 3468-3493. If the upward momentum in the European session weakens, we need to watch out for a short-selling counterattack and a sharp decline. The geopolitical situation is unstable. Bros must strictly control SL when trading independently.
🏅 Trading strategies:
BUY 3420-3402-3380
TP 3390-3400-3420-3460-3490
If you agree with this view, or have a better idea, please leave a message in the comment area. I look forward to hearing different voices.
OANDA:XAUUSD FX:XAUUSD FOREXCOM:XAUUSD FXOPEN:XAUUSD TVC:GOLD

GOLD SPOT (XAU/USD) 4H Analysis – Bullish Momentum Breakout🔔 GOLD SPOT (XAU/USD) 4H Analysis – Bullish Momentum Breakout 💥📈
📊 Overview:
Gold has confirmed a strong bullish breakout from the consolidation zone, driven by sustained support and recent upward pressure. After rebounding from the MAIN SUPPORT zone around $3,200, price action has surged and successfully touched the 1st Take Profit (TP1) zone at $3,429.
🔍 Key Levels:
🟩 Main Support: $3,200 zone — held firm and acted as a launchpad for the bullish reversal.
📌 1st TP (Touched): $3,429 — resistance level has been tested and price is currently hovering near it.
🎯 Next Target (TP2): $3,504 — price is expected to approach this zone as bullish momentum continues.
📈 Technical Outlook:
Price structure shows a clear higher low formation followed by a strong impulse breakout.
Current momentum suggests bulls are in control, with volume and volatility increasing on the upward leg.
As long as the price remains above the $3,366 short-term support, the bias remains bullish.
🛑 Risk Note:
Watch for possible rejection near TP2.
A failure to hold above $3,366 may trigger a pullback to retest lower zones.
✅ Conclusion:
The bullish continuation scenario remains valid with potential to hit the $3,504 mark. Traders may look for long opportunities on pullbacks while maintaining tight risk management. 🔐📊

The situation escalates, and gold rises again.Information summary:
Israel issued a statement: The attack on Iran has been completed. All Israeli Air Force pilots and crew members who participated in the attack on Iran returned to the base unscathed.
Iran issued a statement: The attack could not have happened without the coordination and permission of the United States. The United States is responsible for the consequences of the Israeli air strikes.
The unpredictable international situation has caused the price of gold to continue to rise after retreating.
New forecast:
After a strong rebound in the 3338 shock area and forming a high point, it is currently in a clear upward channel. The recent breakthrough of the 3398.4 area indicates that the trend will continue and point to the resistance line near 3465. At present, the price is testing the trend line that broke above, which may become a springboard for the next round of rise.
Buy trigger point: rebound from near 3405, with strong trading volume.
Risk attention:
The possibility of triggering a false breakout trap near 3440.
If gold loses the 3380-point trend line, its momentum may stagnate.
Broader macro data could overtake technical support near resistance levels.
Gold is under pressure!OANDA:XAUUSD
My analysis is very faster working like rocket!
Now the resistance target is 3402
Length: 178
Direction: up
Quality: good
Pattern price: 3365
A potential uptick in the US CPI is not enough to rescue the dollar, with XAUUSD prices poised for a rally towards 3,400 USD.
Note: Today market is volatile for 4 extreme upcoming news, 1 from gbp, 3 from usd, So we will stop here and watching for next perfect buy entry. Thanks all

Israel attacks Iran, gold soars
⭐️Gold information:
Israel attacks Iran's capital Tehran! Gold and crude oil soar rapidly!
The Middle East bully attacks Iran, and the risk aversion sentiment affects the early trading of gold at 3380. 30 US dollars
⭐️Personal comments:
Due to the escalation of geopolitical tensions in the Middle East, market risk sentiment has slightly rebounded, and investors are more inclined to buy traditional safe-haven assets-gold
Moving towards 3480
⭐️Set gold price:
🔥Sell gold area: 3478-3480 SL 3485
TP1: $3462
TP2: $3450
TP3: $3435
🔥Buy gold area: $3375-$3377 SL $3370
TP1: $3389
TP2: $3400
TP3: $3412

Geopolitical tensions, gold prices may reach 3480 points⭐️Personal comments:
Due to the escalation of geopolitical tensions in the Middle East, market risk sentiment has slightly rebounded, and investors are more inclined to buy traditional safe-haven assets-gold
Moving towards 3480
⭐️Set gold price:
🔥Sell gold area: 3478-3480 SL 3485
TP1: $3462
TP2: $3450
TP3: $3435
🔥Buy gold area: $3375-$3377 SL $3370
TP1: $3389
TP2: $3400
TP3: $3412

Can Gold Fall from Here? Let’s Watch the $3435 Level Closely!
If today's daily candle closes below the $3435 level, the market could move down further. But if it closes above this level, there's a chance for more upside.
However, keep in mind — most of the upside liquidity has already been taken. Now, there's significant sell-side liquidity resting below.
This makes $3435 a key level to watch. So, keep an eye on where today’s daily candle closes.
Let’s watch the market together and see what it does!
📌 DYOR – This is not financial advice.

Israel attacks Iran, gold price correction can be long gold
📣Gold news
Today, Israel launched an attack on Iran, and the gold price reached a high of $3,433/ounce, the highest level since May 6, and the weekly increase exceeded 3.6%, the highest level since the week of May 19.
Spot gold continued to rise during the US trading session on Thursday, reaching a weekly high of $3,398.55/ounce. However, in the afternoon of the same day, the Chinese Ministry of Commerce stated that China and the United States reached a principled agreement on implementing the consensus of the heads of state call and consolidating the results of the Geneva talks, and made new progress in resolving each other's economic and trade concerns. Affected by the easing of the Sino-US trade situation, the safe-haven demand for gold dropped sharply, and the price fell rapidly by $30 from the high, reaching a low of $3,338/ounce. The market risk appetite has rebounded significantly, and the risk aversion sentiment has cooled significantly. Combined with the fact that the monthly and annual rates of the US CPI released in the evening were both lower than expected, indicating that inflationary pressure has not intensified. After the data was released, the market's expectations for the Fed to cut interest rates by 50 basis points before the end of the year have further increased.
📊Technical analysis:
Technically, the upper track of the daily line is still in a flat state. The current market has reached a high of around 3444. After the rise on Thursday, it is expected that there will be little room above. Since the market is in a volatile rise, it is not suitable to directly chase the rise. The 4-hour Bollinger band continues to diverge upward, and the moving average is arranged in a bullish pattern, indicating that the current market is in a strong position. If it breaks high on Thursday, there will be a chance of rising on Friday. In terms of operation, keep the idea of calling back and going long. If it falls below 3367 again, there will be repeated fluctuations.
Today's operation strategy💰
If the gold price falls back to around 3375, go long. If it is around 3370 and 3365, add more. Stop loss at 3360. Target 3420-3430
Sell short near 3430. Add shorts in batches near 3430 and 3435. Stop loss at 3440. Target 3380-3374
(If you have just entered the market, the gold market is confusing. The operation direction is always reversed. The entry price is not sure. The position is trapped. You can contact Labaron to get the gold price trend analysis And online guidance for unwinding! )
There is no unsuccessful investment, only unsuccessful operation. We have been deeply involved in the industry for more than ten years, with rich practical operation experience and unique trading concepts. We have a global and stable trading system here. We have studied gold, crude oil and other investment fields for many years, with a solid theoretical foundation and practical experience. We are good at combining technical and news operations, focusing on fund management and risk control, and have a stable and decisive operation style. We are recognized by the majority of investment friends for our easy-going and responsible personality and sharp and decisive operations. The analysis article only describes the possible future of the market and expresses opinions. It is not used as a basis for investment decisions. Investment is risky. Trading may not pay attention to reasonable position allocation, fund management and risk control. Do not trade without risk control. Don't let the transaction get out of control.

The situation escalates. Will the price of gold continue to riseEvent summary:
On June 13, Israel launched an air operation codenamed "Lion Rising" against Iran. So far, five rounds of air strikes have been launched.
As the situation in the Middle East escalates, gold has risen again due to risk aversion, directly breaking through 3,400. Gold risk aversion has increased, and there is no sign of easing for the time being, so gold risk aversion continues to rise, and gold prices are expected to continue to rise. Under the blessing of risk aversion, gold bulls have begun to dominate again.
Market analysis:
The 1-hour moving average of gold has formed a golden cross and formed an upward trend. The upward momentum of gold is getting stronger and stronger. In the early Asian session, it once surged above $3,440, only $60 away from the historical high of 3,500. The outbreak of risk aversion is entirely the release of accumulated kinetic energy. Only when it is fully released can the strength of gold bulls weaken. The decline of gold means going long. If the price of gold falls back to the support level near 3,400 during the Asian session, buy on dips.
Focus position:
First support level: 3405, second support level: 3390, third support level: 3380
First resistance level: 3440, second resistance level: 3450, third resistance level: 3470
Operation strategy:
Long strategy: Buy near 3405, stop loss: 3395, profit range: 3430-3450;
Short strategy: Buy near 3455, stop loss: 3465, profit range: 3400-3380;
If you want to trade aggressively, you can buy at the current price and wait for the price to reach a high point near 3350.

Gold May See Minor Pullback After Testing $3400📊 Market Development:
Gold surged to approach the $3,400 mark after U.S. Unemployment Claims came in higher than expected. The weak labor data increased speculation of an earlier rate cut by the Fed, pressuring the USD and bond yields, which in turn supported gold prices.
📉 Technical Analysis:
• Key Resistance: $3,400
• Nearest Support: $3,365
• EMA: Price remains above EMA 09 → bullish bias intact
• Candle/Volume/Momentum: Long upper wick on H1 suggests profit-taking near $3,400; declining volume may signal weakening momentum.
📌 Outlook:
Gold may experience a short-term pullback if it fails to break above $3,400 and the USD strengthens in the New York session.
💡 Suggested Trade Setup:
🔻 SELL XAU/USD at: $3,395–$3,400
🎯 TP: $3,375
❌ SL: $3,406
🔺 BUY XAU/USD at: $3,365–$3,370
🎯 TP: $3,390
❌ SL: $3,355

Gold Price Analysis June 12Yesterday's D1 daily frame bounced and closed above 3348. That led to a price gap today.
3375 is a resistance zone that is showing price reaction in the Asian session. If it cannot be broken at the end of the session, it is possible to set up a sell at 3355 for BUY strategies in the GAP zone.
Any price decrease today is considered a good opportunity for buying Gold to aim for 3411.
Pay attention to the 3355-3347-3338 zone for BUY signals today. Target is still 3411 but there is still 3386 which may have a reaction.
