Gold-----Sell near 3405, target 3390-3360Gold market analysis:
Yesterday's daily line closed with a big negative line, which was basically a day to kill the buying. Today's idea is to sell in the short term. The daily and weekly trends have not yet turned to selling. Although the daily line closed with a big negative line yesterday, its shape and indicators have not completely turned to selling. There is still motivation to buy in the later stage. In addition, Iran and Israel are still fighting. It is still difficult to see a deep decline in the short term. We estimate that today's Asian session will rebound slightly and then fall. If today's daily line continues to fall again, it may enter a new short-term selling mode. We are just a follower. We follow the short-term. If the short-term trend is bearish, we will rebound and sell. The daily line closes the negative Asian session and waits for the opportunity to sell.
In the Asian session, we pay attention to the suppression of the 3410 position. It is the suppression position of the shape, the suppression position of the 1-hour moving average, the central axis position of yesterday's big drop, and the suppression position of the daily line. If the Asian session stands on 3410, it may bring a new technical rise in buying. After all, the shape of the daily line is still buying. Secondly, if it breaks 3382, it can continue to sell it with a small rebound. 3405 is also a suppression, and it is also considered to sell when it is close.
Pressure 3405 and 3410, support 3282, the strength and weakness dividing line 3400.
Fundamental analysis:
Yesterday, Iran and Israel started bombing each other again, and the situation began to escalate.
Operation suggestion
Gold-----Sell near 3405, target 3390-3360
Goldprice

Will ASIA favor BULLS or BEARS?Two “if-this-then-that” scenarios
If price pushes above the recent swing high (~3 430–3 435)
→ Look for a move toward the 50% retracement zone at 3 415–3 416 (our next upside target).
If price drops below the recent swing low (~3 356–3 357)
→ It’ll likely slide down to the 21-day EMA at 3 342, which has acted like a magnet/bounce area.
Why the 21-day EMA matters
It’s sloping up beneath price (green trendline), so dips into it often spark fresh buying.
A buy-limit order around 3 342 gives you a low-risk entry with the trend still intact.
Overall bias
As long as gold stays above that rising trendline/21 EMA, the bulls remain in control.
Break the swing high → more upside.
Break the swing low → deeper pullback into support.

Gold continues to fall. Will there be a lower point?Gold is still under pressure at the integer mark of 3400. During the US trading session, the lowest point reached around 3366. For the current trend, it fell below the short-term support area of 3375, so the market has the possibility of further downward movement to test the support of 3350.
Today, Iran launched missiles again, but there was no threat to Israel at all, and all the missiles were intercepted. Under the current trend of further decline, the support position that needs to be paid attention to is 3350. At this position, you can try a long strategy, and the early support point of 3400 above has turned into an upward pressure point.
Short-term operation strategy:
Buy near 3350, stop loss 3340, profit range 3380-3390.
Above, you need to pay attention to the important pressure level of 3390-3400. The market changes violently, and you can take profits at the right position. Avoid rapid changes in market conditions and losses.

Gold Pulls Back After Testing Resistance📊 Market Overview:
Gold fell to a low of $3,374 earlier today after testing the $3,434 resistance late last week. The drop was primarily due to profit-taking near recent highs, alongside a mild recovery in the US dollar. Despite this pullback, the medium-term uptrend remains supported by expectations of upcoming Fed rate cuts and persistent geopolitical tensions in the Middle East.
📉 Technical Analysis:
• Key Resistance: $3,434 – $3,450
• Nearest Support: $3,374 – $3.360
• EMA: Price remains above both EMA 09 and EMA 20, suggesting a continuation of the short-term bullish trend.
• Candlestick / Volume / Momentum:
o RSI is holding around 61–63, no longer in overbought territory.
o MACD remains positive, though upward momentum has slowed.
o Bearish candles during the Asian session suggest lingering sell pressure near $3,430. A technical rebound from $3,374 is currently underway.
📌 Outlook:
Gold may consolidate between $3,370–$3,390 in the near term. If the $3,360 support holds, a rebound toward $3,420–$3,440 is likely. However, a stronger USD could increase downside pressure.
💡 Suggested Trade Strategy:
🔻 SELL XAU/USD at: $3,410 – $3,420
🎯 TP: $3,385
❌ SL: $3,430
🔺 BUY XAU/USD at: $3,374 – $3,378
🎯 TP: $3,400 – $3,420
❌ SL: $3,360
Gold maintains bullish trend
💡Message Strategy
Gold rebounded in shock before the US market, and the market rose. Previously, gold recorded the largest single-day drop in a month (1.4%) on Monday. After the sudden situation in the Middle East and US President Trump's warning to Tehran, the market's risk aversion demand heated up again, pushing gold prices to rebound in the Asian session.
The two-day interest rate meeting of the Federal Reserve has also become the top priority of the market. Tensions in the Middle East have heated up again. According to Reuters, Israel's air strikes on Iran's state-run TV station, Iran's threats to launch the most violent missile attack in history, and the fire of three oil tankers near the Strait of Hormuz have caused market concerns about the escalation of geopolitical conflicts. US President Trump left the G7 summit early and convened a national security meeting, which increased market risk aversion.
At the same time, ETF holdings have increased significantly. Data shows that ETFs increased their gold holdings by 136,000 ounces on the previous trading day, and the net purchase volume has reached 6 million ounces this year, reflecting that funds still have strong confidence in the future of gold. SPDR Gold ETF recorded a single-day net inflow of US$285 million last Friday, the largest scale in weeks.
In the US macroeconomics, the market generally expects the Federal Reserve to keep interest rates unchanged this week, but the focus is on Powell's speech and changes in the dot plot. As expectations of further interest rate cuts in 2025 heat up, the US dollar is still under pressure near a three-year low, and analysts believe that this will form structural support for gold in the medium term.
📊Technical aspects
The gold daily candlestick chart shows that the current trend is in a typical "rising wedge" pattern. Prices have been rising steadily along an upward trend line this year, while the upper side is suppressed by strong resistance in the 3420-3430 area. The current market is in a wait-and-see state.
The current gold market sentiment is in a "highly sensitive" stage. On the one hand, risk aversion once pushed gold to rebound rapidly, reflecting the market's extremely high pricing sensitivity to geopolitical risks; on the other hand, traders are still uncertain about the outlook for the Fed's policy, and the expectation that interest rates will remain unchanged has been fully priced in, but there are large differences in the future path of interest rate cuts.
If the results of the FOMC meeting are hawkish or Powell sends a signal that there will be no interest rate cut, and the market's risk aversion sentiment eases, gold may fall back to the key support area of 3350-3360 US dollars. Traders are closely watching the changes in the Federal Reserve's monetary policy and geopolitical situation, and at the same time be alert to the risks of "false breakthroughs" and sharp pullbacks.
💰 Strategy Package
Trend: Upward trend
Support: Around 3360.00
Resistance: Around 3420.50
Long Position:3365-75
Stop loss at 3350, take profit around 3400-3420, and trailing stop loss of 300 points.

Continue the rally, get ready for gold to return to 3443
⭐️Gold News:
Gold prices (XAU/USD) fell for the second consecutive trading day on Tuesday, retreating from the gains in the early Asian trading hours, which had briefly pushed above $3,400. A slight rebound in the US dollar (USD) continued to put pressure on the precious metal, acting as a major resistance. However, the downside for gold seems limited due to escalating geopolitical tensions in the Middle East and growing market expectations that the Federal Reserve (Fed) will further cut interest rates in 2025.
Meanwhile, the ongoing air conflict between Israel and Iran has entered its fifth day, exacerbating concerns about further escalation in the region. This ongoing geopolitical uncertainty supports demand for safe-haven assets such as gold. Investors also remained cautious ahead of the Federal Open Market Committee (FOMC)'s two-day policy meeting, the outcome of which could affect the next move of non-yielding gold.
⭐️Technical analysis:
Gold price gets liquidity from the support level below: 3385, 3373 completed, short-term downward trend breaks, gold price will soon return to above 3400.
Set gold price:
🔥Sell gold area: 3443-3453 SL 3458
TP1: $3435
TP2: $3422
TP3: $3407
🔥Buy gold area: $3358-$3350 SL $3345
TP1: $3368
TP2: $3376
TP3: $3390
Gold Potential Bullish ContinuationAfter retracing to the approx. 3370 - 3380 zone, gold still seems to exhibit signs of overall potential Bullish momentum as the price action may form a credible Higher Low with multiple confluences through key Fibonacci and Support levels which presents us with a potential long opportunity.
Trade Plan:
Entry : CMP 3393
Stop Loss : 3286
TP : 3499 (Before All Time High)

GOLD is in Retracement GOLD is in bullish trend and it can make a retracement so that would be around 3260

XAUUSD - Overtrading and Revenge Trading - Trading PsychologyFrom Chaos to Control: Mastering the Art of Balanced Trading on Gold
Trading gold is exhilarating. It’s fast, volatile, emotional — and addictive.
But what most traders don’t realize is this: it’s not the market killing your account.
It’s you, pressing buy and sell like it’s a video game.
Over-trading is the silent account killer. It doesn’t scream. It whispers:
“Just one more entry.”
“Maybe this one will finally run.”
“Let me scalp this quick pullback…”
Before you know it, you’ve taken 12 trades by noon and your brain’s fried.
🧠1. Why Over-Trading Happens: The Dopamine Delusion
Over-trading isn’t just a strategy flaw. It’s chemical. Your brain rewards anticipation of profit — not just actual wins.
So every setup, every near-miss, every “maybe I missed the move” spikes your dopamine.
That’s why you keep clicking. Not because you saw a valid setup.
Because your brain craves the rush of imagining one.
This is why traders enter in zones they never marked, skip confirmation, and rush into impulsive entries.
The market didn’t give a signal. Your nervous system did.
📉2. The Real Damage: Not Just Losing Trades — Losing Discipline
Over-trading ruins more than your account. It ruins your edge.
• You stop following your plan
• You chase liquidity like a gambler
• You get shaken out of clean zones
• You increase risk, just to “make it back faster”
And worst of all? It feels productive.
But profits don’t come from activity. They come from precision.
If you don’t reflect about your actions, you repeat the bad ones.
💸3. The Financial Fallout: Over-Trading Blows Up Accounts
Over-trading nukes your capital.
• One extra trade becomes five
• SL gets wider or invisible because your entry was rushed
• Lot size gets heavier to “speed up” recovery
• Now you’re emotional, and revenge mode kicks in...
You’re not compounding anymore.
You’re compounding mistakes.
This is how smart traders blow up challenge accounts.
This is how funded accounts get revoked.
This is how small accounts die before they grow.
Over-trading is a trap with a $0 exit.
✅4. Tactical Fixes: Trade Smart, Live Smarter
✔️ Set a daily trade cap.
Limit yourself to 2–3 trades. If you keep entering, it’s not analysis — it’s compulsion.
✔️ Split your daily risk.
Risking 0.3% total? That doesn’t mean 0.3% per trade. Break it down, or you’ll break your account.
✔️ Set alerts — not alarms in your brain.
Stop watching every candle like it’s a soap opera.
Set TradingView alerts at your key zones and walk away.
The market doesn’t move faster just because you're glued to the screen.
✔️ Take real breaks — not just chart scrolling.
Go outside. Call someone or send time with family and friends. Eat good food.
Most traders come home from work and go right back into charts like it’s their second shift.
That’s not discipline. That’s burnout.
✔️ Build a life that doesn't revolve around entries.
The more you lose, the more you trade. The more you trade, the more you spiral.
It’s just like alcohol, drugs, gambling. Dopamine up. Reality down.
And the worst part? It looks like hard work from the outside — but it feels like slow death inside.
🧨5. From Over-Trading to Revenge Mode
If over-trading is the first crack in your foundation, revenge trading is the wrecking ball.
And it never starts from logic. It starts from pain.
You had a clean setup.
You got stopped out — maybe twice.
Now you're frustrated, humiliated… embarrassed.
You’re no longer reacting to price.
You’re reacting to loss.
Revenge trading doesn’t feel chaotic in the moment.
It feels righteous.
You convince yourself, “I just need one win to get it all back.”
😵💫6. The Emotional Spiral Traders Don’t Talk About
Over-trading and revenge trading are addictive.
You’re showing up to work. You’re posting charts. You’re pretending it’s fine.
But deep down?
You're wrecked. Emotionally, financially, and mentally.
This is the side of trading no one glamorizes.
The isolation. The loneliness. The pressure. The self-blame.
This is how people burn out — not from one bad week.
But from trying to trade their way out of pain.
⚠️ Final Word
Over-trading is not a badge of hustle.
It’s the first step toward emotional dependence on the market.
And that’s the most expensive habit you’ll ever form.
If you don’t catch it early, you’ll keep blaming the market, the spread, the broker…
when the real damage was done by your own reaction.
The market doesn’t owe you anything.
So be kind to yourself and build discipline, you will win in the long run.
If this lesson helped you today and brought you more clarity:
Drop a 🚀 and follow us✅ for more published ideas.

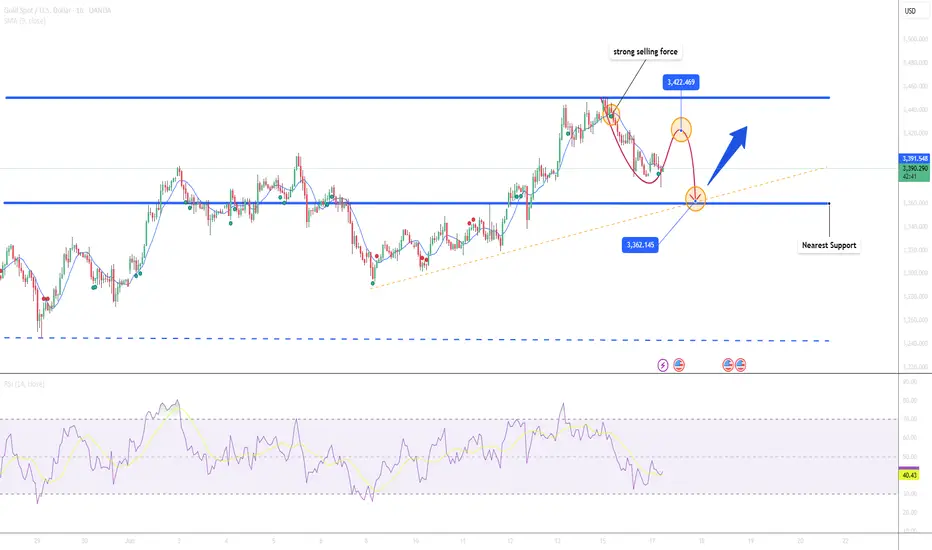
GOLD/USD Bearish Rejection at Resistance ZoneGOLD/USD Bearish Rejection at Resistance Zone 📉🟥
📊 Technical Overview:
The chart for GOLD/USD shows a clear price action behavior between a well-defined resistance zone (~3,480–3,510) and a support zone (~3,260–3,280).
🔻 Bearish Signals:
The price has tested the resistance zone multiple times (highlighted with red arrows and orange circles) but failed to break above it, indicating strong selling pressure.
The current price action suggests another lower high formation, which is a bearish signal 📉.
Recent candles are rejecting the upward move, pointing to potential downside movement.
🟩 Support Confirmation:
Previous reactions from the support zone (green arrows) show that buyers have consistently stepped in near the 3,260–3,280 range.
This level remains a key demand zone where a bounce might be expected.
🔁 Outlook:
If the price continues to reject the resistance and follows the pattern, we might see another drop towards the support area.
A break below the support zone would confirm a bearish breakout and could open the door to deeper downside targets.
📌 Conclusion:
GOLD/USD is trading within a range, but the repeated failures at resistance suggest bearish momentum might take control in the short term. A move back toward the support zone is likely unless a breakout above resistance occurs.
📉 Resistance: 3,480–3,510
🟩 Support: 3,260–3,280
🔍 Bias: Short-term Bearish unless resistance breaks

Is gold a short-term correction or a bull market turning point?Market news:
The London gold price has experienced a significant correction after hitting an eight-week high. Spot gold fell more than 1% on Monday, wiping out all the gains of last Friday. However, the escalation of geopolitical tensions in the Middle East, especially the continued conflict between Israel and Iran, still provides support for international gold prices. The upcoming Federal Reserve policy meeting has become the focus of market attention.The continued tension in the Middle East is an important driving factor for the recent fluctuations in spot gold. The conflict between Israel and Iran has escalated significantly since June 12. Israel's air strikes on the Iranian National Radio and Television Building and the Natanz uranium enrichment plant have caused serious damage to Iran's nuclear facilities. In addition to geopolitical factors, the policy trends of the Federal Reserve also have an important impact on international gold.For gold, the Federal Reserve's maintenance of high interest rates usually puts pressure on its price, because gold, as an interest-free asset, is less attractive in a high-interest rate environment. However, geopolitical risks and rising inflation expectations may offset some of the negative impacts, causing gold prices to remain volatile in the short term. Investors should pay close attention to the latest developments in the situation between Israel and Iran, the results of the G7 summit, and the Federal Reserve's economic forecasts, while being wary of the short-term impact of market sentiment and technical factors on gold prices. The monthly rate of US retail sales (commonly known as "horror data") will also be released on this trading day, and investors also need to pay close attention!
Technical review:
Technically, the daily price of gold is still running above the MA10/7-day moving average at 3364, the RSI indicator is above the value of the middle axis 50, and the price is running in the upper track of the Bollinger Band channel. The short-term four-hour chart MA10/7-day moving average high 3420 dead cross opens downward, the price pulls back to the middle track of the Bollinger Band, and the RSI indicator retreats to the middle axis. The short-term formation is a bearish shock and fall, but the gold price is still in the buying structure channel on the daily and weekly charts. The main idea of today's trading is to sell at a high price and buy at a low price! Gold began to pull back when the situation eased. The fermentation of this round of news was relatively restrained by large funds, and did not test the high point of 3500 upwards. Overall, the increase in gold prices was not large, and there was still a process of pulling. The fundamentals have not changed, and gold is still in a bull market. As we said before, if we keep above the key point of 3400, gold will continue to be bought. Now that it has fallen below 3400, the short-term has gone out of the small-level top, and the market is no longer so strong. For our short-term operations, the short-term correction of gold prices should focus on the daily cycle MA5 support and the weekly level MA5 support to buy!
Today's analysis:
Gold continues to weaken in the short term. After the rapid decline last night, the rebound strength is not strong at all. It is obvious that there is a large selling pressure above. For the market that broke the original upward trend, we also said last night that the decline is not very large. It just changed from buying to shock. Our intraday operations can be sold in the short term first!Although gold has fallen below 3400, the short-term direction has changed, but the general direction has not changed. It is still buying. In the future, we still have the opportunity to look at the high point of 3500, but we have to wait for the bottom to stabilize before we go to buy the bottom. I will say later that in the current market, we can only follow the trend. We will do whatever the market goes!
Operation ideas:
Buy short-term gold at 3383-3385, stop loss at 3372, target at 3420-3440;
Sell short-term gold at 3420-3423, stop loss at 3432, target at 3390-3370;
Key points:
First support level: 3383, second support level: 3372, third support level: 3353
First resistance level: 3418, second resistance level: 3430, third resistance level: 3450

Citigroup predicts a decline in gold prices? Blacklisted?Information summary:
Citigroup analysts predict that by the second half of 2026, gold will fall back to around $2,500-2,700, with a significant reduction in investment demand, improved global economic growth prospects, and a decline in the factors that led to the rise in gold prices due to the Fed's interest rate cut.
My point of view is: blacklist Citigroup. Since last year, they have predicted that the highest point of gold prices will exceed $4,000, and they have constantly changed the forecast point in the middle, and now they even point out that the price will fall below $3,000, which is completely unreliable.
Market analysis:
In the early Asian session, it also rose strongly, and it seems that there is a lot of upward momentum, but $3,405 is the pressure position for the top and bottom conversion, and the rise in the morning is a lure. At this position, it fell rapidly, reaching a minimum of around $3,373.
The Asian market seemed to rebound strongly in the morning, but the MA5 and MA10 moving averages showed a downward trend. This kind of market cannot wait for a decline to go long, but it is also a repeated wash-out shock. The first focus below is the 3375-3370 area, followed by 3360. The short-term trend is still dominated by wash-out shocks.
The short-term important focus position is around 3405. 3405 is used as the dividing point between long and short positions. A short-selling strategy is carried out near this position. Pay attention to the 3375-3360 area below.

Geopolitics and Fed policies dominate the trend of gold prices
📌 Gold news
On Monday, boosted by the risk aversion of the Iran-Israel war, the gold price hit a high of 3452, but the continuity was not strong, and a series of other adjustments appeared; let's briefly sort it out:
1: Adjustment: Adjustment is normal. If the market rises, if the risk aversion does not continue to exert force, then the gold price can only return to technical adjustments. Therefore, Monday's adjustment trend and the decline trend are normal!
2: Risk aversion trend: The risk aversion trend will not be reversed for the time being! Once the war starts, it will not end easily; unless the interests of both sides are not damaged, the two sides agree to a ceasefire, but at present, the hope and probability are relatively small, so the risk aversion trend is the mainstream of the current global market;
3: The direction of the Iran-Israel war is nothing more than a few possibilities:
A: The war expands, the surrounding countries stand in line, and the US and Western imperialism join the battlefield; the war expands rapidly! At the same time, Iran is forced to block the Strait of Hormuz! This is a manifestation of escalating war;
B: Both sides, as well as the forces behind them, have calculated their interests, reached an agreement, and agreed to end the war conflict; this mainly depends on Iran's attitude; is it "powerful and unyielding", continuing to oppose the United States and imperialism; or is it pro-American, completely changing its identity, or changing its identity to submit to Israel and the United States;
To sum up: risk aversion eased slightly on Monday, but the overall global market is still risk-averse; technical adjustments are normal trends; but don't completely ignore the importance of risk aversion and risk aversion control because of technical adjustments; in addition, the subsequent results of the Middle East war are nothing more than the above two; what determines all this is the attitude of both sides;
📊Comment Analysis
Although the gold price fell below 3400 and the short-term trend changed, the general direction still remains bullish. In the future, it is still expected to hit the high point of 3500, but it is necessary to wait patiently for the bottom to stabilize before choosing the opportunity to buy the bottom. The current market is changing rapidly, and investors should adhere to the principle of following the trend and flexibly adjust their trading strategies.
💰Strategy Package
Short-term gold 3383-3393 long, stop loss 3372, target 3420-3440;
Short-term gold 3420-3430 short, stop loss 3435, target 3390-3370;
⭐️ Note: Labaron hopes that traders can properly manage their funds

Gold Price Analysis June 16There is not much surprise when the price gap up appeared on Monday morning
there is no barrier that can stop the price of gold from increasing towards ATH.
Gold has a slight correction in Tokyo session after the price gap up touched the round resistance zone 3450.
The correction may extend to 3413 in European session. This is a BUY zone with the expectation that Gold will regain the ATH hook. If broken, there will be some Scalping buy zones but the risk is quite high so to be safe, wait for 3398.
3463 acts as temporary resistance for a reaction period before Gold returns to the all-time high. Maybe before 3490 there will be another price reaction before reaching the top.

The Fed’s decision may guide the direction of gold
💡Message Strategy
Gold prices fell more than 1% as traders locked in profits after hitting an 8-week high, with attention turning to the Fed's policy decision and diplomatic signals from Iran. The move puts gold on track to form a bearish closing price reversal pattern, suggesting further consolidation if no new safe-haven demand emerges.
Safe-haven demand stagnates as Israel-Iran tensions ease
Geopolitical risks from the ongoing Israel-Iran conflict have been one of the key drivers of gold's recent gains. However, as reports emerged that Iran was willing to restart nuclear talks through an Arab intermediary, market reaction became muted.
These developments led to a more than 3% drop in crude oil prices and eased inflation concerns. Despite the continued tensions in the Middle East, the change still limited further gains for gold. U.S. Treasury yields were almost flat on the day, reflecting a decline in the market's urgent demand for traditional safe-haven assets.
A weaker dollar failed to support gold's gains
The U.S. dollar index (DXY) fell to 97.685, just above last week's multi-year low. Bearish sentiment persists, and new short positions may curb any rebound.
Gold's failure to rise despite a weaker dollar indicates overall hesitation in the market. Analysts pointed out that the lack of safe-haven inflows into the dollar and U.S. Treasuries highlights that traders are more focused on upcoming central bank guidance than geopolitical factors.
Fed outlook will dominate short-term price action
Traders are now awaiting the Fed’s decision on Wednesday, with expectations that interest rates will remain unchanged, but forward guidance will be key.
Gold could face new pressure if Fed Chairman Powell turns hawkish or suggests that interest rates will remain high for a long time. Any signs of policy normalization could boost the dollar and weaken gold’s appeal. However, a dovish tone or concerns about the persistence of inflation could strengthen support for gold near technical key levels.
Gold price forecast: If the $3310 range support is effective, the bullish trend remains
📊Technical aspects
From a technical perspective, gold is testing a key support area. A drop to around $3,380 could trigger new buying; if this level is lost, it will further test the $3,350 support level.
On the upside, resistance is close to $3,450, and if bullish momentum resumes, the all-time high of $3,500.20 is still possible.
For now, the forecast maintains a cautiously bullish tone, provided that the $3,310 support level remains solid and the Fed avoids turning hawkish.
💰 Strategy Package
Long Position:3375-3380
Short Position:3410-3420

After breaking KEY DAY yesterday, it is very likely ATH in weekGold prices are being directly affected by the Israel-Iran tensions, the risk of trade conflicts due to the new US tariff policy, and concerns about slowing global economic growth. However, gold prices suddenly fell in the context of improving risk appetite of investors as they get used to the "new normal".
Daniel Pavilonis, senior commodities broker at RJO Futures, commented that if this rally starts to lose momentum, it could be a double top pattern for gold. Giving advice to investors, according to Mr. Pavilonis, they should start considering reducing their gold position at this time if they missed the opportunity to take profits at $3,509. When gold is peaking, investors see other markets moving higher, such as silver, platinum and palladium.
Best regards, StarrOne !!!

Middle East tensions ease? Prices fall?Information summary:
Iran sent a peace signal to the United States and Israel through Arab intermediaries - requiring the United States not to carry out air strikes as a prerequisite for restarting nuclear negotiations, and emphasizing to Israel that controlling violence is in the common interest.
Under the influence of this news, gold turned downward several times, reaching a low of $3,383, and then rebounded slightly. The current price fluctuates slightly above $3,400.
Market analysis:
Technical analysis shows that the current price has broken through the key resistance area of the previous high and the middle track resonance. The 4-hour chart continues to be bullish under the support of the middle track, and the short-term sideways adjustment is a normal accumulation of upward momentum.
If the integer mark of $3,400 can be maintained, the hourly chart is expected to continue the upward trend after a narrow range of fluctuations, and accelerate to a new high after breaking through; on the contrary, if this position is lost, it is necessary to be vigilant about the risk of trend reversal.
The geopolitical crisis continues to ferment, injecting medium- and long-term safe-haven demand into gold. Combined with the strong closing pattern at the weekly level, the core operation strategy should be to buy on the pullback, focusing on the 3400-line long-short dividing line. At present, the price can be arranged for long orders, and the target will be the previous high point after breaking through 3415, but the risk of falling back from the high point must be strictly prevented.
Good luck to everyone in the new week.

The situation has eased, and gold has pulled back!
Although Iran has released a signal of easing, Israel's action plan remains unchanged and the situation remains tense. Just recently, Israeli missiles attacked Iran's national news TV station.
Gold has only fallen back, and it is definitely not turning around. Gold continues to be bullish, and there are still long positions near 3400. Overall, it continues to look above 3460.
With the situation easing, it began to pull back. The fermentation of this round of news has restrained the big funds and did not test the high point of 3500 upwards. Overall, the increase in gold prices is not large, and there is still a process of pulling. The fundamentals have not changed, and gold is still in a bull market.
Today's trend is obviously still mainly washing the market. The big negative line came down and then pulled up strongly.
The bottom line is 3380.
It is obviously the support of the market and the bottom signal. This 3380 is the previous high point and the future support. At present, it is to keep an eye on this position and continue to increase positions near 3400. It's that simple.

Iran releases easing signals, gold is still bullish
📣Golden News
1. Iran sends a signal of easing. U.S. media reported that under the pressure of Israeli air strikes, Iran has used Arab intermediaries to send a peace signal to the United States and Israel - asking the United States not to carry out air strikes as a prerequisite for restarting nuclear negotiations, and emphasizing to Israel that controlling violence is in the common interest.
2. Israel's firm stance. Israeli warplanes fly freely over the Iranian capital, and Iran's counterattack is ineffective. Israel is still focused on dismantling Iran's nuclear facilities and weakening its theocratic regime, and there is no motivation to cease fire in the short term.
3. Gold's reaction and strategy. Iran's peace proposal caused the price of gold to plummet to as low as $3,382. However, since the situation in the Middle East has not eased significantly, it is recommended to buy on dips and pay attention to the support level of $3,400. ⭐️Set gold price:
🔥Sell gold area: 3465-3475 SL 3485
TP1: 3450 USD
TP2: 3440 USD
TP3: 3430 USD
🔥Buy gold area: 3390-3388 USD SL 3383 USD
TP1: 3400 USD
TP2: 3410 USD
TP3: 3422 USD

Gold continues to rise! When will the price of gold fall?Market news:
In early Asian trading on Monday (June 16), London gold prices continued to rise last week, hitting a nearly seven-week high of $3,451/ounce, as Israel and Iran launched a new round of attacks on each other on Sunday (June 15), exacerbating market concerns that escalating wars may trigger wider regional conflicts, and international gold continued to receive support from safe-haven buying.The continued rise of gold during the conflict depends on whether it is in a bull market and whether the conflict is likely to escalate. The inflow of funds into gold stock ETFs shows an increase in retail interest, especially silver outperforming spot gold, suggesting that market sentiment is turning. In addition to the geopolitical situation, this week will also usher in the test of the US retail sales monthly rate (commonly known as "terror data") and the Federal Reserve's interest rate decision.This trading day also needs to pay attention to the US New York Fed Manufacturing Index in June and the G7 Leaders' Summit, and pay attention to China's May total retail sales of consumer goods and China's May industrial added value annual rate.
Technical Review:
The technical price of gold is in good condition with the buying structure of the trend. The MA10/7/5-day moving averages on the daily chart remain open upward, the RSI indicator is hooked upward, and the price is running in the upper and middle track of the Bollinger Bands. The moving average system of the short-term four-hour chart maintains a golden cross opening upward, the price gradually moves up from the high point of the MA10-day moving average, and the Bollinger Bands remain open upward in the same hourly chart. Affected by the market fundamentals, gold has triggered risk aversion.The price of gold continues to rise, and the graphics of various time periods have formed obvious and strong support. In the daily chart, gold fell back to the trend line support after the triangle convergence breakthrough, and ushered in a rising trend again. In the short term, the upward momentum of gold is still strong. Based on the last round of retracement low of $3120 as the starting point of the wave structure, the push of the third wave may cause the price of gold to rise to $3600-3640. Combined with the current fundamentals, news and geopolitical situation, the medium- and long-term upward trend of gold is far from over.
Today’s analysis:
At present, the entire market is still affected by the geopolitical risks in the Middle East. Gold has been at a high level for a long time. If there is no turning point, the gold price will continue to remain above 3400 today. We will have the opportunity to see the gold price refresh the historical high of 3500 again today or tomorrow, and the probability is also very high. Then our operation idea is to buy to the end before the trend changes!
The trend of the gold one-hour market is still strong. From the short-term trend, it continues to maintain a high-level shock pattern, and the low point continues to rise. The high point has been continuously broken. Although the high opening and high movement of the Asian market failed to be directly continued, the high and fall back just gave us the opportunity to buy in!
Operation ideas:
Buy short-term gold at 3420-3423, stop loss at 3411, target at 3450-3470;
Sell short-term gold at 3468-3471, stop loss at 3480, target at 3420-3400;
Key points:
First support level: 3423, second support level: 3410, third support level: 3392
First resistance level: 3458, second resistance level: 3467, third resistance level: 3483

Gold----Buy near 3417, target 3440-3450Gold market analysis:
The continuous bombing of Israel and Iran for several days has allowed gold to stand on 3400 again. The big tombstone before the weekly line was wiped out, and the weekly line closed with a big positive line again, and formed a positive-enclosing-negative pattern. This is the long-term rebound caused by geopolitical factors. There is an old saying in the market that cannonballs are always worth a lot of gold. We are not sure how long the situation between Iran and Israel will last, but what is certain is that the buying situation is obvious. The next operation is to follow the buying. I estimate that gold will continue to rise this week. In addition, under such fundamentals that control the market, we must strictly carry out each order with a loss. The market will not change the trend because you resist the order. Following the trend is the kingly way.
In the Asian session, we first focus on the hourly support of 3417 and the shape support of 3419. The position of 3417 is also the watershed of strength and weakness in the short term. If it breaks, it will reach around 3407. In addition, 3451 is the top of the daily line. There was a dive at this position before. If the daily line cannot stand on it for a long time, there is also the possibility of another dive. 3407 is a hurdle in the big cycle. If it breaks, it may bring a waterfall drop.
Support 3417, strong support 3407, suppression 3451, the watershed of strength and weakness in the market is 3417.
Fundamental analysis:
There are many fundamental analyses and data in the recent period. Geopolitical factors are the main reason for its violent fluctuations. In addition, there is a holiday in the United States this week, and there is also a Federal Reserve interest rate result.
Operation suggestion:
Gold----Buy near 3417, target 3440-3450

opportunity for selling GOLDI see that gold has confirmed strong resistance, so I took a sell trade with it.

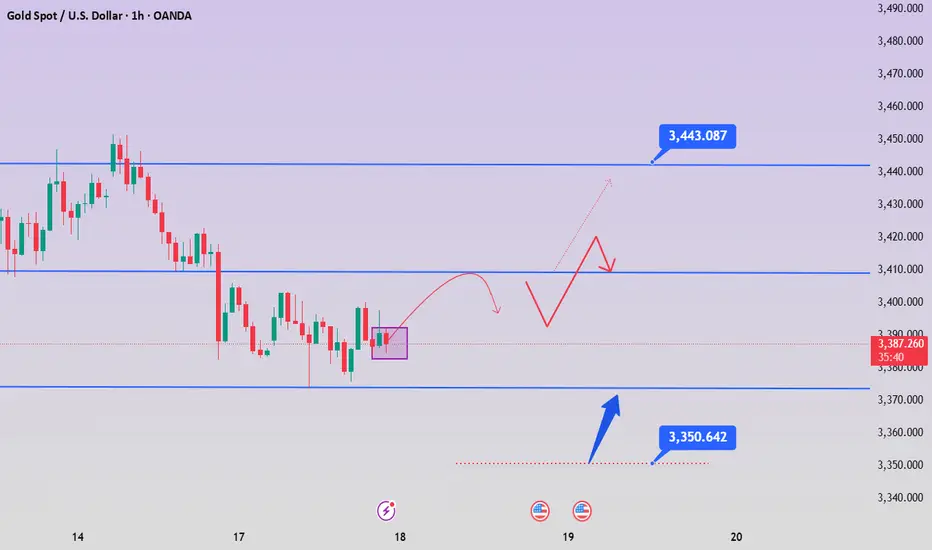
Gold May Pull Back Short-Term📊 Market Overview:
After several strong bullish sessions, gold prices are under short-term pressure as geopolitical tensions in the Middle East temporarily ease and the US Dollar shows slight recovery.
While expectations for a steady Fed policy remain, traders are locking in profits after gold tested the $3,445 resistance zone.
📉 Technical Analysis:
Key Resistance: $3,445 – $3,460
Nearest Support: $3,394 – $3,380
EMA 09: Price has dropped below the 09 EMA, signaling a potential short-term bearish shift.
RSI/Candles/Momentum: RSI is pulling back from overbought levels. A red candlestick pattern has emerged after a strong rally, suggesting a technical pullback may be forming. Trading volume is starting to decrease.
📌 Outlook:
Gold may correct lower in the short term toward the $3,390–$3,380 support zone if it fails to reclaim the 09 EMA. However, the medium-to-long-term trend remains supported by safe-haven demand and dovish Fed expectations.
💡 Suggested Trading Strategy:
SELL XAU/USD at: $3,440 – $3,445
🎯 TP: $3,420
❌ SL: $3,455
BUY XAU/USD at: $3,390 – $3,395
🎯 TP: $3,410
❌ SL: $3,380
