The decline is not complete, beware of the low point.Last Friday, the US dollar index rose and recovered the 99 mark as the non-farm data exceeded expectations and weakened the Fed's hope of cutting interest rates this year. Spot gold continued to fall after the release of non-farm data, breaking through the 3345 and 3330 levels.
Market analysis:
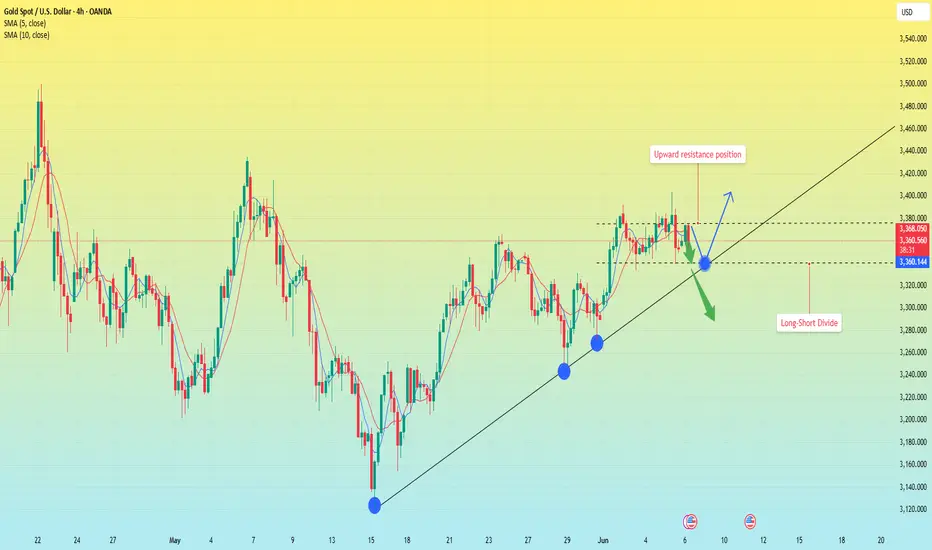
First look at the 4-hour chart of gold:
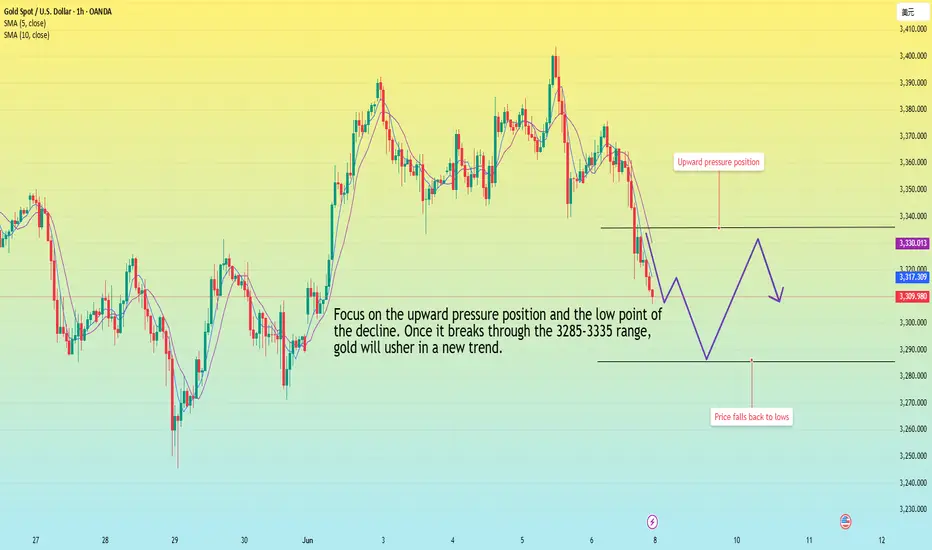
It broke through the 3300 mark in the early Asian session on Monday and is currently maintained near 3310. However, from the current point of view, the decline of gold has not been completed. From the trend point of view, gold must at least test the position near 3280 and 3250 before there will be a relative chance of rebound. Once it falls below 3250, gold may not have a chance to rebound, and it will officially enter a bearish trend, and it will be greeted by a bearish trend at the daily level.
From the hourly chart, if it cannot stabilize above 3310, then gold is likely to fall, and see whether it will break through 3280 or 3250. On the contrary, if it stabilizes above 3310, it may hit the early high near 3320 again. However, as long as it cannot stabilize above 3325, gold will still fall. Now you should pay attention to where to short gold.
Operation strategy:
If the price cannot stabilize above 3310, you can short near 3310.
If it stabilizes above 3310, you can wait for short near 3320.
Goldprice
Can Gold Reach $3400 This Week?📊 Market Overview:
On June 4, 2025, gold prices (XAU/USD) hovered around $3,370/oz after rebounding from the $3,333 level. However, selling pressure emerged as prices approached the strong resistance zone near $3,392–$3,400. Ongoing uncertainties regarding U.S.–China trade policies and expectations of a Federal Reserve rate cut continue to support safe-haven demand for gold.
📉 Technical Analysis:
• Key Resistance: $3,392 – $3,400
• Nearest Support: $3,333 – $3,320
• EMA 09: Price is currently above the 09 EMA, indicating a short-term uptrend.
• Candlestick Patterns / Volume / Momentum: The RSI on the H1 timeframe is at 59, suggesting bullish momentum remains but is approaching overbought territory.
📌 Outlook:
Gold may experience a short-term pullback if it fails to break above the $3,400 resistance level and profit-taking intensifies.
💡 Suggested Trading Strategy:
SELL XAU/USD at: $3,392 – $3,400
o 🎯 TP: $3,372
o ❌ SL: $3,410
BUY XAU/USD at: $3,320 – $3,333
o 🎯 TP: $3,352
o ❌ SL: $3,310

H4 swing order analysis for traders, Trade Swing H4 GoldH4 swing order analysis for traders, pay attention to wave 5 to confirm Long-term Sell
James Stanley, senior strategist at Forex.com, said: "I remain bullish on gold and will look for new support for the broader trend to continue.
Gold has made a new short-term high, with the price rising above $3,350/oz. Therefore, I do not rule out the possibility of this uptrend continuing and will look for new support, especially at $3,300/oz and $3,280/oz," he said.
Rich Checkan, Chairman and CEO of Asset Strategies International, said: "The current momentum favors gold and silver. While there may be some profit-taking, I expect gold to continue to rise next week thanks to the weakness of the US dollar, political tensions in the Middle East and Ukraine, the impact of tariffs and the passage of a major bill in the US that will increase public debt, leading to consumer inflation. These factors will continue to drive demand for gold as a safe-haven asset."
Adrian Day, Chairman of Adrian Day Asset Management, shared: "There are signs that North American investors are increasing their purchases of gold, although not a strong wave, but I believe this trend is gradually changing. This is a positive signal for the gold market in the future."
Best Regards StarrOne !!!

How will gold perform in the future?Market news:
In the early Asian session on Monday (June 9), spot gold opened high and fell, currently trading around $3,305/ounce. The large-scale riots in Los Angeles, the United States, attracted some safe-haven buying to support the London gold price. The stronger-than-expected US employment report hit the Federal Reserve's hopes of cutting interest rates this year, and silver once surged to its highest level since 2012. Data from the US Department of Labor showed that employers added 139,000 jobs in May, less than 147,000 in April, but more than the 130,000 increase predicted by a survey of economists. After the data was released, the financial market bet that the Federal Reserve would not cut interest rates until September, and the probability of a rate cut in September dropped from 88% to 60%. There will be two rate cuts in 2025, reducing bets on a possible third rate cut.In the next week, the market will usher in major trade negotiations and heavyweight US CPI data, which investors need to pay close attention to. In addition, US federal law enforcement officers continued to search for illegal immigrants in many places in Los Angeles County on the 7th, and had serious conflicts with local community residents for the second consecutive day. Investors also need to pay attention to the impact of market sentiment.
Technical Review:
Technically, gold plunged sharply after midnight on Friday, and the weekly line closed with a long upper shadow line and a small positive. The 3400 mark encountered resistance and fell sharply and fell into another adjustment cycle. The daily line closed with a continuous negative structure, and the New York closing price once again lost the MA10-day moving average of 3330. The price returned to the middle track of the Bollinger band at 3310, and the RSI indicator's central axis 50 value flattened! The short-term four-hour chart MA10/7-day moving average opened downward, the RSI indicator's central axis 50 value ran below, and the Bollinger band opened downward and the price ran along the middle and lower tracks. At the beginning of the week, trading focused on the rebound strength after the oversold. The main idea was to sell at a high price on the rebound, and to buy at a low price as an auxiliary.
Today's analysis:
At the daily level, the price of gold has maintained a volatile pattern in recent times. The Bollinger band opening narrowed, indicating that the buying and selling forces were stalemate. MACD fast and slow lines are above the zero axis, the spacing is narrowing and there is a golden cross trend, the red kinetic energy column is beginning to appear, the buying power is slowly gathering, the RSI indicator is around 55, and the buying and selling game is fierce! From the hourly line, the Bollinger Bands open downward, and selling is temporarily dominant.MACD dead cross operation, the green kinetic energy column continues to increase, the 5-day moving average crosses the 10-day moving average, and the short-term downward trend is obvious. However, the current support near 3300 is strong, and it rebounded after multiple dips. In the future, we need to pay attention to the breakthrough of key positions to grasp the trading opportunity.
Operation ideas:
Short-term gold 3283-3286 buy, stop loss 3275, target 3310-3330;
Short-term gold 3330-3333 sell, stop loss 3342, target 3290-3270;
Key points:
First support level: 3293, second support level: 3271, third support level: 3253
First resistance level: 3330, second resistance level: 3356, third resistance level: 3378

XAU/USD(20250609) Today's AnalysisMarket news:
Fed Harker: Amid uncertainty, the Fed may still cut interest rates later this year. Musallem: There is a 50% chance that the trade war will lead to a sustained inflation outbreak. Tariffs may push up inflation within one or two quarters. The ECB cut three key interest rates by 25 basis points. Lagarde hinted that the rate cut cycle will end, and the market is no longer fully pricing in another 25 basis point rate cut this year.
Technical analysis:
Today's buying and selling boundaries:
3330
Support and resistance levels:
3398
3373
3356
3304
3288
3262
Trading strategy:
If the price breaks through 3330, consider buying in, with the first target price of 3356
If the price breaks through 3304, consider selling in, with the first target price of 3288

XAUUSD Bullish Move Next WeekHey traders
I can see XAUUSD in Bullish side in 1d time frame
wait for market
Always wait for confirmation/strong setup for open a trade.
Thank you and Good Luck!
Happy trading.

In the new week, is gold brewing a new market?Information summary:
This week, the market continued to be affected by Trump's tariff policy and the progress of negotiations. On Thursday, the phone call between the Chinese and US heads of state boosted market sentiment. In the early stage, the precious metals market ushered in a collective rise, and the prices of silver and gold performed strongly. Silver rose to a 13-year high on Thursday, breaking through $36 for the first time since February 2012.
After gold hit the $3,400 mark during trading on Thursday, the US dollar rose as friendly talks between China and the United States stimulated the rise of the US dollar; gold fell rapidly and gave up all the gains during the day. On Friday, the US stock market closed at its highest level since February due to the boost of non-agricultural data.
Gold continued its retreat trend again, closing at around 3,310 as of Friday.
Market analysis:
From the trend of the US dollar, there is already an opportunity to bottom out, and the trend at the beginning of the week is critical.
Once the US dollar stands above 99.5 at the beginning of the week, it will continue to touch the 100.0--100.2 mark.
If it stabilizes above this position, gold will most likely fall below 3300 next week.
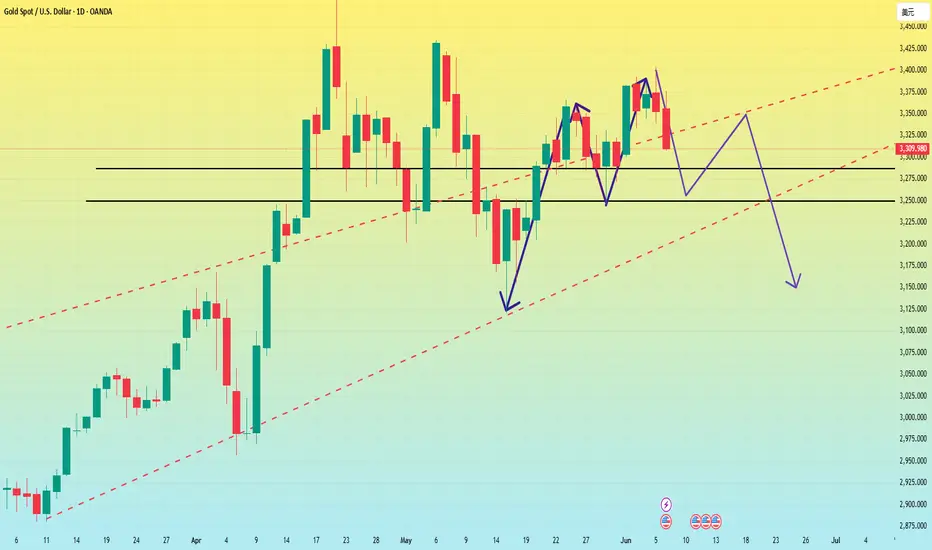
First, from the weekly chart:
The current moving average support below the weekly line is almost at 3250-3260. If it can hold here, gold may continue to maintain consolidation and wait for an opportunity to choose a new trend. However, if it falls below 3250, it can fall to the 3200 mark. If 3200 falls below again, it will be the low point of 3100.
It can also be seen from the daily chart that the important position of gold is at 3318-3280. If it stands above 3318, gold is in a bullish upward trend. If it falls below 3280, gold will enter a bearish trend. At present, gold has closed below 3318, so from the daily line, the next target is around 3280. If 3280 falls below again, then as the weekly analysis shows, it will test 3250-3260. However, judging from the daily chart, I think the market will not go down too easily.
Therefore, I guess that gold may follow the head and shoulders top structure of the daily chart next week. It may fall to 3250-3260 at the beginning of the week to lure short sellers into the market, and then stretch and rebound to around 3350 to form a shoulder position. Finally, it will directly dive down to around 3150.
The Asian market is about to open, and I hope my analysis can help everyone make some profits in the market. A new week is about to begin, and I wish you all good luck.
Gold will still fall below 3,300 next week!
📣World Situation:
Gold prices fell for the second consecutive trading day on Friday, but are still expected to close with a gain of more than 1.30% as traders readjusted expectations for Fed policy easing after a stronger-than-expected US non-farm payrolls report. At the time of writing, XAU/USD was trading at $3,322, down 0.84% on a daily basis.
The US Bureau of Labor Statistics (BLS) reported that the labor market continued to show resilience, with the unemployment rate remaining stable from April. Meanwhile, Wall Street rebounded modestly from Thursday's losses despite increased political tensions between President Donald Trump and Tesla CEO Elon Musk after the House of Representatives approved a bill to raise the US debt ceiling.
Next Wednesday: ① Data: API crude oil inventory in the United States for the week ending June 6, US May unadjusted CPI annual rate, May seasonally adjusted CPI monthly rate, May seasonally adjusted core CPI monthly rate, May unadjusted core CPI annual rate, pay attention to real-time data changes.
Geopolitical risks and trade tensions have eased, and the call between Chinese and American leaders has released a signal of easing. Trump said that the trade negotiations have reached a "positive conclusion", weakening the attractiveness of gold as a safe-haven asset.
🔥 Technical side:
Based on the resistance and support levels of gold prices on the 4-hour chart, NOVA sorted out the important key areas as follows:
Resistance: $3347, $3400
Support: $3252, $3202

Analysis of gold price trend next week!Market news:
This week (June 2 to June 6), the spot gold market has become more volatile due to the interweaving of multiple factors. Spot gold prices fell more than 1% on Friday due to the impact of strong US employment data, but still recorded a 0.8% increase for the whole week, showing the game between safe-haven demand and the strengthening of the US dollar. The trade uncertainty caused by Trump's tariff policy, the continued increase in international gold holdings by global central banks, and the tense geopolitical situation provide support for London gold prices, while the solid US employment data pushed up US Treasury yields, weakened the Fed's expectations of rate cuts, and put pressure on international gold prices. The market continues to pay attention to geopolitical risks and trade uncertainties. Silver performed even better, hitting its highest level since 2012, and platinum and palladium also recorded weekly gains. The precious metals market as a whole was driven by speculative funds. The market's uncertainty about the Trump administration's steel and aluminum tariffs and fiscal policies has driven global central banks to increase their gold holdings. And the cautious attitude of Federal Reserve officials towards rate cuts is beneficial to long-term demand for gold. Next week, the US CPI data and the progress of trade negotiations will become the focus of the market. If inflationary pressure rises, it may further push up US bond yields and put pressure on gold prices; if the data is soft, it may rekindle expectations of interest rate cuts, which is good for gold. In addition, the progress of trade negotiations and geopolitical risks such as the conflict between Russia and Ukraine will continue to affect market sentiment.
Technical Review:
From the perspective of this week's market, the high-rise and fall-down trend continued, and the low point was refreshed. The signal that gold is heading towards an extremely weak pattern is getting stronger and stronger, and selling has the capital to pierce 3300. From a technical perspective, on the weekly chart, this week's high-rise and fall closed with an inverted head, and the MACD indicator showed signs of a dead cross downward at a high level. The current pattern is conducive to continued selling! On the daily chart, two consecutive negative lines on the daily chart caused the price to run below the short-term moving average, and led to a downward trend near the 10-day moving average of 3330. The 5-day moving average also followed closely at around 3355. In addition, the upward momentum of other periodic indicators weakened, and the MACD indicator showed a dead cross downward pattern, so the daily chart should tend to be short. However, one thing is worth noting, that is, after the gold price rebounded at 3307 on Friday, the middle track of the Bollinger Band has moved up, which means that the buying defense has been strengthened. Therefore, while the daily line is biased towards selling, we must also pay attention to the strength of the bulls' counterattack.
Next week's analysis:
Next week's operation suggestion is to maintain the idea of selling as the main idea, supplemented by buying at low prices. For the upper resistance, pay attention to the 3328-3330 area first, and then pay attention to the 3345-3350 area. The former is regarded as the key to selling and exploring the low point, or even breaking the middle track of the Bollinger Band at 3295, which is also the low point of this week. The latter is a strong defense for selling in the short-term shock trend! In other words, selling below 3330 can complete the touch of the low point or new low next week in the short term, while selling below 3350 is still expected to test the new low, but the time period will be extended. As for the support below, focus on 3280. It is expected that it will be close to or touched at the beginning of next week, but whether it can break directly needs to be judged according to the actual trend, so it is best to wait for it to touch or break once before taking more. The 1-hour moving average of gold has formed a dead cross downward, so gold still has downward momentum. After the 1-hour high box of gold oscillated, gold finally broke through the box downward, indicating that gold is better sold. Then the bottom of the gold box has now formed resistance, and the short-term 3333 line of gold has formed resistance to gold. If gold is under pressure at 3333 at the beginning of next week, then gold can continue to be sold.
Operation ideas:
Buy short-term gold at 3277-3280, stop loss at 3268, target at 3310-3330;
Sell short-term gold at 3330-3333, stop loss at 3342, target at 3300-3280;
Key points:
First support level: 3300, second support level: 3280, third support level: 3261
First resistance level: 3330, second resistance level: 3348, third resistance level: 3375

GOLDGOLD is getting ready to go the reaction level before giving us further upside.
Disclosure: We are part of Trade Nation's Influencer program and receive a monthly fee for using their TradingView charts in our analysis.

Gold May Undergo Short-Term Correction Near Resistance Levels📊 Market Overview:
As of June 6, 2025, gold prices have surged, trading around $3,373 per ounce, up $26.63 from the previous session . This increase is driven by weaker-than-expected U.S. job data, with initial jobless claims rising to 247,000, surpassing the forecast of 236,000 . This has heightened expectations that the Federal Reserve may consider cutting interest rates in the near future.
📉 Technical Analysis:
• Key Resistance Levels: $3,390 – $3,430
• Nearest Support Levels: $3,340 – $3,300
• EMA: Gold prices are currently above the 09 EMA, indicating a sustained upward trend.
• Candlestick Patterns / Volume / Momentum: The RSI on the 4-hour chart is at 58.27, suggesting that while bullish momentum persists, the market is approaching overbought territory .
📌 Outlook:
Gold may experience a short-term correction if U.S. employment data is strong, reducing expectations for Fed rate cuts. However, the long-term uptrend remains supported by safe-haven demand and central bank purchases.
💡 Suggested Trading Strategy:
SELL XAU/USD at: $3,430
o 🎯 TP: $3,400
o ❌ SL: $3,440
BUY XAU/USD at: $3,330
o 🎯 TP: $3,360
o ❌ SL: $3,220

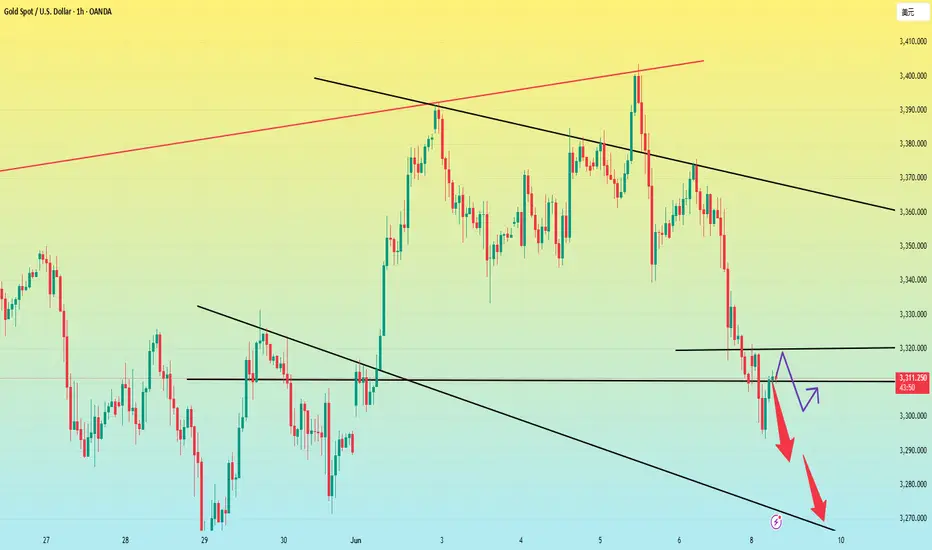
Gold plunges, what will be the trend next week?From the daily chart:
Since the last round of breaking the triangle convergence oscillation and breaking the trend line, gold has surged to 3400, but the upward momentum is insufficient and it has retreated. The low point of the retreat on Friday happened to be the support level of the previous triangle convergence trend line near 3300. If it falls below, the price will return to the triangle convergence oscillation range, and the gold price may fall further;
From the perspective of gold 1 hour, the MA5-day and 10-day moving averages have formed a dead cross downward, so gold still has downward momentum. After the gold 1-hour high box oscillation, gold finally broke through the box downward, indicating that the gold shorts are better, so the bottom of the gold box has now formed resistance, and the gold short-term resistance to gold has been formed near 3335. If gold is 3335 at the beginning of next week, then gold can continue to be short.
Next week's operation strategy is still around the 3285-3335 range.
XAUUSD – NFP STORM AHEADXAUUSD – NFP STORM AHEAD: WILL GOLD BREAK HIGHER OR FACE A DEEP CORRECTION?
Gold is entering a critical phase ahead of tonight’s Non-Farm Payrolls (NFP) report — one of the most influential economic releases globally. With US-China trade tensions resurfacing and growing concerns over US national debt, the precious metal market is likely to experience high volatility during the US session.
🌍 MACROECONOMIC & POLITICAL OUTLOOK
Trade negotiations between the US and China have resumed, with China reaffirming its intent to defend strategic metal exports amidst ongoing tariff threats.
The US national debt is projected to reach $55 trillion by 2034, prompting central banks worldwide to continue stockpiling gold as a hedge against fiat devaluation.
Fed Chair Jerome Powell maintains his stance of “not rushing to cut rates,” but political pressure — especially from former President Trump — is escalating rapidly.
Unemployment Claims fell slightly last week, reinforcing the view of a weakening labour market. If tonight’s NFP print disappoints, gold may surge on renewed expectations of future Fed easing.
📈 TECHNICAL ANALYSIS (H1 – EMA 13/34/89/200)
Gold has formed a classic impulsive wave structure, with recent highs tested around the 3408 – 3410 resistance zone.
Price action is consolidating near the EMA 89 and EMA 200, suggesting indecision and building energy for a potential breakout.
A breakdown below the 3344 – 3332 support zone could trigger a move toward the FVG liquidity block near 3320, a potential institutional buy level.
🔍 STRATEGIC KEYLEVELS TO WATCH
Resistance levels: 3380 – 3392 – 3408 – 3436
Support levels: 3365 – 3350 – 3344 – 3332 – 3320
🧭 TRADE SETUPS
🔻 SELL ZONE: 3408 – 3410
Stop Loss: 3415
Take Profit: 3404 → 3400 → 3395 → 3390 → 3380 → 3370 → 3360 → 3350
🔵 BUY ZONE: 3318 – 3316
Stop Loss: 3310
Take Profit: 3322 → 3326 → 3330 → 3335 → 3340 → 3350 → 3360 → ???
✅ CONCLUSION
Gold is “holding its breath” before the potential NFP-triggered breakout.
If NFP disappoints → USD weakens → Gold could explode above 3410.
If NFP beats expectations → Sellers may take full control and shift the market into a correction phase.

Gold layout on the eve of non-agricultural
💡Message Strategy
Gold has experienced the baptism of war, the first round of interest rate cuts by the Federal Reserve, and the stimulus of trade tariffs, and has reached a high of $3,500 in one fell swoop. What kind of support is needed for the next round to continue to rise? Obviously, on the first day, the US dollar must fall before gold can rise.
The only condition for the dollar to fall is that the Fed cuts interest rates and releases the dollar. At that time, the US stock market will continue to rise and remain strong, and commodities will continue to rise. Behind this, inflation will be re-stimulated, but the premise is that the inflation problem is controllable, which is exactly what the Fed needs to balance. On the contrary, Trump hopes for superficial prosperity, which is why Trump called on the Fed to cut interest rates as soon as possible, but the Fed did not do anything.
📊Technical aspects
Today's main strategy non-agricultural layout ideas
ADP data is bullish for gold, and gold will rise in the short term. Once it goes sideways at a high level, even if tomorrow's non-agricultural data is positive or negative, the probability of gold changing is very high. The positive news at a high level will inevitably limit the upward momentum. In addition, near $3,400, it will inevitably trigger profit-taking. Therefore, it is unwise to chase the rise in the current situation.
If the non-agricultural data is negative, gold may fall sharply. At present, around $3,370, the idea of looking at a periodic correction remains unchanged. Around $3,370-3,390, the layout is still based on the high-altitude idea.
💰 Strategy Package
Short Position:3355-3365,3375-3395

Silver Rising on Weak Dollar, Soft NFP, and Gold StrengthSilver continues to push higher, driven by a combination of macro and technical tailwinds. The latest US Nonfarm Payrolls (NFP) report showed weaker-than-expected job growth, reinforcing expectations that the Federal Reserve may stay on hold or even tilt dovish. As a result, the Dollar extended its slide, providing a strong tailwind for precious metals.
Gold remains firm near record highs, and Silver is starting to catch up, gaining momentum both as a safe-haven asset and an industrial metal. The weaker Dollar environment boosts Silver’s appeal, while softer labor data raises hopes for looser financial conditions ahead.
Equity markets are also rising, reflecting a positive outlook on economic growth and demand. This supports the industrial side of silver, especially with rising consumption in solar, electronics, and EV-related industries.
Technically, silver is testing resistance near USD 37.50. A clean break above this level could open the path toward USD 39.00 and beyond. While RSI suggests short-term overbought conditions based on the daily chart, dips toward USD 35.00 – 36.00 would likely attract buyers.
The combination of soft US data, weaker Dollar, strong Gold performance, and firm equity markets points to sustained upside potential. Watch for follow-through above USD 37.50 to confirm the next bullish leg.

GOLD ROUTE MAP UPDATEHey Everyone,
A great finish to the week with our 1H chart idea finishing off with the rejection from 3389 with no further cross and lock above that level confirming the rejection. We continued to see a drop into the lower Goldturns with each level giving 20 to 40 pip bounces.,
We are now seeing 3334 Goldturn being tested. Lets see if we get the 20 to 40 pip reactional bounce before close of play.
We’ll be back now on Sunday with our multi-timeframe analysis and trading plans for the week ahead. Thanks again for all your likes, comments, and follows.
Wishing you all a fantastic weekend!!
MR GOLD

Why Guess When You Can Snipe? | Gold Battle Plan – June 6, 2025👋 Hey Gold warriors —
It’s NFP Friday, the chart is loud, and the trap zones are alive. Today isn’t about guessing direction — it’s about reacting to structure like a tactician. Let’s break it all down, level by level 👇
📊 BIAS Breakdown – Multi-Timeframe
📅 Daily Bias: Neutral-to-Bullish
Rejection wick formed off 3343 HL
Still trading inside premium → caution on longs
Bias stays bullish above 3343 — watch for push into 3399–3412
⏱ H4 Bias: Bearish Structure, Bullish Momentum
LH still valid at 3399
Price pushing up from H4 OB around 3343
Bullish EMAs → but still in supply region = danger zone above
🕐 H1 Bias: Bullish
BOS confirmed from 3355
HL support at 3343 remains clean
Bullish continuation valid toward 3399 if price doesn’t break 3343
🧠 Battle Plan – Intraday Zones
🔐 Zone Type 📍 Key Levels 🎯 Game Plan
🔼 SELL ZONE 1 3398–3412 HTF supply + FVG. Short if M15 shows reversal — scalp to 3343
🔼 SELL ZONE 2 3378–3385 LH retest. Only scalp if 3398 doesn’t break
🔽 BUY ZONE 1 3343–3350 HL + OB zone. Look for M5/M15 BOS to long to 3385
🔽 BUY ZONE 2 3320–3332 Strong discount zone. OB + CHoCH origin. Expect reaction
🔽 BUY ZONE 3 3288–3302 Only valid if full flush — use confirmation only!
⚔️ Sniper Scenarios
✅ Buy A → Hold 3343 → long to 3378/3390
✅ Buy B → Reclaim 3332 → long scalp toward 3375
❌ Sell A → Spike 3398–3412 → M15 shift → target 3342
❌ Sell B → Reject 3385 → short to 3350 (scalp only)
💬 Final Word from GoldFxMinds
Today’s battlefield is volatile, but the map is clear.
We don’t gamble. We plan, we wait, we snipe.
⚠️ Don’t chase candles. Don’t react emotionally.
🎯 Let price show its hand — then strike with logic and precision.
👇 If this plan keeps you sharp:
👍 Smash that like
💬 Comment your bias below
📍 Follow for more sniper blueprints
— GoldFxMinds 💛

GOLD - Buy the dips toward the 50% / 61% retracement...the decline from the 22nd of April is in a very clear 3 waves with a perfect 100% retracement. the subsequent rally from the 15th of May is in a clear motive sequence. negative RSI divergence signals that some sort of 5th wave is complete.
the characteristics of this motive rally seems like a wave (i) of V is complete and we are now looking for a drop to complete wave (ii) of V.
buying dips toward the 50% / 61% retracement is my preferred strategy for now.
a rally and daily close above 3400 would invalidate this analysis. keep in mind possible volatility due to upcoming event risk.

Gold Overview Strategy June 6The 3-candle D1 cluster did not close above 50% of the main bullish candle on Friday last week. Today's main view will be to BUY to 3413.
Today's resistance is around 3413 for the SELL strategy of the US Session. The Asian-European session is looking for a BUY point. There was just a nice BUY wave around 3363 where the price swept liquidity to 3359.
3382 is the target for the BUY order and this area can SELL Scalp in today's Asian-European session for a recovery wave because today's target is up to 3413 according to the bullish structure.
In the direction of Gold Down, contrary to our analysis, the support zone 3341 and support 3324 will support the upward force of gold prices.
The breakout boundary zone 3382 and 3341. Pay attention to breaking out from important resistances, then do not trade against the trend.
Resistance: 3373-3382-3399-3413
Support: 3357-3341- 3325

Long and short battle break out before NFP,gold operation layout📰 Impact of news:
1. NFP data released
2. Geopolitical situation worsens
3. Trump and Musk start a war of words
📈 Market analysis:
During today's U.S. trading session, we need to pay close attention to the impact of NFP on the market. Bros who trade independently must do a good job of risk control. The gold 1H chart shows that the current gold price is suppressed by the downward opening of the Bollinger Bands. Gold shorts dominate in the short term, and the MACD indicator has a tendency to form a death cross. At the same time, the 5-day moving average and the 10-day moving average form a death cross and move downward, indicating that the gold price is still facing adjustment pressure in the short term. Looking at the 4H chart, we can find that although gold is currently rising on the 4H trend line, gold has not yet fallen back to the right level. Therefore, we cannot rule out the possibility that gold will continue to fall back in the future. The key resistance level above is 3390-3400, and the support level below is 3350-3340, with a focus on the important support level of 3330. Participate in high-altitude and low-multiple in the European session today, and consider retreating to 3350-3340 to place longs
🏅 Trading strategies:
BUY 3350-3340
TP 3365-3385-3395
If you agree with this view, or have a better idea, please leave a message in the comment area. I look forward to hearing different voices.
TVC:GOLD FXOPEN:XAUUSD FOREXCOM:XAUUSD FX:XAUUSD OANDA:XAUUSD

XAUUSD:Go long in batches
Gold in recent two days of strong performance in Asia and Europe, the US is slightly weak, the shock range expanded, below 3340-45 is the rise point of these two times, currently back to around 3365, although the price back before, but the income did not expand. At present, gold is not a strong one-sided rise, is still volatile up, near this position into the long order to hold, is expected to break the probability of today's data is small.
On the trade, buy long in batches around 3365 and 3340-45, and look above the target at 3390-92 first
Trading Strategy:
Long orders near 3365 continue to hold
3340-45 can buy long orders twice
TP:3390-92
↓↓↓ More detailed strategies and trading will be notified here ↗↗↗
↓↓↓ Keep updated, come to "get" ↗↗↗

Before the non-agricultural data, gold is waiting for the trendToday, the market will focus on the US non-agricultural employment data. The market expects that 130,000 new jobs will be added and the unemployment rate will remain unchanged at 4.2%. If the non-agricultural data is far worse than expected, it may continue to hit the US dollar and stimulate a sharp rise in gold prices. On the contrary, if it is higher than expected, it may also cause the US dollar to rebound, and gold will continue to maintain the possibility of low consolidation.
Yesterday, the US stock market collapsed across the board due to the debate between Trump and Musk. Therefore, I am worried that Trump will continue to make remarks to boost the US stock market today. Once the US stock market rebounds again, gold may continue to fall, or remain at a low level for consolidation.
From the 4-hour chart, it can be seen that gold has been rising along the 4-hour trend line. However, from the current chart, gold has not yet stepped back. Therefore, it is not ruled out that gold will continue to step back to 3330-3340 and then choose a direction again. 3330-3340 is a critical position. Once it falls below 3330 again, it is very likely to directly touch 3300. On the contrary, if it stabilizes at 3330-3340 again, then gold will definitely stabilize above 3400 if it goes up again.
Secondly, from the perspective of the US dollar:
The bottom divergence structure appears here in the 4-hour chart. Therefore, once the divergence of the US dollar takes shape, it will also cause gold to return to a low level again.
Therefore, be careful when going long on gold today. The position where you can go long today is in the range of 3330-3340. Secondly, if gold falls below 3330 today, it will test around 3300, so another long position for gold is around 3300. On the contrary, if it falls below 3300, there will be no chance to go long on gold, and the subsequent decline may accelerate.
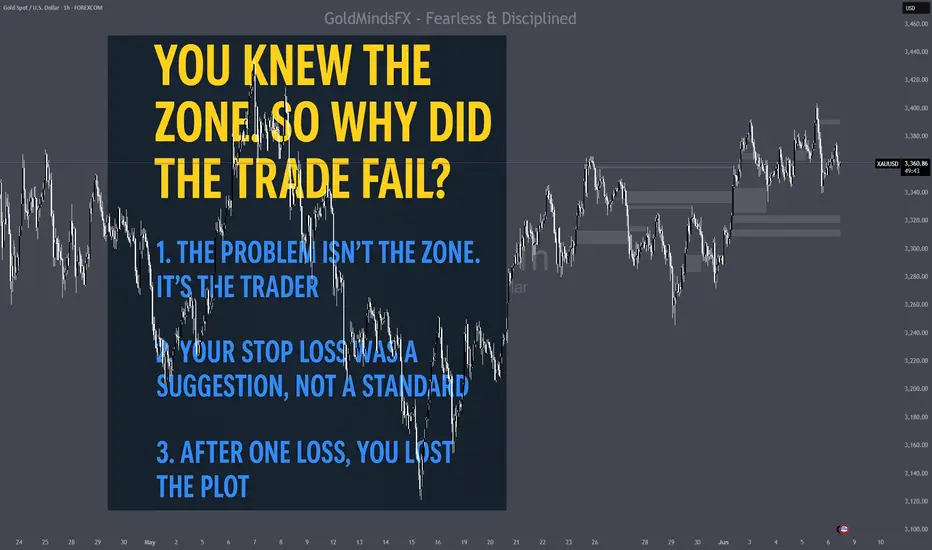
Gold execution psychology - why do your trades fail on XAUUSD?🎯 You Knew the Zone but the trade failed.
Execution psychology for Gold traders who are tired of guessing.
You marked the zone.
You waited for price to tap into it.
Maybe you even caught a reaction — but the trade failed anyway.
Not because the zone was wrong.
Because the execution broke down.
🧠 1. The Problem Isn’t the Zone. It’s the Trader.
There are two valid entry styles:
🔹 Bounce Entry
→ Enter on first touch of the zone
→ Works best when:
• Structure supports your bias
• Liquidity has been swept
• You're using a refined zone (OB, FVG, confluence)
→ SL must sit outside the zone — not inside it
→ Fast entries, fast rejections — but high responsibility, not for beginners.
🔹 Confirmation Entry
→ Wait for CHoCH or BOS on M5/M15
→ Enter on the retest
→ Cleaner invalidation, but slower execution
→ Less drawdown, but requires patience
⚔ 2. Your Stop Loss Was a Suggestion, Not a Standard
Gold isn’t EURUSD.
This pair moves 100–300 pips in minutes — and it will wipe out shallow SLs for fun.
Your SL must sit:
• Below the OB (not inside it)
• Outside the liquidity sweep
• Beyond the structural invalidation point
💰 Lot Size Must Match Your SL — Not Your Ego
We don’t increase lot size because we hope it will go perfect.
We always trade small — because Gold doesn’t need size to give payout.
The wider the SL, the smaller the lot.
That’s how you control risk and let price move.
We don’t chase leverage.
We prioritize precision, patience, and profit.
📉 3. After One Loss, You Lost the Plot
One trade didn’t go your way — now you’re flipping bias, skipping rules, and forcing setups.
That’s not trading. That’s emotional spending.
Real traders analyze the loss.
They re-read the setup.
They take the next trade — only if structure allows, even skip trading to the next day.
✅ So How Do You Fix It?
1. Define your entry style
2. Keep lot size small — even with 100 pip stops
3. Move SL to BE when appropriate
4. Walk away after 2 losses.
Accept that one good trade is better than 5 emotional entries, clear mind -cleaner executions.
If this lesson helped you today and brought you more clarity:
Drop a 🚀 and follow us for more published ideas.