Non-agricultural data is coming. Disrupt the market?Market analysis:
The market once again staged a long-short trend yesterday. Due to the intensification of geopolitical risks, gold has been advancing all the way. Because of the easing of Sino-US trade relations, prices have fallen sharply. From the current market point of view, non-agricultural data is the key today. After a sharp drop in the early morning, it fluctuated sideways and maintained a small rebound.
According to the ADP data on Wednesday, there is a high probability that the data will be bullish today. The support in the early trading will focus on around 3345. Under the condition that the upward trend remains unchanged, the current market prompts a risk of retracement, but it will not prompt shorts to enter the market; before the non-agricultural data, it is still a low-multiple idea.
Non-agricultural data analysis:
Non-agricultural, recently affected by tariff conflicts, employment is very bad, especially Wednesday's ADP data, which is far below expectations, and this month's non-agricultural is expected to be 130,000. Although the expectation is lower than 177,000 last month, this number is still relatively high compared to ADP.
If the data released is higher than 177,000, it will be bearish for gold, but in terms of tariffs and ADP, this possibility is extremely small. The data is higher than 130,000 and lower than 177,000, which is also likely to be bearish for gold.
If it is lower than 130,000, gold may take this opportunity to rise sharply.
I think according to Wednesday's ADP, today's non-agricultural data is likely to be lower than 130,000, and the market will rise.
Positions to pay attention to today:
First support level: 3345, second support level: 3330, third support level: 3300
First resistance level: 3375, second resistance level: 3390, third resistance level: 3410
Operation strategy:
Aggressive trading-currently long at 3370, after the release of non-agricultural data, the gold price is likely to rise above 3400 points, which is also our profit range.
Steady trading-long at around 3350, the profit range is still at 3400 points after the release of non-agricultural data.
Goldprice

Gold Price Analysis June 63 D1 candles closed without breaking through 50% of the previous bullish main candle. Today's main view will be BUY up to 34xx
Today's resistance is around 3413 for the SELL strategy of the US Session. The Asian and European Session is looking for a BUY point. There was just a nice BUY beat around 3363 where the price swept liquidity to 3369.
3382 is the target for the BUY order and this area can SELL Scalp in today's Asian and European session because today's target is up to 3413.
In the direction of Gold Down, contrary to the analysis, the support zone 3341 and support 3324 will support the upward force of gold prices.
Breakout boundary zone 3382 and 3341. Note that the break out does not block the train

Non-farm data is expected to help gold recover from its decline! Gold prices rose sharply in the Asian and European sessions yesterday, and fell in the US session. The roller coaster-like trend at the end of the day gave up all the gains during the day, falling below the 3350 mark and touching the 3339 line. The daily pattern showed a trend of first rising sharply and then falling sharply. The technical daily chart has been alternating between positive and negative for four consecutive trading days. The New York market fell sharply and tested the 7-day moving average, but the price is still running above the 10-day moving average/7-day moving average.
The Bollinger Bands on the short-term four-hour chart closed, the RSI indicator's middle axis flattened, and the hourly chart's four-hour moving average was glued. From a technical perspective, gold intraday trading is arranged with a volatile mindset, and the intraday range is arranged with reference to 3328/3388. Today's fundamentals focus on the non-agricultural employment data released by the New York market. The previous value was 177,000, and the market estimate was only 130,000. According to the estimate, it is bullish for gold/silver.
This year has always emphasized that 2025 is a strong year for gold, and gold may enter an acceleration period of long-term structure this year. Tariff trade policies, geopolitical tensions, the Federal Reserve's interest rate decision, the decline in confidence in U.S. debt, and the increase in global central bank purchases have all affected the trend of gold as a strong safe-haven tool, and gold will have room to rise. Therefore, as long as the overall environment remains unchanged, gold is still an absolute bullish trend. Therefore, no matter how it is adjusted, now is an opportunity to enter the long position.
Gold fluctuated in the 3332-3392 range in the first three days of this week. During this period, our high-altitude and low-multiple layout was completed as expected. Then, today gold will remain in this range and fluctuate upward. If it rises above 3400 and stabilizes, it will look to 3500 above; if it breaks through 3330, it will look to 3280 below. Pay attention to the fluctuations before the release of non-agricultural data. Non-agricultural data will cause an increase in liquidity, so try to avoid it.
Key points:
First support level: 3342, second support level: 3328, third support level: 3303
First resistance level: 3376, second resistance level: 3388, third resistance level: 3410
Operation ideas:
Buy: 3340-3343, stop loss: 3332, target price: 3360-3370;
Sell: 3387-3390, stop loss: 3400, target: 3370-3360;

Gold is getting ready for another uptrend!Market news:
In the early Asian session on Friday (June 6), spot gold fluctuated slightly higher and is currently trading near the 3360 mark. London gold prices rose and fell on Thursday. Earlier in the session, silver broke through the $35 mark, hitting a 13-year high, driving the international gold price to break through the 3400 mark, hitting a nearly four-week high of around $3403/ounce, but then due to the signal of easing trade tensions released by the leaders of China and the United States!At the same time, data showed that the number of initial jobless claims in the United States increased for the second consecutive week. Now all eyes turn to Friday's non-farm payrolls report. Trump again called on Federal Reserve Chairman Jerome Powell to cut interest rates on Wednesday. And the easing of trade tensions directly affected the performance of safe-haven assets. The decline in gold prices reflects the market's optimistic expectations for the progress of Sino-US trade negotiations, weakening the attractiveness of gold as a safe-haven asset!The market is closely watching the upcoming non-farm payrolls data and the Fed's meeting resolution on June 17-18 to judge the short-term direction of gold prices. On the whole, international gold still has long-term investment value under the current global economic and geopolitical uncertainties. In the short term, it may fluctuate in a relatively high range, waiting for more guidance from economic data and policy signals.
Technical Review:
Gold closed alternately in the first four trading days of this week. Yesterday, gold rose sharply in the Asian and European sessions, and fell back in the US session. The roller coaster at the end of the session gave up all the gains during the day and fell below the 3350 mark to touch the 3339 line. The daily line pattern turned from a big positive to a big negative K and closed above 3350. Technically, the daily chart has alternated between positive and negative for four consecutive trading days. The US session fell sharply and tested the MA7-day moving average, but the price is still running above the MA10/7-day moving average. The Bollinger band of the short-term four-hour chart closed, the RSI indicator's middle axis flattened, and the hourly chart's four-hour moving average was glued. The technical side of gold intraday trading is arranged with a shock idea, and the intraday range refers to the 3328/3388 layout. Fundamentals today focus on the non-agricultural data released at 20:30 in the evening. The previous value was 177,000, and the market estimated value was only 130,000. According to the estimated value, it is bullish for gold and silver.
Today's analysis:
This year, it has been emphasized that 2025 is a strong year for gold. Gold may enter an accelerated buying structure this year. Tariff trade policies, geopolitical tensions, the Federal Reserve's interest rate decision, the decline in confidence in US bonds, and the increase in global central bank purchases have affected gold as a strong hedging tool. There will be room for growth. Therefore, as long as the overall environment remains unchanged, gold is still an absolute buying trend. Therefore, no matter how it is adjusted, it is an opportunity to buy into the warehouse. This week, gold remained in the range of 3332-3392 for the first three days. During this period, we sold at a high price and bought at a low price, which was also considered to have completed the expectations. Then, on Thursday and Friday, gold will remain in this range and look up. If the rise breaks through and stabilizes at 3400, the upper side will look at 3500. If it breaks through 3330, the lower side will look at 3280. Look for fluctuations before non-agricultural data, and then look at the impact of non-agricultural data.
Operation ideas:
Short-term gold 3340-3360 buy, stop loss 3330, target 3380-3400;
Short-term gold 3387-3390 short, stop loss 3400, target 3350-3330;
Key points:
First support level: 3342, second support level: 3328, third support level: 3303
First resistance level: 3376, second resistance level: 3388, third resistance level: 3410

XAU/USD(20250606) Today's AnalysisMarket news:
The European Central Bank cut three key interest rates by 25 basis points. Lagarde hinted that the rate cut cycle will end, and the market is no longer fully pricing in another 25 basis point rate cut this year.
Technical analysis:
Today's buying and selling boundaries:
3365
Support and resistance levels
3428
3404
3389
3340
3325
3301
Trading strategy:
If the price breaks through 3365, consider buying, the first target price is 3389
If the price breaks through 3340, consider selling, the first target price is 3325

XAUUSD – Bearish Outlook from Resistance Zone📊 XAUUSD – Bearish Outlook from Resistance Zone
🕒 Date: June 5, 2025
💰 Instrument: Gold (XAUUSD)
📍 Current Price: 3,352.730 USD
🟨 Key Resistance Level
🔴 Price has sharply reacted from the 3,375–3,400 USD zone, highlighted as a strong resistance area.
📉 This zone has previously triggered significant sell-offs, confirmed again by the current bearish rejection (red arrow 🔻).
📉 Bearish Market Structure
The price structure suggests a classic lower high rejection scenario with potential for further downside:
🔻 Immediate Drop Expected
After rejection from resistance, the price shows early signs of breakdown. A minor pullback is expected before continuation.
🧭 TP1 – First Target Zone:
📍 3,245.560 USD
This level aligns with a previous demand area (light red box), likely to act as temporary support or reaction point.
🎯 TP2 – Final Bearish Target:
📍 3,127.527 USD
This blue demand zone is a major support level, previously a strong rally base (green arrow 🟢). Expect buyers to step in here again.
🔄 Trade Idea Summary
💼 Setup Type: Resistance Rejection
🛑 Bias: Bearish
📍 Entry Zone: ~3,350–3,360 USD (confirmed rejection)
🎯 Take Profit 1: 3,245.560 USD
🎯 Take Profit 2: 3,127.527 USD
🔒 Stop Loss: Above 3,400 USD (outside resistance zone)
📌 Observations:
🔁 The market repeated its previous pattern: bouncing from the blue demand zone and rejecting at the yellow resistance zone.
🧱 A solid breakdown below TP1 could accelerate movement toward TP2.
🔍 Watch for any bullish reaction around TP2 for potential reversal setups.
📉 Bias: Bearish
📆 Outlook: Short-term to mid-term swing

Gold is long near 3350 in the US market
It was at 3361 the previous second, and it reached 3348 the next second. The market was directly washing up and down. You said it would fall. It broke through 3400 directly when it rose, but then fell again. It fell directly below the 3350 bullish dividing point when it fell. The current point is around 3353.
Friday is the big non-agricultural data, and we are waiting for the non-agricultural data to be laid out again tomorrow!
Gold: BUY GOLD zone: light position operation (can add positions in batches)
$3344- $3354 SL $3339
TP around3400- 3410

Gold May Undergo a Short-Term Downward Correction
📊 Market Overview
Gold prices are hovering around $3,348/oz, with the day's low near $3,340. Weak U.S. economic data, including a decline in the services PMI to 49.9 and low job growth, have reinforced expectations of a Federal Reserve rate cut. However, gold prices have yet to break through strong resistance levels due to profit-taking and cautious sentiment ahead of the upcoming Non-Farm Payrolls report.
📉 Technical Analysis
• Key Resistance: $3,370 – $3,375
• Immediate Support: $3,335 – $3,340
• EMA 09: Price is above the EMA 09 line, indicating a short-term uptrend.
• Candlestick Patterns / Volume / Momentum:
o MACD on H4 chart shows a golden cross, supporting the uptrend.
📌 Outlook
Gold may undergo a short-term correction if U.S. employment data exceeds expectations or if there are positive developments in international trade negotiations.
💡 Suggested Trading Strategy
SELL XAU/USD at: $3,370 – $3,375
o 🎯 TP: $3,350
o ❌ SL: $3,385
BUY XAU/USD at: $3,335 – $3,340
o 🎯 TP: $3,360
o ❌ SL: $3,325

The long strategy has been successful, pullback and go long📰 Impact of news:
1. European Central Bank deposit facility rate in the eurozone as of June 5
2. Initial jobless claims data
3. Non-farm payroll data
4. Worsening geopolitical situation
📈 Market analysis:
At present, the gold price has broken through the previous highs of 3392 and 3395. There is no obvious peak signal in the short term. At the same time, as the gold price continues to rise, the lower support will also move up in the short term, and the 4HMACD has a golden cross trend. In the short term, pay attention to the 3385 support below and the 3410 resistance above. The 1H indicator is close to the overbought area. We still need to be vigilant about the risk of rising and falling. If the gold price retreats to 3390-3385, we can consider going long with a light position.
🏅 Trading strategies:
BUY 3390-3385-3375
TP 3400-3410
If you agree with this view, or have a better idea, please leave a message in the comment area. I look forward to hearing different voices.
OANDA:XAUUSD FX:XAUUSD FOREXCOM:XAUUSD FXOPEN:XAUUSD TVC:GOLD

Beware of fake gold price rises and real falls
📊Technical aspects
International gold rebounded from the bottom on Wednesday and closed up strongly again. On Wednesday morning, the gold price fell to 3345 and then rebounded quickly.
During the Asian session, the gold price reached 3370 and then fluctuated downward. In the afternoon session, the gold price reached 3350 and then fluctuated upward. During the European session, the gold price reached 3365 and then expanded the intraday decline.
On the eve of the opening of the US session, the gold price reached 3340 and then rebounded. During the US session, the gold price expanded the intraday increase and reached 3385 before a slight decline.
The number of ADP employment in the United States in May was 37,000, which was 110,000 lower than the market expectation and the previous value was 62,000.
Data is lower than expected, gold is rising? As far as gold is concerned, it is only in a wide range of fluctuations and there is still no clear direction.
Through the above trend, we can clearly recognize that gold has insufficient upward momentum. Gold can no longer meet the current short-term profit, and there is no need to deliberately pursue it. Our most important goal is to seize the market of 100-200 US dollars.
💰 Strategy Package
Short Position:3375-3380

Gold Potential UpsidesHey Traders, in today's trading session we are monitoring XAUUSD for a buying opportunity around 3,370 zone, Gold is trading in an uptrend and currently is in a correction phase in which it is approaching the trend at 3,370 support and resistance area.
Trade safe, Joe.

Gold Breaks Out of Bullish Flag >> Eyes on $3,480 and $3,720Alright, so looking at this 4-hour chart of Gold, there's a really clean bullish flag pattern that’s just broken out, which is a strong continuation signal.
You can see that after that big push upward, the price consolidated inside a downward (sloping channel for a few weeks. That’s pretty classic behavior. a strong move followed by a period of rest where the market cools off a bit, but without giving up too much ground. That’s what forms the "flag."
Now, the exciting part is that we’ve just broken out of that channel to the upside, and it’s not just a breakout for the sake of it, it’s supported by an inverse head and shoulders right at the top of the channel. That’s a double confirmation that buyers are stepping in with conviction.
The chart also marks two potential targets:
The first target is around $3,480, which is a reasonable measured move based on the height of the flag.
The second target is around $3,720, which would be a more extended continuation if the momentum kicks in.
As long as the price holds above the breakout area (around $3,320–$3,340), this setup looks solid. If we pull back and retest that area and hold, that might be a great long entry with those two targets in mind.
If price drops back into the channel, though, that could mean the breakout was a fakeout, so that level is key.

Gold Holds Above Key Support – Eyes Still on 3400 (READ CAPTION)By examining the gold chart on the 4-hour timeframe, we can see that the price successfully hit the $3367 target exactly as expected, and then corrected back to $3346. Currently, gold is trading around $3358, and if it can hold above $3350, we can expect further upside. Based on the previous analysis, the next bullish targets remain at $3367, $3380, $3391, and $3400. (Maximum support is always appreciated, my friends!)

US market fluctuates around 3400-3370, short first
📌 Driving events
Heightened tensions between China and the United States have also fueled the bullish momentum of gold prices. As the upcoming trade negotiations between Washington and Beijing are full of uncertainty, investors have sought safe-haven assets such as gold.
Adding to the market's nervousness, President Donald Trump signed an executive order to double the import tariffs on steel and aluminum from 25% to 50%, effective June 4. The move came a few days before Trump's much-anticipated call with Chinese President Xi Jinping, further fueling concerns about escalating trade frictions.
📊Commentary and analysis
Gold failed to fall back to 3353 during the day, and the lowest point was 3360, and it ushered in an increase, and the highest point was 3403. In the short term, 3403 was suppressed, or it may fall back, and then it fell into volatility again. The idea is to suppress short positions around 3403, stop loss at 3413, and stop profit at 3380-3372. Short-term trading, pay attention to risks.
June 5th US gold short-term trading: short near 3400, stop loss 3413, light position, take profit 3375
Short near 3372, stop loss 3360, take profit 3400
⭐️ Note: Labaron hopes that traders can properly manage their funds
- Choose the number of lots that matches your funds

XAU/USD(20250605) Today's AnalysisMarket news:
U.S. economic data-① ADP employment increased by 37,000 in May, far below the expected 110,000 and the previous value of 62,000. ② The U.S. ISM non-manufacturing index in May fell to 49.9, shrinking for the first time in nearly a year, and the expected increase was from 51.6 to 52.
Technical analysis:
Today's buying and selling boundaries:
3366
Support and resistance levels:
3407
3392
3382
3351
3341
3326
Trading strategy:
If the price breaks through 3382, consider buying in, and the first target price is 3392
If the price breaks through 3366, consider selling in, and the first target price is 3351

Can gold prices continue to rebound?Market news:
Spot gold rose slightly in early Asian trading on Thursday (June 5), currently trading around $3,382/oz. Supported by a weaker dollar and weaker U.S. data, investors are struggling to cope with growing economic and political uncertainty. Against the backdrop of rising risk aversion demand and weak economic data, gold prices rose slightly. At the same time, tensions between major powers, progress in EU-U.S. trade negotiations, and rising market expectations for a Fed rate cut have further ignited enthusiasm in the gold market, and the possibility of London gold prices rising above the 3,400 mark has increased.
The job market is sluggish, some industries are laying off employees, and wage growth is offset by the cost of living. Inflationary pressures continue, and companies plan to raise prices to pass on tariff costs. The Fed said the economic outlook is unclear and it will continue to monitor data to adjust its policies. As a safe-haven asset in times of political and economic uncertainty, gold tends to perform strongly in a low-interest rate environment.
Investors are closely watching the U.S. non-farm payrolls report to be released on Friday, June 6, for clues to the Fed's next move. In addition, we also need to pay attention to the ECB interest rate decision and the changes in the number of initial jobless claims in the United States on this trading day. The market expects the ECB to cut interest rates by 25 basis points. In the medium and long term, it tends to support the international gold price. In addition, continue to pay attention to the international trade situation and speeches by Fed officials.
Technical Review:
Gold successfully bottomed out yesterday, with the lowest point of the day at 3344, which is not much different from the point of 3345 that we disclosed in the morning. The market point is basically in place. The small non-agricultural positives in the evening helped the gold price to rise further. The high point of gold is gradually approaching the pressure level of 3392. In the short term, the gold price is expected to break through the pressure and continue the upward trend!
The technical side of gold maintains the bullish low-multiple thinking. The daily chart price extends the MA5/10/7-day moving average high point upward, and the RSI indicator is hooked upward above the middle axis. The short-term four-hour chart and hourly chart moving average open upward, the Bollinger band opens upward, and the price is running on the upper and middle track of the Bollinger band. The main idea is to buy at a low price and sell at a high price.
Today's analysis:
Recently, the market, tariff trade policies, and geopolitical tensions have been affecting the strength of the US dollar and gold. Although it seems that gold is fluctuating upward for the time being and has not gone out of the space for a unilateral surge, it can be seen from this week's slow rise that gold is still an absolute buying trend. Therefore, no matter how it adjusts, falls back, or fluctuates, it is an opportunity to buy into the warehouse.
How to plan for the future market? I believe everyone has a clear direction in mind. Buying is very strong, just go with the trend. The important thing is the point. The low point below is moving up, which means that if the gold price drops again, the low point will not fall below 3344. Yesterday, the gold Asian and European sessions were in a volatile adjustment trend. After the release of the US session data, the gold price rose from 3350 to the current price of 3385 and then fell back. In terms of short-term operations, since the high point of the Asian session broke, it is still recommended to buy at a low price and focus on bullish operations.
Operation ideas:
Short-term gold 3350-3360 buy, stop loss 3340, target 3380-3400;
Short-term gold 3397-3400 short, stop loss 3408, target 3360-3340;
Key points:
First support level: 3363, second support level: 3350, third support level: 3333
First resistance level: 3388, second resistance level: 3396, third resistance level: 341

Gold------Buy near 3360-3380, target 3390-3400Gold market analysis:
Recently, the daily gold trading has begun to be a game. Today's idea is to continue buying and looking for buying opportunities. At present, it is an obvious shock rise, not a direct one-sided one. Don't rush to enter the warehouse. Yesterday, the daily line closed positive, and the short-term 3392 was suppressed. The daily moving average began to diverge. There is not much time for high-level shocks. The shock is mainly because this week is a data week. The market has too many uncertainties about the future. For example, yesterday's ADP employment data is like this. There is a more heavy NFP later. I estimate that the shock market will continue before the non-agricultural data. Today, we focus on the opportunity of shock retracement and continue to buy.
The analysis chart shows that the hourly shock range is 3392-3342. Yesterday's daily closing raised the shock platform. Today, we focus on the support of two shock platforms. One is around 3363, which is an hourly shock, and the other is 3354. This position is the moving average and pattern support. These two supports in the Asian session are both buying opportunities. In addition, if it breaks 3392, it may stand on 3400 and start a new bullish pull.
Support 3363, 3354, strong support 3343, suppression 3385, strong pressure 3392, the market strength and weakness watershed 3363.
Fundamental analysis:
The US ADP employment data released this time showed a significant reduction in employment, supporting gold to suppress the US dollar, and also giving the US market a new expectation for non-agricultural.
Operation suggestion:
Gold------Buy near 3360-3380, target 3390-3400

Gold can make new ATH...(05JUNE2025)As Gold had 2 weeks rally in early April, now is consolidating below the 33360 resistance on weekly timeframe for 7 weeks. I believe this important resistance eventually get broken and we see new all time highs for Gold.

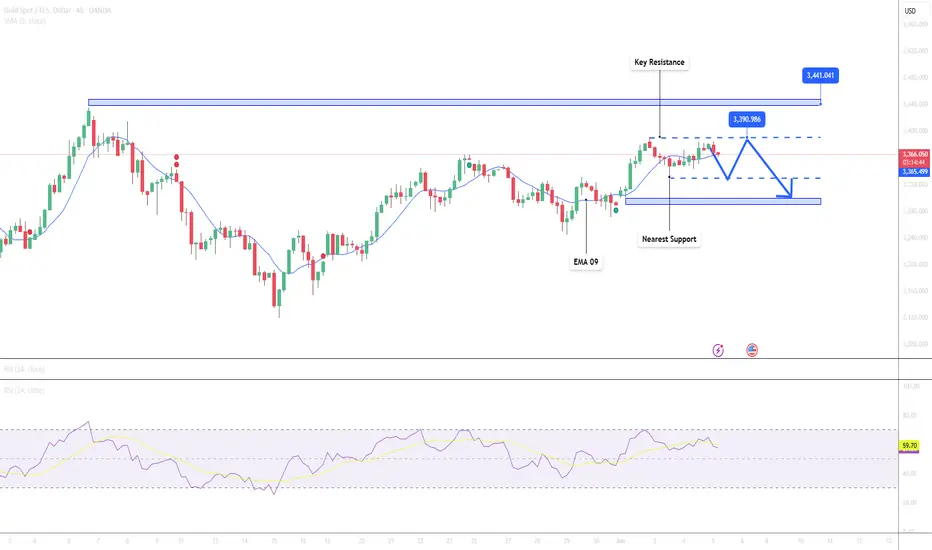
Gold Approaches Key Resistance – Minor Pullback Possible📊 Market Overview:
Gold prices continue their upward momentum and have now reached $3,367/oz, as markets await the upcoming U.S. Nonfarm Payrolls (NFP) report later this week. The U.S. dollar is slightly weaker and Treasury yields are stable, helping gold maintain its strength. However, mixed forecasts from major financial institutions are creating psychological pressure on investors.
📉 Technical Analysis:
• Key Resistance: $3,390 – $3,440
• Nearest Support: $3,330 – $3,300
• EMA: Price remains above both EMA 50 and EMA 9 → indicating a sustained uptrend.
• RSI (H4): Near 66 → not overbought yet, but limited room for further upside.
• Candle pattern: Recent H1 candles show long upper wicks → signaling profit-taking at higher levels.
📌 Outlook:
Gold may face a minor short-term correction if it fails to break above the $3,390 resistance area, especially as the upcoming U.S. jobs report could potentially strengthen the U.S. dollar.
💡 Suggested Trading Strategy:
SELL XAU/USD at: $3,375 – $3,390
🎯 TP: $3,355
❌ SL: $3,405
BUY XAU/USD at: $3,345 – $3,330
🎯 TP: $3,365
❌ SL: $3,315
XAU/USD) Breakout strong bullish trend Read The captionSMC Trading point update
Technical analysis chart of gold (XAUUSD) on the 4-hour timeframe. Here’s a breakdown of the key ideas presented in the chart:
---
Key Support/Resistance Zone
A yellow rectangular zone marks a significant support/resistance level.
This level was previously a resistance and has now been flipped into support ("new support level").
---
Trend Analysis
Uptrend line (lower diagonal line): Shows support and higher lows forming a bullish structure.
Downtrend lines (upper diagonals): Show past resistance levels being tested.
Strong downtrend line has now been broken, which is bullish.
---
Target Points
Three bullish targets are marked:
1. $3,436.70
2. $3,500.93
3. $3,647.33
These targets seem to be based on:
Breakout above the resistance zone.
Measured move projections from previous impulsive rallies.
---
Technical Indicators
200 EMA (Exponential Moving Average): Currently at $3,261.87, acting as dynamic support.
RSI (Relative Strength Index):
Current RSI is 54.80, indicating neutral momentum.
Previously touched overbought zone (~69), indicating strong recent bullish momentum.
---
Arrows
Green arrows mark strong bullish bounce points.
Red arrow marks a rejection from the downtrend line (previous resistance).
Mr SMC Trading point
---
Conclusion (Idea Summary)
Price has broken out of consolidation and downtrend resistance.
If the price holds above the yellow support zone and 200 EMA, a bullish continuation is likely.
Targets: $3,436 → $3,501 → $3,647.
Confirmation of breakout and momentum depends on volume and RSI behavior in coming candles.
---
pelas support boost 🚀 analysis follow)

Gold points to 3400, madness before data release.Market analysis:
Gold fell slightly to around 3361 in early trading on Wednesday. After falling to around 3346, it quickly rose to around 3372, then was blocked and fluctuated and fell. It fell to 3344 in the European session and then rebounded. It rose strongly to 3384 in the US session and fluctuated above 3370 in the late trading.
The daily line of gold showed a trend of alternating yin and yang. But the overall trend was upward. The 5-day moving average and the 10-day moving average formed a golden cross and extended upward, which provided moving average support for the gold price, allowing gold to maintain a strong and volatile trend. At present, the 5-day moving average is around 3352, and the 10-day moving average is around 3335. The first thing to pay attention to is the resistance of Tuesday's high of 3392. If the gold price can break through this resistance level, it is expected to continue the bullish trend.
In terms of points, first pay attention to the support near MA5/MAA10 below, and focus on the support of MA20 moving average. The downward exploration on Tuesday and Wednesday both defended the MA20 moving average position. Above this, it is treated as a strong shock. Secondly, pay attention to the support near 3335, which is the low point on Tuesday and the key to the short-term structure. Secondly, pay attention to the support near 3335, which is the low point on Tuesday and the key to the short-term structure. First pay attention to the resistance near 3395 above, and then pay attention to the resistance near 3415 and 3430, which are the previous high points.
Operation strategy:
Short near 3395, stop loss 3410, profit range 3380-3360
Long near 3360, stop loss 3350, profit range 3375-3380-3390-3400.

XAU/USD) Technical analysis Read The captionSMC trading point update
Technical analysis of Gold (XAUUSD) on the 1-hour timeframe. Here's a breakdown of the key ideas in the analysis:
---
Chart Elements:
Support Level (Yellow Zone at ~3,340–3,350):
This area has been highlighted as a key support zone where price has bounced previously.
Price is currently hovering just above this level.
Downtrend Line:
A descending trendline is drawn, indicating a short-term bearish trend.
A breakout above this line could trigger bullish momentum.
Two Scenarios Outlined:
Bullish Scenario:
If price breaks the downtrend and holds above support, it may rally towards the upper target point at 3,419.68.
Bearish Scenario:
If price breaks below the support, the next target point is marked lower around 3,300.62, a previous consolidation area and close to the 200 EMA (blue line).
200 EMA (~3,324.72):
Acts as dynamic support. If price moves below it, bearish sentiment may increase.
RSI (Relative Strength Index):
RSI is neutral (~50.54), not showing overbought or oversold signals, leaving room for movement in either direction.
---
Key Takeaways:
Neutral-Biased Setup: The price is consolidating between a clear support level and downtrend resistance.
Confirmation Needed: A breakout from either direction is necessary to confirm the next move.
Bullish Breakout: May lead to a retest of highs at 3,419.68.
Bearish Breakdown: Could push the price toward 3,300.62, aligned with past support and the 200 EMA.
Mr SMC Trading point
---
Trading Ideas (based on this analysis):
Long Entry: On breakout above the downtrend line + confirmation above 3,360.
Short Entry: On breakdown below 3,340 with strong volume.
Stop-Loss: Just outside the consolidation zone depending on trade direction.
Risk Management: Be cautious around economic news (calendar icons shown suggest upcoming events).
Please support boost this analysis )

Ascending triangle on gold: $3,280 or $3,560 next? Gold has climbed following softer-than-expected US economic data, which has strengthened speculation for at least two Federal Reserve rate cuts this year. ADP employment figures showed just 37K new jobs, well below the 111K forecast.
President Donald Trump, posting on Truth Social, called on “too slow” Fed Chair Jerome Powell to cut rates immediately.
The repeated tests of the $3,400 level suggest that selling pressure at this zone could be weakening. Lower interest rates tend to support gold prices, as the metal offers no yield. However, a daily close below the recent swing low of $3,280 would undermine the pattern.
